NOAA/NESDIS - Commercial Weather Data Pilot (CWDP) Round 2 Summary June 2020
←
→
Page content transcription
If your browser does not render page correctly, please read the page content below
NOAA/NESDIS

Commercial Weather Data Pilot (CWDP)
         Round 2 Summary

             June 2020
Commercial Weather Data Pilot: Round 2 Summary June 2020
Background
Radio Occultation (RO) is an established method for remote sounding of the atmosphere. The
technique uses an instrument in low-Earth orbit to track radio signals from Global Navigation
Satellite System (GNSS) transmitters as they rise or set through the atmosphere. The occulting
atmosphere refracts or bends the radio signals, and given the precise positions of both satellites,
the bending angle can be deduced from the time delay of the signal. Collecting these
measurements for a full occultation through the atmosphere provides a vertical profile of bending
angles, from which profiles of physical quantities such as temperature, humidity, and ionospheric
electron density can be retrieved. These data primarily feed numerical weather prediction (NWP)
models that support weather forecasts, and also support space weather applications.
Deployable on small satellites, RO instruments complement microwave and infrared sensors, fill
in the sparse geographical and temporal coverage of radiosondes, and provide vertical and
temporal resolution complementing other satellite observations. Weather centers currently ingest
thousands of RO profiles per day from various government satellite systems. Studies indicate
that increasing the quantity of RO data, particularly in orbits and times not served by government
systems, would further improve forecasts. Ionospheric observations from RO sensors also
enhance space weather situational awareness, revealing variations in the ionosphere that impact
GNSS performance and radio communications. Beyond these direct benefits, additional sources
of RO data could provide risk mitigation for any unexpected reductions in other data streams.
NOAA began assessing the potential of commercial sources of RO data in 2008 as part of
contracted studies to assess a variety of commercial capabilities. The availability of space-based
commercial RO data has grown in recent years, with two companies providing RO data from
space today.
CWDP Program Overview
To assess the viability of currently available commercial RO data sources, NOAA solicited
vendors with RO capabilities to participate in the Commercial Weather Data Pilot (CWDP)
program. In Round 1 (2016–2018), NOAA awarded contracts to GeoOptics and Spire Global.
However, GeoOptics did not have satellites in orbit in time to deliver any data and Spire only
succeeded in delivering data to partially meet their contract deliverables. NOAA concluded,
based on the results of Round 1, that the commercial sector was not able at that time to provide
the quality and quantity of RO data that NOAA requires for use in operational weather
forecasting. However, it showed potential and warranted further examination as capabilities
progressed.
In Round 2 (2018–2019), NOAA awarded contracts to three vendors—GeoOptics, Spire Global,
and PlanetiQ. In this second round the contracts identified additional performance features to
determine the suitability of commercial sources to meet NOAA’s operational mission needs.
GeoOptics and Spire delivered data to fulfill their contract requirements. PlanetiQ did not launch
their first satellite in time to deliver any data. This document summarizes our evaluation of the
GeoOptics and Spire datasets delivered in Round 2.
1Commercial Weather Data Pilot: Round 2 Summary June 2020
The CWDP program is managed and administered by the NOAA National Environmental
Satellite, Data, and Information Service (NESDIS). For Round 2 technical evaluations, NESDIS
leveraged expertise from the following groups:
● University Corporation for Atmospheric Research (UCAR): data processing and quality
assessment
● NESDIS Center for Satellite Applications and Research: data quality assessment
● Joint Center for Satellite Data Assimilation: NWP impact assessment
● NOAA Space Weather Prediction Center: ionospheric product evaluation
Following data evaluation, all data were archived at the NOAA National Centers for
Environmental Information.
NOAA shared the Round 2 Pilot data with partner government organizations. Those agencies
may make independent value assessments of the data, matched against their specific agency
mission objectives.
Evaluation Results
Data Volume, Coverage, and Vendor Processing Capabilities
The Round 2 Request for Proposal (RFP) set a minimum requirement of 500 profiles per day,
and each vendor proposed to meet or exceed that minimum, with their respective contracts
requiring a specific number of profiles per day over a specific data delivery period. NOAA
contracted with GeoOptics to deliver data from November 2018 through July 2019. In order to
meet the data quantity requirements of their contract, NOAA extended the data delivery period
for GeoOptics through October 2019. Spire’s data delivery period covered June and July 2019.
Both datasets consistently exceeded the minimum requirement for 500 profiles per day and were
of sufficient duration to assess their quality and viability for NWP and space weather
applications.
Vendors provided Level 1 data (geolocated instrument signals) per the RFP requirements. Both
vendors met all requirements for Level 1 data delivery.
NOAA retrieved Level 2 products from the vendors’ Level 1 data using the UCAR-hosted
COSMIC Data Analysis and Archive Center (CDAAC) systems. NOAA uses the CDAAC to
process RO data from COSMIC-1/2, Kompsat, and PAZ. All results described below are based
on the CDAAC-processed Level 1 data that passed CDAAC quality control.
Both vendors also provided Level 2 products (retrieved physical parameters from the Level 1
data) per an option to do so provided in the RFP. The GeoOptics Level 2 products exhibited a
number of intrinsic issues and underwent multiple version changes throughout the data delivery
period. Spire’s Level 2 products were mature and stable, with only one minor revision to the
delivered data.
GeoOptics provided data from two satellites in high-inclination sun-synchronous orbits, with
well-distributed global sampling but limited local time coverage. Data from a third, non-sun-
synchronous GeoOptics satellite enhanced the local time coverage, but the satellite failed early in
the delivery period. Spire operated many satellites, from which a subset of twelve provided data
2Commercial Weather Data Pilot: Round 2 Summary June 2020
for Round 2. The majority of the Spire satellites were also in sun-synchronous orbits. Latitude
and local time distributions of the measurements for both vendors for the June–July 2019 period
are shown in Figure 1. The geographic coverage of the data from both companies is similar,
extending from pole to pole with a concentration in the midlatitudes. Such sampling would
complement the six operational COSMIC-2 satellites, which are in low-inclination orbits and
measure between ± 40 degrees latitude. More evenly distributed local time coverage would be
beneficial, particularly for climate applications, however, such distribution was not a requirement
of the Round 2 Pilot.
Figure 1: Latitudinal distribution (top row) and local time sampling (bottom row) for June and July, 2019. Results
for GeoOptics are on the left and results for Spire are on the right.
NOAA included an option to provide near-real-time data in the Round 2 RFP, but neither vendor
pursued this option. As such, NOAA was not able to assess the providers’ ability to meet NWP
or space weather latency requirements.
Measurement Quality
To assess the sensitivity of the instruments, the analysis conducted by NOAA examined several
metrics, including:
● Standard deviation of the difference between the bending angles and a model climatology
in the 60–80 km region, denoted STDV
● Signal-to-noise ratio (SNR) of the commercial systems for each GNSS frequency
● Mean and standard deviation of differences between the RO data and collocated
radiosondes, satellite measurements, and modeled measurements from NWP forecasts
STDV is of particular interest because it is predominantly determined by receiver noise and other
residual errors, and thus is a good indication of the system’s inherent noise floor. Figure 2 shows
the distribution of STDV values for June–July 2019. Statistics are broken out separately for the
3Commercial Weather Data Pilot: Round 2 Summary June 2020
different GNSS constellations1, as they vary in performance. Both vendors provided profiles
from GPS and GLONASS, while Spire also provided measurements from Galileo and QZSS
(QZSS results are not shown here).
Figure 2: Distributions of high-altitude bending angle standard deviation (STDV) for Jun-Jul 2019 profiles passing
CDAAC Quality Control. Note, some values exceed 3 microradians.
NOAA also computed the SNR to characterize the responsiveness of the systems to GNSS
transmissions. SNR and STDV results are summarized in Table 1 with COSMIC-1/2 values
listed for comparison. SNR values shown here are for the GPS L1 frequency, as all RO
instruments measure this signal. Higher SNR and lower STDV are indicative of superior
sensitivity and performance.
Table 1: Sensitivity of Commercial RO Systems as Compared to COSMIC-1/2
Mean GPS L1 SNR Mean High Altitude Bending Angle Noise, STDV
RO System
(Volts/Volt) (microradians)
GeoOptics 649 1.49
Spire 366 2.34
COSMIC-1 750 1.40
COSMIC-2 1513 1.05
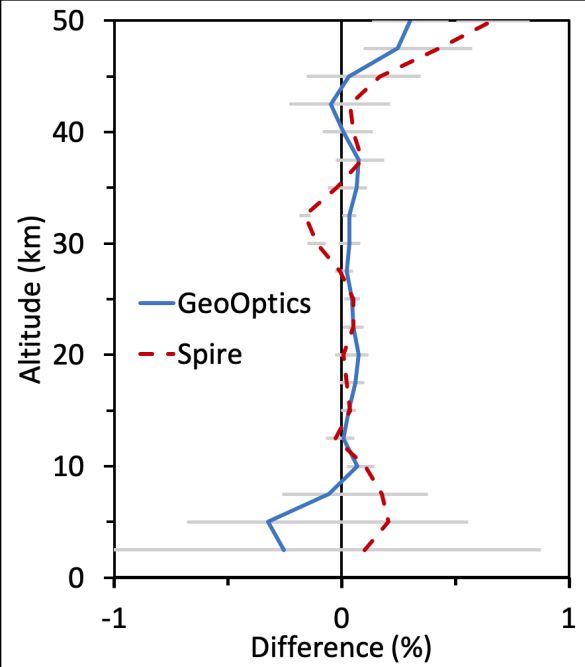
Our analysis of the Pilot data also assessed the accuracy and precision of the bending angle
profiles by comparing them with nearby radiosonde measurements, other established satellite
measurements, and NWP models. One such comparison is shown in Figure 3. Here we
computed the average bias with respect to the GFS model for operational data from COSMIC-1,
KOMPSAT, TerraSAR, TanDEM, and Metop A-C sensors for July 2019. Figure 3 shows the
difference between the bias of the vendor data and the operational RO data. Both GeoOptics and
1
GPS (Global Positioning System, USA); GLONASS (GLObalnaya Navigatsionnaya Sputnikovaya Sistema,
Russia); Galileo (Europe); QZSS (Quasi-Zenith Satellite System, Japan).
4Commercial Weather Data Pilot: Round 2 Summary June 2020
Spire data exhibit good agreement with the operational data between about 8 and 40 km (note the
scale is 1%). Below 8 km, the number of measurements declines and interference from water
vapor and other sources becomes significant, so RO measurements are generally less reliable,
and above 40 km, measurement error limits their accuracy.
Figure 3: Comparison to operational RO
measurements. The average bias in bending angle
with respect to the GFS model background was
computed for COSMIC-1, KOMPSAT-5, TanDEM-X,
TerraSAR-X, and Metop A-C data from July 2019.
The difference between the bias of the operational
sensors and the average bias for GeoOptics (solid)
and Spire (dashed) for the same period are shown.
No collocation of measurements was performed,
and measurements were effectively globally
distributed. Error bars indicate the standard
deviation of the bias in the operational sensors.
Data Assimilation Studies and Impact on NWP
To assess the impact of the commercial RO data on NWP, NOAA conducted data assimilation
experiments for each dataset. In these experiments, the GFS forecast model was run with and
without the vendor’s data incorporated, in addition to the existing operational data sources, and
the accuracy of the two forecasts was compared. Forecasts were run for two 30-day periods for
each vendor. For GeoOptics, January and July 2019 were used, as it is instructive and customary
to evaluate data from separate seasons. For Spire, only June and July data were available, and
these months were used in two separate trials. In each experiment, we measured the data’s
impact on the 1, 3, and 5 day forecasts for temperature, wind, and height, stratified by pressure
level. Results were quantified in terms of the mean, variance, and anomaly correlation (a relative
skill measure), and broken down by latitude band or region. Here we detail the results of the data
assimilation experiments, which assessed the impact of each vendor’s data against standard
benchmarks. The vendors were not evaluated against each other.
GeoOptics: The strongest positive impact of the GeoOptics data was seen in the Day 1 forecast
in southern latitudes. A positive impact also extended to some aspects of the Day 3 forecast
in southern latitudes, and the Day 1 forecast in the north. Some positive impacts extended to
the Day 5 temperature forecast in southern latitudes. The anomaly correlation impact was
positive or neutral everywhere. The vendor data tended to reduce the temperature and wind
forecast variability globally through Day 3. However, the data had a slightly negative impact
on the mean bias, increasing it in several instances.
5Commercial Weather Data Pilot: Round 2 Summary June 2020
Spire: The data produced a marked positive impact on the Day 1 forecast; in the southern
latitudes this was seen for all variables, and for height and temperature in the north. The
positive effect was generally weaker near the surface, and the height forecast was slightly
degraded at some pressure levels. Beyond Day 1, there was no beneficial impact on any
variable in the north, and a slight improvement in Day 3 high altitude wind forecast in the
south. Anomaly correlation was positive or neutral everywhere, with the exception of a small
negative effect on heights in the northern latitudes. Variability was significantly reduced for
all variables at almost every pressure, but the bias increased almost everywhere. In the
tropics, reduced wind and temperature variability for some pressure levels persisted to Day 3.
In general, for both vendors, NOAA’s data assimilation experiments showed slightly positive
impact for the 1- to 3-day forecasts, and neutral results for the 5-day forecasts. These results are
comparable to preliminary results seen in similar experiments run on data from operational
systems (e.g., PAZ, Metop-C), and indicates that long-term ingestion of the vendors’ data would
be beneficial to NOAA’s NWP systems. It is notable that the doubling of the number of profiles
per day from Spire in July, as compared to June, produced a clear beneficial impact.
Ionospheric Products for Space Weather
The NOAA Space Weather Prediction Center analyzed the quality and potential value of the
Round 2 data for NOAA’s space weather applications. Vendors provided total electron content
(TEC: the number of electrons per unit area along the signal path) measurements, electron
density profiles (EDPs: the number of electrons per unit volume as a function of altitude), and S4
and σφ scintillation indices (measures of small-scale ionospheric variability). CDAAC
independently produced TEC from the vendors’ data. TEC and scintillation indices reveal any
rapid variations in the ionosphere, which can impact the accuracy and availability of GNSS
systems. EDPs are used to model and improve high frequency radio communications. Together,
RO space weather products help end users plan and avoid operational delays in critical services.
GeoOptics: GeoOptics provided TEC measurements and S4 indices but did not provide σφ
indices or EDPs. GeoOptics’ absolute TEC data matched the characteristics of the
corresponding CDAAC-processed data. The TEC measurements improved results of
NOAA’s operational Global TEC (GloTEC) data-assimilation model. The GloTEC model
provides situational awareness when ionospheric disturbances affect GNSS performance,
radio communications, and satellite operations. GeoOptics’ ionospheric products included
measurements from GLONASS, which could improve data volume and coverage.
Comparison against ground-based TEC measurements through GloTEC showed good
agreement. The S4 indices were of mixed quality, with only one satellite providing data
adequate for situational awareness.
Spire: Spire provided TEC measurements, S4 and σφ scintillation indices, and EDPs. Quality
varied across satellites and antennas, but some of the data showed usefulness in the GloTEC
model, helping the model resolve small scale structures and rapid fluctuations in the
ionosphere. Some TEC measurements contained excessive amounts of negative values, but
others appeared adequate. Comparison with ground-based TEC measurements showed
favorable agreement, with small but acceptable negative biases. S4 indices were low
frequency (1 Hz) and inconsistent between different Spire satellites with many invalid
values. σφ measurements were noisy and difficult to evaluate. EDPs were well-calibrated, and
6Commercial Weather Data Pilot: Round 2 Summary June 2020
extracted measures related to peak electron density generally agreed with data from
COSMIC-1 and co-located ionosonde measurements.
Overall, both vendors provided TEC measurements with the quality and coverage that would
improve NOAA’s space weather products. Scintillation measurements did not adequately cover
lower elevation angles. Spire EDPs were of adequate quality. It should be noted that the
evaluation period did not witness any significantly large space weather events, so the
performance of the systems during such critical events was not evaluated.
Summary and Conclusion
Table 2 provides a synopsis of the key findings of our Round 2 technical evaluation.
Table 2: Key Findings of CWDP Round 2 Evaluation
Evaluation GeoOptics Spire
Neutral Noise and bias is comparable to C1 and K5. Noise and bias is slightly higher than C1 and K5,
Atmosphere Error assessment is within range of other especially at high altitudes. Error assessment is
Products governmental RO platforms. within range of other governmental RO platforms.
Comparable to government assets recently Comparable to government assets recently
NWP Impact
evaluated, such as C1. evaluated, such as C1.
Useful for space weather products.
Ionospheric Noisy, but adequate for space weather products.
Scintillation data could improve situational
Products Electron density profiles may also be useful.
awareness.
Polar orbits provide global coverage and Polar orbits provide global coverage and
Geographical
complement C2, but local-time coverage is complement C2, but local-time coverage is
Coverage
limited. limited.
Support for
Responsive to all requests and flexible on Responsive to all requests and flexible on
Problem
changing requirements. changing requirements.
Resolution
Did not sign up for near-real-time deliveries Did not sign up for near-real-time deliveries in
Delivery Latency
in Round 2. Round 2.
Maturity of
Initial data had significant issues. Over a Mature products, with only a minor update made
Processed
dozen versions of data were provided. during the delivery period.
Products
Abbreviations: C1 = COSMIC-1; C2 = COSMIC-2; K5 = KOMPSAT-5
Based on the results of the technical evaluation of the data provided by two vendors in the
CWDP Round 2 Pilot, NOAA has concluded that the commercial sector is capable of providing
the quality of data needed to help support NOAA’s operational weather forecasting needs. As a
result, NOAA is proceeding with plans to acquire commercial RO data for operational use.
7You can also read