Lateral and axial measurement differences between spectral-domain optical coherence tomography systems
←
→
Page content transcription
If your browser does not render page correctly, please read the page content below
Lateral and axial measurement
                 differences between spectral-domain
                 optical coherence tomography systems

                 Francisco A. Folgar
                 Eric L. Yuan
                 Sina Farsiu
                 Cynthia A. Toth

Downloaded From: https://www.spiedigitallibrary.org/journals/Journal-of-Biomedical-Optics on 21 Jan 2021
Terms of Use: https://www.spiedigitallibrary.org/terms-of-use
Journal of Biomedical Optics 19(1), 016014 (January 2014)
Lateral and axial measurement differences between
spectral-domain optical coherence tomography
systems
Francisco A. Folgar,a Eric L. Yuan,a Sina Farsiu,a,b and Cynthia A. Totha,b,*
a
Duke University, Department of Ophthalmology, Durham, North Carolina 27710
b
Duke University, Department of Biomedical Engineering, Durham, North Carolina 27710
Abstract. We assessed the reproducibility of lateral and axial measurements performed with spectral-domain
optical coherence tomography (SDOCT) instruments from a single manufacturer and across several manufac-
turers. One human retina phantom was imaged on two instruments each from four SDOCT platforms: Zeiss
Cirrus, Heidelberg Spectralis, Bioptigen SDOIS, and hand-held Bioptigen Envisu. Built-in software calipers
were used to perform manual measurements of a fixed lateral width (LW), central foveal thickness (CFT),
and parafoveal thickness (PFT) 1 mm from foveal center. Inter- and intraplatform reproducibilities were assessed
with analysis of variance and Tukey-Kramer tests. The range of measurements between platforms was 5171 to
5290 μm for mean LW (p < 0.001), 162 to 196 μm for mean CFT (p < 0.001), and 267 to 316 μm for mean PFT
(p < 0.001). All SDOCT platforms had significant differences between each other for all measurements, except
LW between Bioptigen SDOIS and Envisu (p ¼ 0.27). Intraplatform differences were significantly smaller
than interplatform differences for LW (p ¼ 0.020), CFT (p ¼ 0.045), and PFT (p ¼ 0.004). Conversion factors
were generated for lateral and axial scaling between SDOCT platforms. Lateral and axial manual measure-
ments have greater variance across different SDOCT platforms than between instruments from the same
platform. Conversion factors for measurements from different platforms can produce normalized values for
patient care and clinical studies. © The Authors. Published by SPIE under a Creative Commons Attribution 3.0 Unported License.
Distribution or reproduction of this work in whole or in part requires full attribution of the original publication, including its DOI. [DOI: 10.1117/1
.JBO.19.1.016014]
Keywords: ophthalmology; imaging systems; image acquisition; spectral-domain optical coherence tomography; Fourier domain opti-
cal coherence tomography.
Paper 130671RR received Sep. 22, 2013; revised manuscript received Dec. 12, 2013; accepted for publication Dec. 16, 2013; pub-
lished online Jan. 17, 2014; corrected May 18, 2015.
1 Introduction retinal segmentation software to show retinal thickness measure-
Optical coherence tomography (OCT) provides high-resolution, ments with widespread variation between instruments, but
cross-sectional tomographic images of the human retina and per- differences reported in each study were not consistent.15–17
mits direct evaluation of retinal thickness.1 Recent technological A model eye eliminates variability caused by anatomic
developments in spectral-domain OCT (SDOCT) have greatly differences between human patients and by potential morpho-
increased imaging capabilities compared to earlier time-domain logic changes between imaging sessions due to diurnal fluctua-
technology. SDOCT provides estimates of retinal layer thick- tions, vascular changes, head tilt, or subject fixation. In a recent
nesses across the macula to aid in clinical diagnosis and treat- study, a customized model eye with a retinal nerve fiber layer
ment decisions for a variety of ocular diseases.2–6 Interpretation phantom has been used to assess thickness differences between
of data has been complicated by the variety of platforms SDOCT platforms and individual instruments.18 However, this
designed by commercial SDOCT instrument manufacturers, study used automated retinal segmentation software from
each with different proprietary software technologies. Previous each SDOCT platform, which causes reproducible thickness
studies have identified OCT-derived retinal thickness measure- differences between platforms by using different anatomic
ment variability due to differences in their segmentation algo- definitions to identify retinal layer boundaries.7–10 Furthermore,
rithms, their reported axial resolutions in tissue, their scan previous studies have not addressed SDOCT measurements of
density options, and their ability to correct for subject fixa- lateral width, which are important for novel SDOCT methods of
tion.7–13 Additional anatomic factors vary between individual disease analysis, such as drusen diameter and geographic atro-
patients, including axial length, refractive focal length, and phy in age-related macular degeneration.6
macular curvature.14 These anatomic variations may affect the Accurate interpretation of retinal measurements for the treat-
accuracy of comparing lateral and axial measurements between ment of macular diseases and for clinical research requires
SDOCT instruments in clinical studies.14 Other studies have consistency and reproducibility between different SDOCT
addressed measurement differences inherent to individual instru- platforms and between instruments from the same platform.
ments with the same time-domain OCT (TDOCT) platform.15–17 Significant differences in the quantitative measurements
These TDOCT studies have used large sample sizes and built-in obtained manually from different SDOCT platforms may sup-
port the use of a conversion scale to compare data obtained
*
Address all correspondence to: Cynthia A. Toth, E-mail: cynthia.toth@dm.duke
from different systems. The purpose of this study is to determine
.edu the variability of lateral and axial retinal measurements among
Journal of Biomedical Optics 016014-1 January 2014 • Vol. 19(1)
Downloaded From: https://www.spiedigitallibrary.org/journals/Journal-of-Biomedical-Optics on 21 Jan 2021
Terms of Use: https://www.spiedigitallibrary.org/terms-of-useFolgar et al.: Lateral and axial measurement differences between spectral-domain optical. . .
SDOCT instruments from the same commercial platform and obtained with each SDOCT instrument in masked and indepen-
across different systems. dent fashion. We selected anatomic landmarks on the tissue phan-
tom that could be readily identified and measured in the lateral or
2 Methods axial planes of the central B-scan image. The lateral measurement
was performed on the lateral width (LW) of the tissue phantom.
2.1 Model Eye Axial measurements were performed on the central foveal thick-
A commercially available Rowe model eye (Rowe Technical ness (CFT), parafoveal thickness (PFT) at 1 mm to the left of
Designs, Orange County, California) was selected for SDOCT center, and PFT at 1 mm to the right of center. These measure-
imaging in this study. The manufacturer’s technical details ments included the largest dimensions of the tissue phantom in
describe the solid-state retinal tissue phantom as a 4.8-mm- the lateral and axial planes in order to capture as much range of
diameter cylinder made of translucent polymethyl methacry- error as possible across SDOCT platforms. Figure 1 shows the
late.19 The retinal tissue phantom has ∼300 μm thickness in borders defined for each manual measurement on different
the axial plane and a central depression of 0.9 mm radius SDOCT platforms. Instruments from the same SDOCT platform
and 180 μm central thickness, designed to simulate the natural had the same version of software and built-in screen calipers to
foveal pit.19 A single model eye was used for all imaging. The take manual measurements. On all platforms, measurement accu-
model eye was removed and realigned on the same horizontal racy was limited by pixel resolution and automatically converted
and vertical axis prior to each scan in order to reduce error from to microns or millimeters by built-in software.
image tilt between different instruments. Alignment was con- Intergrader reproducibility of retinal measurements was
firmed by securing the model eye to a bracket attached to assessed with intraclass correlation coefficients (ICC) and 95%
each SDOCT instrument and then centering the flat base of
the tissue phantom with the 0-deg horizontal axis on the display
screen. This process was repeated for every scan obtained with
each instrument. Portable instruments were held and centered by
hand with the 0-deg horizontal axis on the display screen.
2.2 SDOCT Instruments and Imaging Protocols
Eight separate SDOCT instruments were selected from three
manufacturers and four SDOCT system platforms. We used
two Spectralis devices (Spectralis™ OCT software version 5.3,
Heidelberg Engineering, Carlsbad, California), two Cirrus devi-
ces (Cirrus™ HDOCT software version 5.2, Carl Zeiss Meditec,
Dublin, California), and four Bioptigen OCT devices: two port-
able hand-held Envisu devices and two tabletop SDOIS devices
(Envisu™ software version 2.0 and SDOIS software version 1.3,
Bioptigen Inc., Morrisville, North Carolina).
All systems used superluminescent diode light sources with
broad bandwidths centered between 800 and 900 nm, achieving
an axial resolution of ∼5 μm per pixel. In order to make fair
comparisons between instruments, raster scanning protocols were
matched between platforms as closely as permitted by their
respective software. The Cirrus platform (840 nm) and both
Bioptigen platforms (820 nm) captured 6 × 6-mm raster scans
consisting of 128 B-scans with 512 A-scans per B-scan. Due
to its software restrictions, the Spectralis platform (870 nm) cap-
tured 20 deg ×20 deg raster scans (∼5.9 × 5.9 mm) consisting
of 97 B-scans with 512 A-scans per B-scan. To assess reproduc-
ibility, 10 raster scans were performed on each instrument. Scans
from both Bioptigen platforms were optimized for dispersion
mismatch during imaging due to refractive index differences
between the Rowe model eye and the average human eye. Cirrus
and Spectralis software performed automatic optimization of
dispersion during scan acquisition.
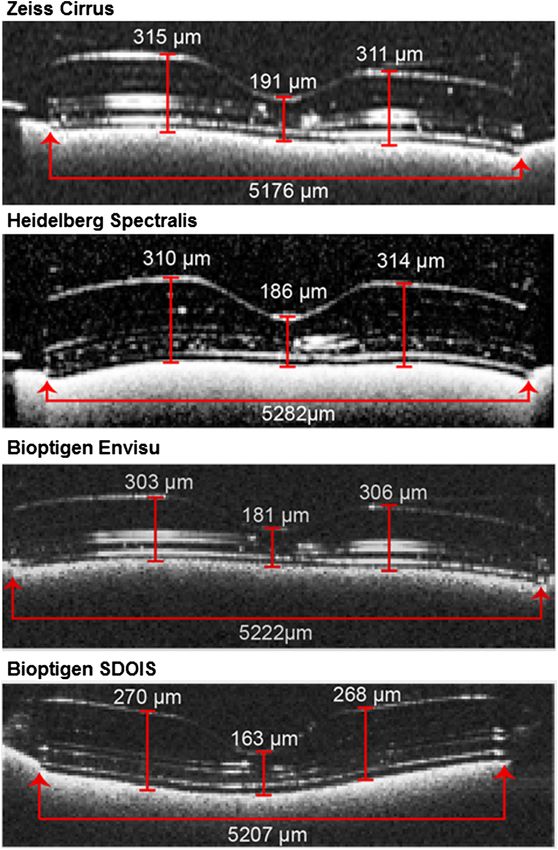
2.3 SDOCT Measurements and Statistical Analysis Fig. 1 Model eye measurements were obtained for the fixed lateral
width, center foveal thickness, and parafoveal thickness 1 mm to
Two graders viewed all SDOCT scans and agreed upon the one the left and right of center. The B-scan with the widest width and mini-
B-scan with the minimum central thickness that best approxi- mum central thickness of the circular tissue phantom was selected for
mated the foveal center of the retinal tissue phantom. Images measurements. Lateral width was defined as the horizontal distance
at the base. Axial thickness was defined as the vertical distance from
were viewed in each platform’s standard display screen, and the inner border of the hyperreflective inner retinal surface to the inner
image processing was not allowed (i.e., magnification, brightness, border of the hyperreflective base substrate beneath the tissue phan-
contrast, summation, or Gaussian smoothing). Each grader per- tom. Values shown here are mean values obtained with each spec-
formed measurements on the central B-scan of 10 raster scans tral-domain optical coherence tomography platform.
Journal of Biomedical Optics 016014-2 January 2014 • Vol. 19(1)
Downloaded From: https://www.spiedigitallibrary.org/journals/Journal-of-Biomedical-Optics on 21 Jan 2021
Terms of Use: https://www.spiedigitallibrary.org/terms-of-useFolgar et al.: Lateral and axial measurement differences between spectral-domain optical. . .
confidence intervals (CI). Due to high intergrader agreement, and Bioptigen SDOIS had the least (4-μm difference in mean
data from both graders were combined to assess intraplatform width, p ¼ 0.042). For LW measurements, Spectralis had
variability between instruments and interplatform variability the greatest single-instrument variance (COV ¼ 1.309) and
between SDOCT systems. Coefficients of variance (COV) were Bioptigen Envisu had the least (COV ¼ 0.236). For CFT mea-
calculated for each instrument and measurement, and instru- surements, Cirrus had the greatest variance between instruments
ments were compared with two-tailed t-tests. Intra- and inter- (9-μm difference in mean CFT, p < 0.001) and Bioptigen
platform differences for each measurement were assessed with Envisu had the least (3-μm difference in mean CFT,
analysis of variance models and Tukey-Kramer tests. All statis- p < 0.001). For PFT measurements, Bioptigen Envisu had
tical analysis was performed with SAS statistical modeling soft- the greatest variance between instruments (9-μm difference in
ware (SAS JMP 10, SAS Institute, Cary, North Carolina), and mean PFT, p < 0.001), whereas Cirrus and Bioptigen SDOIS
p valuesFolgar et al.: Lateral and axial measurement differences between spectral-domain optical. . .
Table 2 Comparison of measurements between instruments with the same platform.
Lateral width CFT 1 mm right PFT 1 mm left PFT
Mean (SD) ANOVA Mean (SD) ANOVA Mean (SD) ANOVA Mean (SD) ANOVA
μm COV p value μm COV p value μm COV p value μm COV p value
Zeiss Cirrus™
Instrument 1 5171 (15) 0.286 0.034 187 (3) 1.559Folgar et al.: Lateral and axial measurement differences between spectral-domain optical. . .
Table 4 Conversion factors for lateral measurements across platforms.
Convert from this platform
Lateral scaling Zeiss Cirrus™ Heidelberg Spectralis™ Bioptigen Envisu™ Bioptigen SDOIS
Zeiss Cirrus™ 0.980 0.991 0.994
Heidelberg Spectralis™ 1.020 1.011 1.014
Convert to
this platform Bioptigen Envisu™ 1.009 0.989 1.003
Bioptigen SDOIS 1.006 0.986 0.997
Table 5 Conversion factors for axial measurements across platforms.
Convert from this platform
Axial scaling Zeiss Cirrus™ Heidelberg Spectralis™ Bioptigen Envisu™ Bioptigen SDOIS
Zeiss Cirrus™ 1.011 1.037 1.174
Heidelberg Spectralis™ 0.990 1.025 1.160
Convert to
this platform Bioptigen Envisu™ 0.964 0.975 1.132
Bioptigen SDOIS 0.852 0.862 0.884
than recent SDOCT studies, in part due to the inferior pixel res- investigators to test their separate contributions to measurement
olution of TDOCT systems.7–10 variability.
This study is the first to rigorously compare quantitative We have also demonstrated statistically significant variability
manual measurements from several commercial platforms utiliz- in manual measurements of a single retinal tissue phantom
ing a commercially available model eye. We decided to evaluate between two different instruments with the same SDOCT plat-
two commercial platforms that are commonly used in human form. Variability between these instruments may result from
adult imaging, clinical research, and randomized clinical inherent variability in the optical path length measured at
trials.2–4 We chose a commercial hand-held portable platform two different time points, variability in the degree of decalibra-
approved for retinal imaging in pediatric human sub- tion between instruments that occurs over time with regular
jects5,14,20–22 and in basic animal research.23–25 Furthermore, use, or measurement variability caused by speckle noise. We
the largest ongoing randomized trial for age-related macular attempted to control for decalibration by selecting same-plat-
degeneration (AMD), the NEI-sponsored Age-Related Eye form instruments with similar frequency of use in daily clinical
Disease Study 2, exclusively allows the Bioptigen SDOIS plat- care. In SDOCT, speckle noise results from interference
form for its longitudinal, observational ancillary SDOCT study between densely packed reflectors, reducing contrast between
(AREDS2 Ancillary SDOCT Study).6,26 The baseline dataset highly scattering structures in tissue.27 However, the averaging
and measurements for both control and AMD eyes in this methods commonly used by commercial SDOCT platforms
study has been made publicly available.6 were not applicable to the motionless imaging protocol of
Several studies have concluded that comparing retinal thick- this study, where speckle noise was highly correlated across
ness with instruments from different manufacturers is not images and instruments. Figure 1 showed acceptably low image
advised for clinical studies.7–10 Determining the true variability noise, and even state-of-the-art denoising algorithms produce
in these measurements with a cohort of patients would be biased some level of image blur,27 permitting us to perform measure-
by errors in lateral and axial scaling. For example, Spectralis ments on the unprocessed images shown. Based on the small
machines are programmed to offer scan parameters based on differences between graders (Table 1) and between same-plat-
degrees of visual angle; however, it provides caliper measure- form instruments (Table 2), we concluded there was negligible
ments in millimeter distance. The same visual angle would effect of speckle noise on measurement variability.
span a shorter diameter in an eye with shorter axial length, Measurement differences between platforms were sta-
but the distance would be converted to the same millimeter dis- tistically significant; however, the clinical significance of this
tance as a scan distance on a longer eye. Axial measurement difference is less clear. With the exception of the Bioptigen
differences may be caused by variability in the default algo- SDOIS, the SDOCT systems evaluated in this study had low
rithms for automated segmentation line placement, refractive variability from a clinical standpoint, albeit statistically signifi-
index correction, or dispersion compensation across different cant. Lateral scaling variability was 0.3 to 2% between plat-
SDOCT platforms. Since these calculations are proprietary com- forms, which represents a range of 15 to 106 μm in width
ponents of each platform’s software, it is difficult for third party difference between images (based on nominal 6-mm scans
Journal of Biomedical Optics 016014-5 January 2014 • Vol. 19(1)
Downloaded From: https://www.spiedigitallibrary.org/journals/Journal-of-Biomedical-Optics on 21 Jan 2021
Terms of Use: https://www.spiedigitallibrary.org/terms-of-useFolgar et al.: Lateral and axial measurement differences between spectral-domain optical. . .
divided by sampling density of 512 A-scans). Axial measure- 9. A. C. Sull et al., “Comparison of spectral/Fourier domain optical coher-
ments performed in this study suggest that variability across ence tomography instruments for assessment of normal macular
thickness,” Retina 30(2), 235–245 (2010).
all platforms was 1.1 to 17% between platforms, equivalent
10. L. Pierro et al., “Macular thickness interoperator and intraoperator
to a difference of 5 to 45 μm based on the nominal axial reso- reproducibility in healthy eyes using 7 optical coherence tomography
lution of these SDOCT platforms. Excluding the axial measure- instruments,” Am. J. Ophthalmol. 150(2), 199–204 (2010).
ments from the Bioptigen SDOIS, which were consistently 11. S. R. Sadda et al., “Impact of scanning density on measurements from
smaller than all other platforms, the mean difference decreased spectral domain optical coherence tomography,” Invest. Ophthalmol.
toYou can also read