DE BEERS IN SOUTH AFRICA - The contribution of Venetia Mine to the communities of Musina and Blouberg - Genesis Analytics
←
→
Page content transcription
If your browser does not render page correctly, please read the page content below
D E BEERS IN
S O U TH A FRICA
The contribution of Venetia Mine
to the communities of Musina
and Blouberg

April 2017
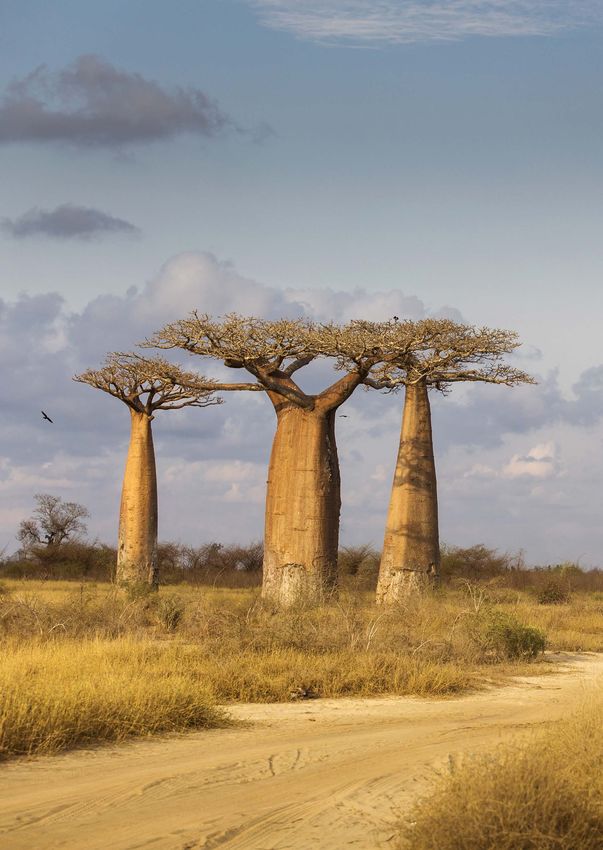
TABLE OF CONTENTS
ABBREVIATIONS AND DEFINITIONS                               1
EXECUTIVE SUMMARY                                           2

    1. WHAT THIS REPORT IS ABOUT                            5
    2. USING THE RIGHT TERMS                                5
    3. DATA NOTE                                           6
    4. ABOUT VENETIA MINE                                  6
    5. WHAT IS CONTRIBUTION?                                8
    6. ABOUT MUSINA AND BLOUBERG                           9
           6.1. WHEN THE MINE STARTED                      9
           6.2. MUSINA AND BLOUBERG TODAY                  10
           6.3. SUMMARY                                    15
    7. EMPLOYMENT                                          17
    8. INCOME GENERATION                                   19
           8.1. AGGREGATE WAGES                            19
           8.2. WAGE INCREASES FOR RESIDENTS               19
           8.3. BENEFITS                                   20
           8.4. AVERAGE PACKAGES IN CONTEXT                20
    9. HOUSING			                                          22
    10. INFRASTRUCTURE                                     23
    11. INVESTMENT IN EDUCATION, HEALTH, SPORTS AND ARTS   26
    12. TRAINING AND DEVELOPMENT                           30
    13. FISCAL CONTRIBUTION                                32
    14. LOCAL PROCUREMENT                                  33
    15. LOCAL ENTERPRISE DEVELOPMENT                       34
    16. CONSERVATION                                       36
           16.1.		VENETIA LIMPOPO NATURE RESERVE           36
           16.2.		MAPUNGUBWE NATIONAL PARK                 36
    17. REPORT NOTES                                       38

BIBLIOGRAPHY			                                            38
LIST OF FIGURES AND TABLES
FIG 1. LOCATION OF THE VENETIA MINE		                                                                     6
FIG 2. TIMELINE OF THE VENETIA MINE		                                                                     7
FIG 3. POPULATION GROWING IN MUSINA, FALLING IN BLOUBERG		                                               10
FIG 4. YOUNG POPULATIONS, ESPECIALLY IN MUSINA		                                                          11
FIG 5. IMPROVING BUT LOW LEVELS OF EDUCATION		                                                            11
FIG 6. HIGH LEVELS OF YOUTH UNEMPLOYMENT		                                                                12
FIG 7. HOUSEHOLDS IN MUSINA AND BLOUBERG HAVE IMPROVING BUT LOW INCOMES                                   13
FIG 8. A NEED FOR MORE FORMAL HOUSING IN MUSINA (2011: OF 20 042 HOUSEHOLDS IN THE LM)                    14
FIG 9. MORE FORMAL HOUSING IN BLOUBERG THAN IN MUSINA (2011, OF 41 192 HOUSEHOLDS IN THE LM)              14
FIG 10. MUSINA'S ECONOMY IS DOMINATED BY AGRICULTURE AND MINING (2011)                                    14
FIG 11. BLOUBERG'S ECONOMY DOMINATED BY AGRICULTURE AND GOVERNMENT (2011)                                 15
FIG 12. FRAMEWORK FOR ASSESSING VENETIA MINE'S CONTRIBUTION		                                            16
FIG 13. NUMBER OF WORKERS AT THE VENETIA MINE (2004 - 2015)		                                             17
FIG 14. THE TOTAL WAGE BILL AND TOTAL WAGES PAID TO RESIDENTS		                                          19
FIG 15. AVERAGE GROWTH OF WAGES PER RESIDENT HAS BEEN ABOVE CPI                                          19
FIG 16. TOTAL WAGES AND BENEFITS (2004 TO 2015, NOMINAL RANDS)		                                         20
FIG 17. THE MAJORITY OF RESIDENT EMPLOYEES AT THE VENETIA MINE FALL INTO THE B-BAND INCOME GROUP         20
FIG 18. STRUCTURE OF A B-BAND EMPLOYEE'S PACKAGE, AVERAGE 2015		                                          21
FIG 19. DE BEERS HOUSES MORE THAN 630 FAMILIES IN MUSINA		                                               22
FIG 20. THE VENETIA MINE HAS INVESTED IN PHYSICAL INFRASTRUCTURE IN MUSINA AND BLOUBERG                  24
FIG 21. SINCE 2006 DE BEERS HAS SPENT A CUMULATIVE R144M ON CSI IN MUSINA AND BLOUBERG                   27
FIG 22. CSI DISTRIBUTION OF SPENDING HAS ALMOST TRIPLED SINCE 2005                                       27
FIG 23. SKILLS DEVELOPMENT SPENDING AT THE VENETIA MINE (2010 - 2015)                                    30
FIG 24. RESIDENT EMPLOYEES HAVE BEEN THE GREATEST BENEFICIARIES OF TRAINING SPENDING                      31
FIG 25. THE VENETIA MINE CONTRIBUTES TO MUSINA FISCUS (NOMINAL RANDS: 2007 - 2015)                       32
FIG 26. THERE HAS BEEN AN INCREASE IN BEE PROCUREMENT SPENDING SINCE 2004 (PERIOD: 2004 - 2015)          33
FIG 27. THE VENETIA MINE PROCUREMENT FROM MUSINA AND BLOUBERG AS A PROPORTION OF TOTAL PROCUREMENT (2015) 33
FIG 28. ZIMELE FUND HAS INVESTED IN LOCAL SMES		                                                         34

TAB 1. INFRASTRUCTURE IN MUSINA AND BLOUBERG		                                                           25
TAB 2. TYPES OF TRAINING PER EMPLOYMENT BAND		                                                           30
ABBREVIATIONS
& DEFINITIONS
Acronym    Meaning
B-BBEE     Broad-Based Black Economic Empowerment
BEE        Black Economic Empowerment
CAGR       Compound Annual Growth Rate
CONTOPS    Inconvenience top-ups (an allowance accrued
           by employees for the inconvenience of out of
           the ordinary working shifts)
CPI        Consumer Price Index
CSI        Corporate Social Investment
CSO        Central Selling Organisation
CSR        Corporate Social Responsibility
DBCM       De Beers Consolidated Mines Limited
DBE        Department of Basic Education
ED         Enterprise Development
EPWP       Expanded Public Works Programme
FET        Further Education and Training
HDSA       Historically Disadvantaged South African
IDP        Integrated Development Plan
LAC        Local Area Committee
LED        Local Economic Development
LGDS       Limpopo Growth and Development Strategy
LM         Local Municipality/Municipalities
LoM        Life of Mine
NPO        Non-Profit Organisation
NUM        National Union of Mineworkers
OpCo       Operations Committee
RDP        Reconstruction and Development Programme
SANParks   South African National Parks
SEIA       Socio-Economic Impact Assessment
SLP        Social and Labour Plan
SMME       Small, Medium and Micro Enterprises
SME        Small and Medium Enterprises
VLNR       Venetia Limpopo Nature Reserve
VMFund     Venetia Mine Fund
VUP        Venetia Underground Project

                                                          1
S U MMARY O F C O NT RI B U T I O N TO M US I N A A N D BLO UBERG
    HISTORY OF THE VENETIA MINE
          1969
                                                              The mine produces 4 million carats
          De Beers has           1992                         of diamonds a year, which accounts for
          been working in                                     75% of De Beers’ diamond production
          Limpopo since          Venetia mine                 in South Africa.
                                                                                                                        75%

                                                                                                                                    2046
          1969.                  opened in 1992.
    1969

                                           The life of Venetia Mine has been extended until 2046 with a further
                                  investment of US$ 2billion, the largest ever mining investment in South Africa.

    EMPLOYMENT                                                INCOME GENERATION
                In 2015, there were 3795 workers (De Beers’    From 1992 to 2015 it is estimated that Venetia Mine paid
                employees plus contractors) at the mine,       wages into the local economy of between R3,4 billion and
                of which 2606 (68%) were local residents.      R6 billion. Over the last decade, the average wages of local
                                                               resident increased by 11% a year. (Average inflation was
                Of De Beers' employees at the mine,            6%)
                86% were local residents.
                                                               In 2015, the average wage and benefits package
                                                               for a B-Band local resident was R238,782 a year.
                                                               This is THREE times the annual average household
                                                               income in Musina, and SIX times the average
                                                               household income in Blouberg.

                                                                            MUSINA     MUSINA     MUSINA
    HOUSING
     De Beers has built 522 homes in Musina town.                           BLOUBERG   BLOUBERG   BLOUBERG   BLOUBERG    BLOUBERG   BLOUBERG
     It rents another 109 properties.
     De Beers has facilitated home ownership schemes                                     Annual average total
     for employees in Blouberg and Musina.                                               income for B-Band employee

                                                              INFRASTRUCTURE
                                                               De Beers has invested in local infrastructure including
                                                               construction and maintenance of 17 primary and
                                                               secondary schools, sports facilities, electrification plants
                                                               and distribution networks; water infrastructure, and roads
                                                               including the R521 that stretched between Alldays and
                                                               Musina.
         432
     De Beers-owned
                               109
                          De Beers-rented
                                                   90
                                                Homes built
      houses built        accommodation          for VUP                 De Beers has connected five villages
                                                                         and 337 households in Blouberg, and
                                                                         600 households in Musina to the national grid.

2
HEALTH AND EDUCATION
      From 2006 to 2015 De Beers invested R144 million in education,
      health and community initiatives in Blouberg and Musina.                                                                                  R144 m
      Education projects have assisted approximately 3000 learners and funded 27 extra teachers.

SKILLS DEVELOPMENT
In 2015, R31 million was spent on skills development at the mine.

      SKILLS DEVELOPMENT SPENDING AT THE VENETIA MINE (2010 – 2015)
        (Nominal)                                                                        R30 881 297                 More than 4,000
                                                                                                                     beneficiaries received
                                                                            R27 649 911
                                                                                                                     training in 2015
                                                           R24 051 946

                                           R17 367 113
       R13 966 178     R14 997 304
                                                                                                                     80% of these
                                                                                                                     training beneficiaries
                                                                                                                     were local residents.
         2010               2011             2012               2013              2014         2015

LOCAL ECONOMIC PROCUREMENT
      85% of mine procurement in 2015 was from                                                   Between 2011 and 2015, the De Beers Zimele hub supported
      BEE entities, compared to 19% in 2004.                                                     47 small businesses in Musina and Blouberg with a total
                                                                                                 investment of R11,8 million in debt financing.
      In 2015, the mine procured R137 million
      (3.39% of total procurement) locally.                                                      These companies supported 648 jobs in Limpopo.

      VENETIA MINE ZIMELE FUND LOAN VALUE

                                          Total + R11,8M
 4                                                                           LOANS PER SECTOR (2011 - 2015)
                                                    R3,7M                                                                                        47 small
3,5
                                                                                                                                                businesses
 3                                                                     R3,1M             R3M
                                                                                                      R2,8M
                                                                                                                                                = 648 jobs
2,5                           R2,6M
                 R2,4M
 2                                          R2,1M

1,5
                                                                                                               R1M
                                                                                                                         R0,9M     R0,8M
 1
        R1,0M
0,5

 0
                                                                       Services     Agriculture Construction Transport   Retail Manufacturing
         2011        2012          2013     2014         2015

      LOCAL TAXES
      From 2007 to 2015 the mine paid
      R88 million in municipal taxes.

                                                                                                                                                             3
4
1. WHAT THIS
REPORT IS ABOUT
The De Beers Group of Companies was established in South
Africa in 1888 during the Kimberley diamond rush.

Today De Beers is the world’s largest diamond producer by value. De Beers has
mining operations in South Africa, Canada, Botswana and Namibia. De Beers is
active in the exploration, mining, sorting, valuing, selling, and marketing of diamonds.

The Venetia Mine (the mine) is situated in the Limpopo province in South Africa,
about 88kms from the town of Musina, it is in the administrative area of Musina
Local Municipality (Musina). The mine also draws workers from the nearby
Blouberg Local Municipality (Blouberg). Musina and Blouberg are regarded
as the mines’ local communities.

De Beers wanted to understand the contribution Venetia Mine has made
in Musina and Blouberg over the life of the mine, and asked economic
consultants, Genesis Analytics, to research the following question:

      “What socio-economic contribution did Venetia
      Mine make to the municipal areas of Musina
      and Blouberg from 1992 to 2015.”
The research included a review of data provided by De Beers, historical information
from the De Beers' archives, and 32 research interviews with De Beers’ staff members.

2. USING THE RIGHT TERMS
The following terms are differentiated in the report:

    WORKERS                                 EMPLOYEES                               LOCALS: This means
This means all workers at Venetia      This means all workers                  employees of De Beers who are
Mine, whether they are employees       at Venetia Mine who are                 resident in Musina or Blouberg and
of De Beers or contractors.            employed by De Beers.                   who are originally from the areas.
                                                                               These employees give their primary
    NON-RESIDENTS                           RESIDENTS                          residence in Musina or Blouberg.
This means employees of De Beers       This means employees of De Beers        An example is a mine worker from
who do not reside on a long-term       who are resident on a permanent,        Alldays who was born in the area, and
basis in Musina or Blouberg. Non-      long-term basis in either Musina or     who has her primary residence in
residents live further afield and      Blouberg. While residents may have      Musina.
commute to the mine – non-residents    secondary abodes further afield
do not contribute as much to the       they reside in the local areas on a
local areas as residents. An example   permanent basis, and thus contribute         Most of the reporting
would be a mine supervisor who lives   significantly to the local area. An          in this document
in Polokwane and drives to Venetia     example would be a mine engineer
Mine every day.                        who originally hails from the Eastern
                                                                                    takes place at the
                                       Cape but now resides in Musina.              level of residents.

                                                                                                                       5
3. DATA NOTE
Historical research is always dependent on the
availability and quality of historical information.
Sometimes information is captured in a way that does not help the
research. The impact the mine has had on local employees (those
born and bred in Musina or Blouberg) is of great interest; yet most
information is available only at the level of residents rather than locals.
Residents make an important contribution as their permanent home is in
Musina or Blouberg and they are active members of the local economies.
Secondly, some historical information was not available for
the period prior to 2004. De Beers switched to a new finance
and payroll system in 2004 and legacy data was not available.
As such, much of the research deals with contribution from
2005 to 2015, going back to 1992 where it is possible.
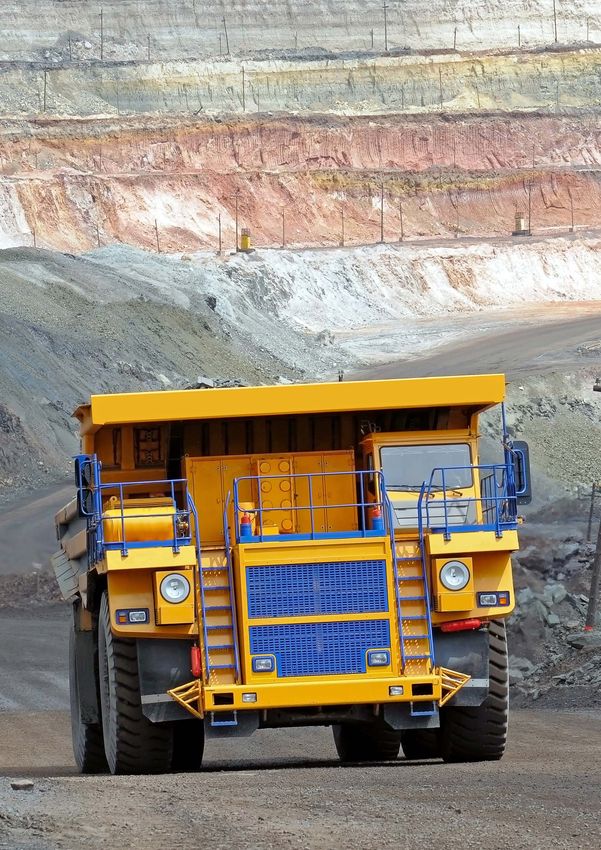
4. ABOUT VENETIA MINE
The Venetia Mine is situated in the Limpopo province in
South Africa. The mine, which covers an area of 2,680 hectares,
is about 80km west of the town of Musina, which is 10km south
of the Zimbabwean border.
The mines is 36km east of the small town of Alldays which
is in the Blouberg Local Municipality. Most of the workers
on the mine come from Musina and Blouberg.
FIGURE 1 | LOCATION OF THE VENETIA MINE
Musina
South Africa Musina
Limpopo
Limpopo
South Afica
6Diamond-bearing gravels were discovered close to the Limpopo River
and 35km north east of the present mine as early as 1903. In 1969, De Beers
launched a reconnaissance sampling programme to locate the source of these
deposits. Viable kimberlite pipes were discovered in 1980 and construction of
the mine began in 1990.
Venetia was officially opened on 14 August 1992 and reached full
production in 1993.
Presently, Venetia is South Africa’s largest
diamond mine with an annual output of
4.3 million tons of ore – which yields
4 million carats of diamonds a year.
The mine accounts for 75% of De Beers’ diamond production in South Africa.
FIGURE 2 | TIMELINE OF THE VENETIA MINE
1969
1992 2022
De Beers launched a 1992 2002
reconnaissance sampling Venetia Mine officially The underground mine
2046
programme to locate the opened on 14 August Mapungubwe National Mapungubwe is expected to begin
source of these deposits 1992 Park proclaimed SANParks Lease production in 2021
1969
1990 1993 2003 2013 2046
Construction of the Establishment of the Mapungubwe established Excavation work begins Projected end
Venetia Mine begins Venetia Limpopo as a World Heritage Site on the underground of life of mine
Nature Reserve extension
Venetia is an open-pit mine.
The ore body is mined by drilling,
Water is also held in a storage dam
that supplements usage during
Excavation work
blasting, loading and hauling the dry season. The mine uses on the underground
waste rock and kimberlite with approximately 6.1 million cubic extension of the
conventional truck-and-shovel meters of water a year, and a third
methods. Crushed ore is conveyed of process water is recycled. mine began in
to a treatment plant, where the 2013, an investment
kimberlite is further crushed,
washed and screened into
Venetia is located in an
environmentally sensitive area
of US$ 2 billion
different size fractions. and De Beers has spent about - the largest ever
R17 million over the life of mine mining investment
After drying, hand-sorting on environmental engineering
recovers the diamond stones, projects. It established the in South Africa.
which are sent to the offices 36,000 hectare Venetia Limpopo
in Kimberley for classification Nature Reserve adjacent to The first production from
based on combinations of size, the mine and moved a large the underground project is
shape, colour and quality. number of animals from the scheduled for 2021, climbing
mining area to the reserve. to full production in 2025.
The mine operates on a
continual basis, 24 hours a day, Open-pit mining will continue This underground project will
seven days a week, 365 days a year. until 2021 and will be replaced extend the mine’s life to 2046
Employees work shifts for four by underground mining and is expected to produce 96
days, followed by four days off. to reach deeper pipes. million carats of diamonds over
its extended 21 year life span.
Venetia draws water from the
Limpopo River which is pumped
35km to reservoirs at the mine.
75. WH AT IS
CONTRIBUTION?
The purpose of this report is to describe the socio-economic contribution
made by the Venetia Mine to the municipal areas of Musina and Blouberg.
WHAT DOES CONTRIBUTION MEAN?
The contribution of a company to surrounding communities can be described
in any number of ways. Each way will use a different unit of measurement.
For example, contribution to employment is measured in number of jobs
created; contribution to income generation can be quantified in a rand value.
Conceptually, the parts of economic contribution are expressed in this equation:
Total contribution =
Measured contribution x (1 – Developmental context)
where:
Measured contribution is data collected from De Beers, and
Developmental context is the level of socio-economic development in the area
In other words, contribution is relative to the environment in which the contribution
is made. The contribution of a mine in Australia to job creation, a developed country
where unemployment is low would be relatively low compared to an area like Musina and
Blouberg where unemployment is endemic and there are few alternate jobs. Likewise, the
communities surrounding a diamond mine in Canada, will enjoy relatively high levels of
education. Social investment initiatives in education will have lower impact there than in
an area without schools or teachers.
For this reason the report starts with an introduction to the developmental context in
Musina and Blouberg. The context helps to either amplify or diminish total contribution.
86. ABOUT MUSINA
AND BLOUBERG
6.1. WHEN THE
MINE STARTED
According to the first feasibility The feasibility study indicates However, the Alldays authorities
study done of Venetia in the late that the northern Bochum area at the time were unwilling to
in the then self-governing state accept the racially integrated
1980s, the area surrounding
of Lebowa2 was of particular community proposed by De
the present day mine was importance to Venetia as Beers, as the company refused to
known as ‘Region G’1 and it represented the largest segregate staff. The authorities
comprised of, “the Northern potential source of semi- in Musina town took a more
Transvaal from Warmbad in skilled and unskilled labour enlightened view and agreed
the south, Phalaborwa in the in the area. The area had a that a racially-mixed community
population of 100 000 in 1990. could be established in Musina
east, Thabazimbi in the west
notwithstanding the Group
and Messina in the north.” Infrastructure in the area was Areas Act of the time, which
minimal: there were no hard forbade mixed race communities.
The feasibility study records that roads, no central water points Although Musina town was more
in 1985 the total population of in most villages, no water- than twice the distance as Alldays
Region G was 2.75 million people borne sewerage disposal, and it was decided that the mine staff
with an estimated population limited electrification. There would be housed in Musina.
growth rate of 4.3% recorded were 36 schools, with just seven
annually from 1970 to 1985. The high schools offering matric In 1990 Musina had a recorded
region comprised 12% of South certification. Most villages had population of only 12 000. The
Africa’s population. The rate of a clinic, a liquor store, and a largest employer was the Messina
urbanisation in the area at the general dealer. Copper Mine which was moving
time was 8%. Only 36% of the towards closure at the end of the
labour market was employed or Alldays was the closest small 1980s just as construction started
seeking employment in 1985. town to the mine situated 36km on Venetia in 1990.This provided
away. Few people lived in the a new employer for the miners in
Educational standards were town (population was estimated the area.
extremely low. Only 17% of the to be less than 100). Alldays
population in the region had had one shop, two petrol filling
attained a Standard 6 (today’s stations, a small hotel, a small
Grade 8 equivalent); the other hospital and a primary school.
83% had less education than a
Standard 6. The people in the Due its proximity to the
area were young with about 60% mine, De Beers had initially
of the population younger than 20. earmarked Alldays for housing
the mine’s employees.
1 This predates the establishment of present day administrative areas but it is
likely that parts of both Blouberg and Musina would have been in this area.
2 This area now falls within the Blouberg Municipality.
96.2. MUSINA AND
BLOUBERG TODAY
The large administrative area DEMOGRAPHICS
of Musina, which spans 757 829
ha, is in the northern part of the According to the Community Blouberg is smaller in size
Limpopo Province and is bordered Survey by StatsSA, in 2015 Musina than Musina but has a bigger
by Botswana and Zimbabwe. It is had a population of 94 462, which population. In 2015 the population
one of four local municipalities accounted for about 2% of the was recorded as 160 604, which
within the Vhembe District population of Limpopo. The accounts for 3% of the population
Municipality. population has nearly tripled of Limpopo. The municipality is
since 1996 when it stood at just mostly inhabited by the Bahananwa
The town of Musina3 developed 33,061. According to local reports, and Batlokwa people, with a
from 1905 around the copper the population has grown rapidly smaller number of Vha-Venda,
mining industry. ‘Musina’, is because of the growing trading and Afrikaans and English-speaking
Tshivenda for ‘spoiler’, because migrancy links with Zimbabwe in people.
copper was considered a poor the north.
substitute for iron. Official statistics suggest that
Labour migration to the miner the population of Blouberg has
The local administrative area of and the municipality’s proximity fallen – from 171,721 in 2001
Blouberg spans an area of 505 to Botswana and Zimbabwe has (Census) to 160 604 in 2015.
400 ha and also in the Limpopo created a multi-ethnic municipality.
province. It was established Major languages spoken in the area Blouberg has
in 2000 after the union of the are Tshivenda, Xitsonga, Sepedi,
Afrikaans and English.
a declining
Bochum-My-Darling, Alldays-
Buysdorp, and parts of Moletjie-
population, while
Matlala Transitional Local The town of Musina is home to the population in
half of the municipal population
Councils. Its jurisdiction was
further expanded in 2006 after with half located in rural areas and Musina continues
the formal incorporation of smaller villages. to grow.
the Tolwe, Vivo, Maastroom,
Swaartwater and Baltimore areas
which were previously in the
Makhado and Lephalale LMs.
FIGURE 3 | POPULATION GROWING IN MUSINA, FALLING IN BLOUBERG
-5,3%
171 721
162 629 160 604
+74%
94 462
68 359
39 310
2001 2005 2011 2015
BLOUBERG MUSINA
Sources: StatsSA | Genesis Analytics analysis, 2016 | National Census, 2011
3 Previously spelled Messina.
10The size of the youth population in FIGURE 4 | YOUNG POPULATIONS,
Musina is above the national average ESPECIALLY IN MUSINA
and almost half the total population of Total youth (15-34)
the municipality. Blouberg is largely population as a %
of total (2015)
made up of people older than 34 or
under 15.
47%
Musina’s population is relatively young with 46.8% of the
NATIONAL
residents in 2015 aged 15 to 34, which is noticeably higher
POPULATION
than the national average. 36%
34%
There are fewer young people (15 to 34) in Blouberg, compared
to both the national average and Musina. This may be attributable
to fewer economic opportunities and smaller towns in Blouberg
than in Musina and economic migration in search
of employment.
EDUCATION, EMPLOYMENT AND INCOME
Although improving, formal educational
levels remain low in both municipalities.
In Musina in 2011 (latest figures available) 11% of the population MUSINA BLOUBERG
older than 20 had no schooling, 22% had completed matric, and
only 7% had a higher education qualification.
Sources: StatsSA | Genesis Analytics
analysis, 2016 | Socio-economic Assessment
The levels of education in the Blouberg are better than Musina for Report 2013 | National Census, 2011
the population over 20. As with Musina, the number of people with
no schooling has decreased. In 2011, 13% of the Blouberg population
had obtained tertiary level of education, an improvement from 2001.
FIGURE 5 | IMPROVING BUT LOW LEVELS OF EDUCATION
MUSINA BLOUBERG
100% 100%
No Schooling 26% No Schooling 27%
22% 25%
Matric 12% 11% Matric 17% 13%
Higher Education 5% 7% Higher Education 9% 13%
0% 0%
2001 2011 2001 2011
Sources: StatsSA | Genesis Analytics analysis, 2016 | Socio-economic Assessment Report 2013 | National Census, 2011
*Education does not add up to 100%, as other categories not reported on.
11Although youth unemployment levels in Musina have
improved it remains the biggest economic challenge. With a
23% unemployment rate amongst youths (aged 15 to 34).
There is exceptionally high youth unemployment in Blouberg,
which is higher than the average in Musina and the national
average. Fully 47% of those aged 15 to 34 are unemployed.
FIGURE 6 | HIGH LEVELS OF YOUTH UNEMPLOYMENT
100%
Blouberg 47% 47% In Blouberg
36% 47% of those
National 32%
Musina 28% aged 15 to 34
23%
are unemployed.
0%
2001 2011
Sources: StatsSA | National Census, 2011
Although real household incomes have improved since 2001 Average household
income levels in Musina are low compared to the national household
comparators. Average household income in Musina was R2 878 in 2011.
income in Musina
Low income levels and high rates of unemployment can be partially was R2 878
attributed to the poor skills levels within Musina. in 2011.
The population of Blouberg is exceptionally poor with a average
household income in 2011 of just R1 610 (real income) per month
– this is lower than the Musina average, as well as the provincial and
national averages.
In Blouberg, real household incomes increased slightly between 2001
and 2011 with the main sources of income being migrant remittances,
pensions and social grants. 762 of 41 192 households are headed by
children.
Blouberg - more so than Musina - has an infrastructure backlog in water,
road, sanitation, education facilities and healthcare infrastructure.
762 of the 41 192 households in
Blouberg LM are headed by children.
Real income refers to the income of an individual after taking
into consideration the effects of inflation on their ability to buy
goods and services.
12FIGURE 7 | HOUSEHOLDS IN MUSINA AND BLOUBERG HAVE IMPROVING BUT
LOW INCOMES (MONTHLY AVERAGE HOUSEHOLD INCOME; REAL INCOME)
R4867
The average
National R4032
Average household
R2878
incomes in
Musina and
R2681
Blouberg are
Musina R2188
Limpopo R1915
much lower
Blouberg R1263
R1610 than the
national
average.
0%
2001 2011
Sources: StatsSA | Socio-economic Assessment Report 2013 | National Census, 2011
HOUSING
Less than 1% of Musina is urban.
The only significant urban area is Musina town.
In the 2011 National Census it was recorded that there were
20 042 households in Musina. 75% of these were formal houses,4
an improvement from 2001 when only 55% were formal houses.
Informal dwellings are either shanty towns near Musina town or
basic farm dwellings.
The tenure status within the Musina indicates that 43% of households
are in rental accommodation and 28% are in fully-paid-for houses.
According to the 2011 National Census, Blouberg has 41,192 households
with 93% of these classified as formal households. This has increased from
72, 5% in 2001. Tenure data indicates that 59% of formal houses are both
fully paid and owned or currently being paid off by their residents.
4 Formal houses are characterized as a house or brick/concrete structure. Informal dwellings are
a makeshift and temporary structure, not approved by a local authorities and made with found
materials like corrugated iron and plastic.
13FIGURE 8 | A NEED FOR MORE FORMAL HOUSING IN FIGURE 9 | MORE FORMAL HOUSING IN BLOUBERG THAN
MUSINA (2011: OF 20 042 HOUSEHOLDS IN THE LM) IN MUSINA (2011, OF 41 192 HOUSEHOLDS IN THE LM)
MUSINA BLOUBERG
Formal dwelling Formal dwelling
7%
Informal dwelling Informal dwelling
25%
75% 93%
Sources: StatsSA | National Census, 2011 Note: Informal dwelling: Makeshift structure not approved by a local authority and not intended as
a permanent dwelling. Typically built with found materials (corrugated iron, cardboard, plastic, etc.). Formal housing refers to a house or brick/
concrete block structure.
ECONOMIC PROFILES
Agriculture is the main While mining is a valuable activity An important heritage site
economic activity in Musina, accounting for 30% of output, is located in Musina, the
it is not an especially large Mapungubwe National Park.
accounting for 35% of GDP,
employer, accounting for just The park’s principal feature is
with mining accounting for 4% of employment. The highest Mapungubwe, a great hilltop
30%. concentration of mining activities citadel that served as the capital
are in the western parts where of an advanced 13th century
In Musina agricultural employs Venetia Mine is located, and in African kingdom and it is also
54% of the population many on areas surrounding Musina town. a world heritage site. Botanical
a casual and seasonal basis. highlights include fine specimens
of baobab trees and impala lilies,
which are protected species.
FIGURE 10 | MUSINA'S ECONOMY IS DOMINATED BY AGRICULTURE AND MINING (2011)
Agriculture, Forestry and Fishing Community, Social and Personal Services
65%
Mining Finance and Business Services
Transport and Communication Wholesale, Retail Trade, Catering and Accommodation
Manufacturing Construction
35% 30% 15% 11% 11% 9% 6% 5%
Sources: StatsSA | Socio-economic Assessment Report 2013 | National Census, 2011
In Blouberg, agriculture and government services are the main economic activities. The biggest economic activity
is government services which suggests a smaller private sector and high dependency on social welfare within the
Blouberg.
14Mining prospects are being Tourism has been identified San rock art paintings in the
developed in Harriswhich as a key future economic Makgabeng Mountains, the
(platinum), Steamboat Farms driver in Blouberg. There Malebogo/Boer battlefields,
(coal, gold and other minerals) are various plans to develop as well as game farms.
and Indermark and Eussorinca and grow the sector. Tourist
(sand mining). Platinum prospects attractions in the area include
exist in the Dalmyn, Windhoek- the Blouberg Nature Reserves,
Papegaai and Silvermyn areas.
FIGURE 11 | BLOUBERG'S ECONOMY DOMINATED BY AGRICULTURE AND GOVERNMENT (2011)
Community, Social, Personal Services (govt)
53% Other
Agriculture, Forestry and Fishing
Construction
Wholesale, Retail Trade, Catering and Accommodation
Finance and Business Services
Private Household
Transport, Storage and Comms
29% 24% 13% 12% 10% 6% 6% 3%
Sources: StatsSA | Socio-economic Assessment Report 2013 | National Census, 2011
6.3 SUMMARY
A picture emerges of two areas where life is improving but still difficult
in many ways. Musina and Blouberg have the following challenges:
MUSINA BLOUBERG
THIS MEANS THE BIGGEST CONTRIBUTIONS
THE VENETIA MINE CAN MAKE THAT HAVE
THE BIGGEST IMPACT ARE:
High levels of poverty and low household Employment and income generation
incomes (especially in Blouberg);
Employment; investment in skills
A young population (growing in Musina; declining
development; support for education;
in Blouberg) with poor education and skills levels,
enterprise development
Exceptionally high unemployment, especially Employment; income generation;
youth unemployment, particularly in Blouberg; enterprise development
Formal housing deficits (which are
worse in Musina than Blouberg);
Investment in shared infrastructure;
Infrastructure backlogs; and
pay taxes
Highly concentrated economies where the top Development of tourism assets;
two activities together account for more than environmental protection
50% of the LM output.
15FIGURE 12 | FRAMEWORK FOR ASSESSING
THE VENETIA MINE’S CONTRIBUTION
Employment
and Household
Income
Enterprise Housing and
Development Infrastructure
Venetia Mine
Local contribution to Skills
Procurement Development
Musina LM and
Blouberg LM
Local Taxes Education
Environmental
Investments
167. EMPLOYMENT
The Venetia mine is large employer 3 795 workers
in total
in an area of high unemployment. 967
FIGURE 13 | NUMBER OF WORKERS AT THE VENETIA MINE (2004 - 2015)
Contractor
2606 resident workers
in total =68% of all
1299
workers are residents
968 927 973 1154 1178 992 1103 1121 1243 1372 1497 1529
222
59%
Employees
1307 of Venetia Mine
employees are local to
Musina and Blouberg
2004 2005 2006 2007 2008 2009 2010 2011 2012 2013 2014 2015 2015
Non-resident contractors
All employees Resident employees Resident contractors
Non-resident employees
Resident employees
Sources: De Beers, 2016 | Genesis Analytics analysis, 2016 Note: *The data shows the top
10 contractors on the mine who cumulatively account for about 80% of contractor spend.
The actual total number of contractors is will be higher.
THE DATA SHOWS THAT:
Venetia Mine is a large employer in areas of high unemployment. The Venetia Mine is a
A total of 3795 workers were active at the mine in 2015.
large employer in areas
Of 3 795 workers at the mine, 2 606 are resident in Musina of high unemployment.
and Blouberg. That is to say 68.6% of people working on There were 3795
the mine reside locally.
workers in 2015.
There are more contractors (2266) than De Beers’ employees
(1529). Many contractors are employed on the construction of
the Venetia Underground Project. 68.6% of people
working on the mine
De Beers’ employee numbers at the mine have grown in every are local residents.
year except in 2009 when the mine put a freeze on hiring
following the global financial crisis. Between 2004 and 2015,
an annual average of 1171 people were employed.
Of De Beers' employees
Of De Beers employees, most (86% in 2015) are residents at the mine, 86% in
of either Musina or Blouberg. In other words De Beers has 2015 were residents.
typically hired residents before non-residents, or has
created opportunities for employees to become resident in
either Musina or Blouberg. De Beers has typically
Data for locals (as opposed to resident) are incomplete but it is
hired area residents
estimated that about 58% of De Beers’ employees are locals. before non-residents.
17From 1992 to 2015
Venetia Mine paid
about R3,4 billion in
accumulated wages to
De Beers' employees.
188. INCOME GENERATION
8.1. AGGREGATE WAGES
The next measurement of contribution is the income that has
been paid into the local economy as wages over the life of the mine.
Wage data are available only from 2004, therefore a regression model was used to
determine the contribution before 2004. The assumptions used were conservative.
FIGURE 14 | THE TOTAL WAGE BILL AND TOTAL WAGES PAID
TO RESIDENTS HAVE CLOSELY ALIGNED OVER THE YEARS
600
Total wage bill
Modelled Actual
500 Resident wage bill
400
Accumulated wages
300
of R3,4 billion paid to
200
De Beers' employees
100 resident locally from
1992 to 2015.
1992 1994 1996 1998 2000 2002 2004 2006 2008 2010 2012 2014 2016
Sources: De Beers, 2016 | Genesis Analytics analysis, 2016
Assumptions: Linear relationship between time and number of employees | Constant 9% wage growth between 1992 and 2003.
A conservative estimate is that from 1992 to 2015 Venetia Mine paid about R3,4 billion in accumulated5 wages to
employees who were resident in Musina and Blouberg. As residents spend a large portion of wages in the local
economy, this amount is a fair proxy for income generation from wages in the local economies. Note this does not
include the wages paid to contracting staff over the period, nor does it include the benefits paid to employees in
addition to wages. If these were added it is likely that the accumulated wage bill would be more than R6bn from
1992 - 2015.
8.2. WAGE INCREASES FOR RESIDENTS
FIGURE 15 | AVERAGE GROWTH OF WAGES PER RESIDENT HAS BEEN ABOVE CPI
24 Aftermath of global
22 financial crisis
20
18 Growth rate of wages per
16 resident was 11% between
14 2006 and 2015 (CAGR)
%
12
10 Year-on-year wage increase
8
6
4
Average CPI over the
period was 6%
2
0
2006 2007 2008 2009 2010 2011 2012 2013 2014 2015
Sources: De Beers, 2016 | Genesis Analytics analysis
5 Aggregated nominal wages in each year.
19The data also show that from 2006 to 2015 the wage per resident
increased by 11% a year. This is almost double the average inflation
Residents have
rate over the same period (6%). Residents have enjoyed positive enjoyed positive
increases year on year in comparison to changes in the cost of living. increases year on
year in comparison
8.3. BENEFITS to inflation.
FIGURE 16 | TOTAL WAGES AND BENEFITS (2004 - 2015, NOMINAL RANDS)
In 2015
700 Total wages + benefits
R666.7m (All employees)
600
Total local wages + benefits
R574.9m (Resident employees)
500
R million
400
86%
300
200
100
2004 2005 2006 2007 2008 2009 2010 2011 2012 2013 2014 2015
Sources: De Beers, 2016 | Genesis Analytics analysis, 2016
Between 2004 and 2015, the mine paid an aggregated total of R4,1
billion in wages and benefits to De Beers' employees. Most of this Between 2004 and
was paid to residents. For instance, in 2015, the total amount paid to 2015, the mine paid
residents in wages and benefits amounted to R574 million, or 86%
of total wages and benefits. An aggregated total of R3,6 billion was an aggregated total of
paid to residents in wages and benefits between 2004 and 2015. R4,1 billion in wages
Between 2008 and 2009, the aggregate wage and benefits bill
and benefits to De
fell with retrenchments after the global financial crisis. Beers' employees.
8.4. AVERAGE PACKAGES IN CONTEXT
The majority of resident employees at the
Venetia Mine fall into the B-Band income group.
FIGURE 17 | THE MAJORITY OF RESIDENT EMPLOYEES AT
THE VENETIA MINE FALL INTO THE B-BAND INCOME GROUP
56% 34% 9% 1%
B - Band C - Band D - Band E - Band
Sources: De Beers, 2016 | Genesis Analytics analysis, 2016
Most resident
Typically, a ‘B-Bander’ will hold a matric qualification
employees are
and performs operational duties at the mine. B-Banders.
20FIGURE 18 | STRUCTURE OF A B-BAND EMPLOYEE’S PACKAGE,
AVERAGE 2015
R238 782
Annual average total income
R165 465 for B-Band employee
Annual wage
Annual average income for a B-Band
employee, with comparators (2015)*
R1 085 R4 964
Company Company R238 782
contribution: medical
water & contribution
electricity
R178 437
Total package
R42 637 R6 420 R71 578
Contops Housing R58 925
allowance allowance R40 039
R18 201
Company pension B-Bander National** Musina ***Mining Blouberg
contribution Package
Average annual household income
Sources: De Beers, 2016 | Genesis Analytics analysis, 2016 | Quarterly Employment statistics,
March 2016 Note: * Musina and Blouberg average income inflated to 2015 prices | **Includes
bonuses and overtime | ***Mining is an industry category which refers to the average income
earned by workers of all mining activities in South Africa.
In 2015, the average wage and benefits package for a B-Band employee was
R238,782. Benefits include a housing allowance, bonus, medical contribution,
contops6, and company contributions towards water
and electricity.
A B-Band employee earns in comparison more than 3 times the average
annual household income in Musina and almost six times than the average
annual household income in Blouberg. Venetia Mine B-Banders earned
A B-Band employee
more than three times of the average South African mine workers. earns more than
three times the
average annual
MUSINA MUSINA MUSINA
household income
in Musina and
almost six times
more than the
BLOUBERG BLOUBERG BLOUBERG BLOUBERG BLOUBERG BLOUBERG
average annual
household income
MINERS MINERS MINERS
in Blouberg.
6 Contops refers to Inconvenience Top-ups given to mine operation workers for working
during ‘inconvenience’ times during the day – also known as overtime.
219. HOUSING
De Beers has invested heavily in the construction
and development of staff housing in Musina.
To date, the mine has built 522 homes in Musina. This includes 90 homes
for contractors working on the construction of the VUP. In addition, the
mine rents 109 housing units in Musina for staff.
The mine has also established facilitated home ownership schemes in To date,
Blouberg and Musina. These assist employees to buy their own homes or to
upgrade properties. The first scheme was introduced in 1987 and assisted with
De Beers has
a subsidy and security collateral for deposits, as well as a housing allowance in built 522 homes
accordance with wage levels. The revised scheme caters primarily to employees
who do not have homes and earn R25 000 or less, thus falling into the gap
in Musina and
between RDP housing and bank-financed homes. To date 819 employees rents another
have been eligible for the scheme, and 39 have taken it up. 109.
FIGURE 19 | DE BEERS HOUSES MORE THAN 630 FAMILIES IN MUSINA
432 109 90
De Beers-owned De Beers-rented Homes built
houses built accommodation for VUP
Source: De Beers, 2016
2210. INFRASTRUCTURE
The mine has invested in infrastructure
projects in both Musina and Blouberg.
These include the construction and maintenance of primary
and secondary schools, sports facilities, electrification plants
and distribution networks; water infrastructure, and roads.
23FIGURE 20 | THE VENETIA MINE HAS INVESTED IN
PHYSICAL INFRASTRUCTURE IN MUSINA AND BLOUBERG R521
ROAD
WATER
SCHOOL SYSTEM
SCHOOL
SCHOOL
ECD
CENTRE GROOTPAN
VILLAGE BAKERY
ALLDAYS
SCHOOL TOWN
SIAS SCHOOL
VILLAGES TAAIBOSCHGROET
VILLAGE
SCHOOL JUNIORSLOOP
VILLAGE
EZORINGA
VILLAGE
BLOUBERG
SCHOOL
ELEC-
TRICITY
SCHOOL
SILWERMYN SENWABARNWANA
VILLAGE TOWN
ELEC-
TRICITY
AURORA
VILLAGE
24ROAD
522 WORKS
HOUSES
SCHOOL ELEC-
VENETIA TRICITY
MINE
SCHOOL
SCHOOL
SCHOOL SCHOOL
GYM
SCHOOL
MUSINA MALALE
TOWN SCHOOL NANCEFIELD VILLAGE
SCHOOL
TOWNSHIP
MUSINA SCHOOL
TSHIUNGANI
VILLAGE
TABLE 1 | INFRASTRUCTURE IN MUSINA AND BLOUBERG
TYPE NAME MUSINA BLOUBERG NAME OF VILLAGE/TOWN
School Makushu Primary School x Nancefield Township
School Renaissance High School x Nancefield Township
School Malale Primary School x Malale Village
School Lwaphungo Secondary School x Tshiungani Village
School St Martins De Porres Primary School x Nancefiled Township
School Eric Louw High School x Musina Town
School Messina Primary x Musina Town
School Shanduka Academy x Musina Town
School Musina High School x Nancefiled Township
Road Works Musina Roads Intersections x Musina Town
Housing 432 De Beers owned houses x Musina Town
90 VUP Built houses
109 De Beers rented houses
Gym x Musina Town
Electricity Replacement of Electrical Poles x Nancefiled Township
Road The R521 that goes from Musina to Alldays, x x
Musina Town and Alldays
with Venetia Mine in-between
School Ratanang Special School x Senwabarnwana Town
School Ratanang Crèche x Alldays Town
School Grootpan Crèche x Grootpan Village
School Mashie Primary School x Ezoringa Village (Next to Eldorado)
School Mmantshako Secondary School x Ezoringa Village (Next to Eldorado)
School Matshabe Primary School x Juniorsloop Village
School Alldays Combined School x Alldays Town
School Phala Secondary School x Senwabarnwana Town
ECD Centre Siaz Crèche x Siaz Villages
Electricity Electrification Project | Silvermyn x Silvermyn Village
Electricity Electrification Project | Aurora x Aurora Village
Water Systems Alldays Water Project x Alldays Town
Other Taaibosch Community Bakery x Taaiboschgroet Village
2511. INVESTMENT IN
EDUCATION, HEALTH,
SPORTS AND ARTS
The corporate social investment (CSI) initiatives of the
Venetia Mine are split between Musina and Blouberg.
The mines' CSI strategy is linked and aligned to the Integrated Development Plans (IDPs)
of the municipalities as well as the Social and Labour Plan.
1
THERE ARE FOUR SOURCES OF CSI FUNDING FOR INITIATIVES IN BLOUBERG OR MUSINA:
THE DE BEERS FUND:
Funding is for applications of R50,000 or more, which are adjudicated and decided upon
during the quarterly Board of Trustees meeting in Johannesburg. The focus is on sizable
community development projects like infrastructure.
2 VENETIA MINE LOCAL AREA COMMITTEE:
This committee receives requests for funding of projects of less than R50,000.
The focus is on smaller community projects.
3
VENETIA MINE SOCIAL AND LABOUR PLAN (SLP):
These projects are adopted from Musina and Blouberg is Integrated Development Plans
and included in the Venetia Mine SLP commitments, focusing on community, local economic,
and infrastructure development projects.
4
VENETIA MINE FUND:
This supports projects that do not qualify for funding from either the LAC or DBFund
but which are of strategic significance to the mine. The Venetia Mine OpCo team
manages the Venetia Mine Fund.
26FIGURE 21 | SINCE 2006 DE BEERS HAS SPENT A CUMULATIVE R144M ON EDUCATION,
HEALTH, SPORTS, ARTS AND COMMUNITY PROJECTS IN MUSINA AND BLOUBERG
R30M
R25M
R20M
Average CSI Spending
(R14M a year)
R15M
R9.929.220
MUSINA (56%)
R10M
R5M R144M
BLOUBERG R7.917.031
(44%)
2006 2007 2008 2009 2010 2011 2012 2013 2014 2015
Sources: De Beers, 2016 | Genesis Analytics analysis, 2016
In the years for which information is available - 2006 to 2015 - De Beers invested
R144 million on CSI initiatives in Blouberg and Musina. In ten years the mine The mine has
funded or donated to 200 projects7 in education, health and welfare, sports, arts, contributed an
culture and infrastructure development (especially building schools, roads, and
drilling boreholes). average of R14
million a year
The mine has invested an average R14 million a year in CSI. In 2015,
Musina received slightly more than Blouberg with 56% of total CSI spending.
in CSI.
FIGURE 22 | CSI DISTRIBUTION OF SPENDING HAS ALMOST TRIPLED SINCE 2006
R17 846 251
Total CSI Spending
R6 702 620
R15 531 012
Education R5 036 620
Health and R1 233 779
Welfare R700 000
CSI spending
Sports, Arts, R1 005 301
has almost tripled
Culture and
Heritage R596 000 since 2006.
Community R76 159
Development R370 000
2006 2015
Sources: De Beers, 2016 | Genesis Analytics analysis, 2016
7 Some projects have been funded more than once.
27Education accounts for about 85% of CSI spending. This
includes Early Childhood Development programmes, post-school
bursaries and learnerships, the construction of primary and
secondary schools, and educator subvention programmes.
A programme with the provincial department of education has
provided infrastructural support to 11 schools in the Musina
and Blouberg LMs areas, including construction of classrooms,
ablution facilities, administration blocks, and water provision.
This partnership has also successfully built boarding facilities
for children with special needs at Ratanang Special School in
Education accounts for
Senwabarwana, which is home to more than 300 children. 85% of CSI spending.
The mine introduced a teacher subvention programme in three
schools, namely Musina High School, Messina Primary School and
Eric Louw High School, providing funding for additional Mathematics
and Science teachers. The programme has supported 27 teachers,
with full salary subvention, and 50 students with fee subsidies. R6
million has been spent and the programme is scheduled to end
This investment in
in December 2017 with De Beers encouraging the Department of education has impacted
Basic Education to absorb the supported teachers permanently.
the schooling of more than
The investment in education has impacted the schooling of 3 000 learners in Musina
more than 3 000 learners in Musina and Blouberg LMs. and Blouberg.
HEALTH AND WELFARE
Health programmes have focused on HIV/AIDS awareness,
prevention and treatment initiatives. Programmes such as Soul City
Venetia, which supports home-based care and primary health care
training and Field Band Foundation, an HIV lifestyle programme
that uses music to promote positive and healthy lifestyles, are two
programmes that have received funding. On the mine site, De Beers
provides medical care facility that is free of charge to all employees.
SPORTS, ARTS, CULTURE AND HERITAGE
The mine provides kit, equipment and trophies for soccer
tournaments. The mine was also instrumental in ensuring that the
community of Blouberg partook in the festivities of the 2010 World
Cup hosted in South Africa, by sponsoring the public viewing area
in the community. The mine supports the Field Band Project both
in Musina and Blouberg LMs with uniforms and equipment.
OTHER PROJECTS
ELECTRIFICATION
The mine has assisted with bulk electrification in Blouberg and
Musina. In 2009, the mine completed a project that connected
five villages and 337 households in Blouberg to the national grid.
This project created 100 jobs during the construction phase.
In Musina LM an electrical reticulation network was installed in
the township of Nancefield (Extensions 9 and 10) which resulted
in a further 600 households being connected to the grid.
28SAFETY AND SECURITY
Venetia Mine sponsors various South Africa Police Services-related activities;
including trophies and medals for the SAPS Award Ceremony, the provincial
SAPS Choir as well as the Captain Crime Stop Campaign which educates
children on crime prevention measures.
SKILLS DEVELOPMENT
Since the early 2000s, employee volunteers have worked with school
governing bodies and teachers to improve school governance and
management skills. This has seen staff members maintain long
relationships with schools.
The mine has also funded projects such as the Otshepegile Sewing Project
where sewing skills are taught with the goal of creating employment. The
mine has supported this initiative through the provision of sewing
machines and materials.
The mine is also working with its main contractors through the Contractors
Forum to encourage and align CSI support in development projects.
2912. TRAINING AND
SKILLS DEVELOPMENT
Venetia Mine offers training to all employees and has also extended
training to non-employee members of the community. More than
4,000 beneficiaries received training in 2015.
Training ranges from basic operational training for B-Banders to more
in-depth training and leadership development training for C-Banders,
to more senior management training for D-Banders.
TABLE 2: TYPES OF TRAINING PER EMPLOYMENT BAND
EMPLOYMENT BAND TRAINING TYPE EXAMPLES
B-BAND • Occupational Health and Safety • Safety Risk Management A1
• First Level Safety Risk Management • Fire Extinguisher Training
• Overhead Crane Operation
• Working at Heights
C-BAND • Skills Programmes • Safety Risk Management A2
• Occupational Health and Safety • Supervisory Learnership Programme
• Second Level Safety Risk Management • Introduction to Asset Management
• Leadership Development
D-BAND • Leadership Development • Safety Risk Management A3
• Root Cause Analysis Training
• Mine Health and Safety Act Training
Source: De Beers, 2016
Spending on training has increased annually from 2010 (first available records).
10% of spending is on standard safety training and 10% on standard machine 60% of training
operating, 60% is investment in skills that are transferable outside the mine, is transferable
for instance, artisanal skills. These skills are not only relevant on the mine;
they can be taken into other occupations and career paths. The other 20% outside the mine.
of spending was on management development.
FIGURE 23 | SKILLS DEVELOPMENT SPENDING AT THE VENETIA MINE (2010 – 2015)
(Nominal) R30 881 297
R27 649 911
Technical Training:
e.g. learnerships and
R24 051 946 60%
artisan training (skills
can be transferred)
R17 367 113
R13 966 178 R14 997 304
Over the period,
employees took
part in 605
2010 2011 2012 2013 2014 2015
different skills
Sources: De Beers, 2016 | Genesis Analytics analysis, 2016. The breakdown of spending
development
on each training type is a rough estimate based on a consultation with Mr Koos Nel. programmes.
30Most of the training at the mine is for residents of Musina and
Blouberg. In 2015, 80% of training beneficiaries were residents of
80% of all training
Musina and Blouberg. A rough ratio suggests that 58% (607) of total beneficiaries were
trainees were locals. 15% of the training beneficiaries were women. residents.
FIGURE 24 | RESIDENT EMPLOYEES HAVE BEEN THE
GREATEST BENEFICIARIES OF TRAINING SPENDING
Non-residents 1273 1307
Residents
1045 191 261
849 832
168
746
706
666 620 147 108
146 438 90
388 305
66
408 401 520 372 530 702 724 877 1082 1045
2006 2007 2008 2009 2010 2011 2012 2013 2014 2015
Sources: De Beers, 2016 | Genesis Analytics analysis, 2016
Dedicated training programmes have allowed
talented employees to climb through the ranks.
CASE STUDY
Albert Munungu Fnala was born in the township of Nancefield, Musina.
Previously a petrol attendant, Albert joined Venetia Mine in 2004 as a
mine truck operator. After three years he was trained further on how to
operate a second machine. Albert was so proficient with the machinery
that in 2010 he was appointed as a trainer of others. In 2013 he was
promoted to senior mining training officer, a position he still holds.
He hopes to become the training technical manager within a few years.
His progress has assisted Albert and his family to improve their quality
of life. Upon joining De Beers in 2004, he was living in a four-roomed
house, but now owns an eleven-roomed house and three cars. The
boarding school assistance has helped his children through one of the
top schools in Limpopo.
Albert believes that the mine’s biggest impact has been through
employment, particularly the employment of young people.
3113. FISCAL
CONTRIBUTION The mine has
paid R88 million in
The mine makes payments of rates and municipal contributions
taxes, and water and electricity to Musina.8 since 2007.
Municipal payments support the service delivery mandate of the local municipality.
The mine has paid R88 million in municipal contributions since 2007. R15.4 million was paid in 2015.
FIGURE 25 | THE VENETIA MINE CONTRIBUTES TO MUSINA FISCUS
(NOMINAL RANDS: 2007 - 2015)
R15,4M
R13,7M
R10,6M
R9,4M R10M
R8,5M
R7,9M
R6,6M R6,5M
2007 2008 2009 2010 2011 2012 2013 2014 2015
Sources: De Beers, 2015
8 These payments in respect of are from mine-owned properties in Musina. No payments are made from the mine operations
for water and electricity, as water is pumped directly from the Limpopo River and electricity comes directly from Eskom.
3214. LOCAL PROCUREMENT
In accordance with transformation of the mining industry, the mine has oriented procurement
towards black-owned business. In 2004, only 19% of mine procurement came from BEE entities;
by 2015 this had increased to 85%.
FIGURE 26 | THERE HAS BEEN AN INCREASE IN BEE
PROCUREMENT SPENDING SINCE 2004 (PERIOD: 2004 - 2015)
% of non BEE Entities % of BEE Entities
14% 2015 85%
13% 2014 86% In 2004, only
21% 2013 79% 19% of mine
27% 2012 73% procurement
8%
33%
2011
2010
92%
67%
came from
41% 2009 59%
BEE entities;
43% 2008 57% by 2015
58% 2007 42% this had
58% 2006 42%
increased
73% 27%
82%
2005
2004 19%
to 85%.
Sources: De Beers, 2016 | Genesis Analytics analysis, 2016 Note: BEE Entities – Entities with HDSA Ownership of greater than 25% +1
vote. This includes HDSA Empowered entities (25% +1 vote) and HDSA Owned entities (50% +1 vote), as confirmed by Mr Pieter Killian.
Total procurement spending for Venetia Mine operations in 2015 was R3.8 billion of this only 3,39% or R137
million came from companies operating in Musina, with a tiny portion coming from Blouberg LM. This reflects
that the larger commercial centre is the Musina LM. The opportunities for local procurement based on existing
businesses are for kitchen consumables; stationery; pool maintenance; lubricants and fuel; courier services;
employee transport; facilities management; electrical; and tyres and batteries.
Of the R137 million spend in procurement in the two local areas, over R130 millions of that was spent in the
services sector.
FIGURE 27 | THE VENETIA MINE PROCUREMENT FROM MUSINA Only 3.39% of
AND BLOUBERG AS PROPORTION OF TOTAL PROCUREMENT (2015)
procurement is
Musina &
R3,8bn
R130 million in total from Musina
3,39%
Blouberg procurement spending in and Blouberg.
Musina and Blouberg was
in the services sector. R130,2M
R3,8bn
Other 96,61%
R5,1M
R1,8M
Capital Consumables Services
2015
Sources: De Beers, 2016 | Genesis Analytics analysis, 2016
3315. LOCAL ENTERPRISE
DEVELOPMENT
Local enterprise development is driven by De Beers Zimele,
a community enterprise development program established
in 2006 jointly by De Beers and Anglo Zimele.9
Anglo Zimele is Anglo American’s enterprise development initiative,
established in 1989 to provide loan and equity financing to black
entrepreneurs and businesses.
The word “Zimele” is derived from Zulu and Xhosa and means
“to be independent” or “to stand on one’s own feet”.
The objectives of De Beers Zimele are to nurture commercially viable
businesses to bring about black economic empowerment through the
creation of sustainable small and medium sized enterprises. The programme “Zimele” is
provides access to capital, business advisory and planning services, links to derived from
established supply chains and markets (the mine and other industries), and
mentorship. The De Beers Zimele hub at Venetia was established in 2011.
Zulu and Xhosa
and means “to be
Loans from R1, 000 to R1 million are given at a standard low interest rate
(6%) to all businesses. Between 2011 and 2015, the Venetia hub supported
independent” or
47 small businesses in Musina and Blouberg with a total investment of “to stand on one’s
R11, 8 million in debt financing. Together, these companies accounted own feet”.
for 648 jobs in Limpopo.
FIGURE 28 | ZIMELE FUND HAS INVESTED IN LOCAL SMES
Zimele Fund Venetia Mine loan value (R millions, 2011 - 2015); Loans per sector (R thousands, 2011 - 2015)
Zimele has provided loans to the value
Total + R11,8M of R11, 8 million and through these,
4 helped support the creation of 648 jobs
R3,7M
in Limpopo since 2011.
3,5
3
2,5 R2,6M R3,1M R3M
R2,4M R2,8M
2 R2,1M
1,5
1 R1M
R1,0M R0,9M R0,8M
0,5
0
2011 2012 2013 2014 2015 Services Agriculture Construction Transport Retail Manufacturing
Total loans (low interest %)Total Loans per annum
Sources: De Beers, 2016 | Genesis Analytics analysis, 2016
9 Prior to Zimele, De Beers had an initiative called Matlafalang .
34You can also read