Debt Collection in Philadelphia - Policy Brief - Reinvestment Fund
←
→
Page content transcription
If your browser does not render page correctly, please read the page content below
Policy Brief
Debt Collection in Philadelphia

Prepared by REINVESTMENT FUND
Published MARCH 2021

                                RESEARCH CONDUCTED BY

                                Policy Solutions at Reinvestment Fund

                                Emily Dowdall, Policy Director
                                Jacob Rosch, Senior Policy Analyst
                                Janine Simmons, Policy Analyst
                                Michelle Schmitt, Senior Policy Analyst
                                Mallory Rappaport, Field Placement Intern

                                COMMISSIONED BY Community Legal Services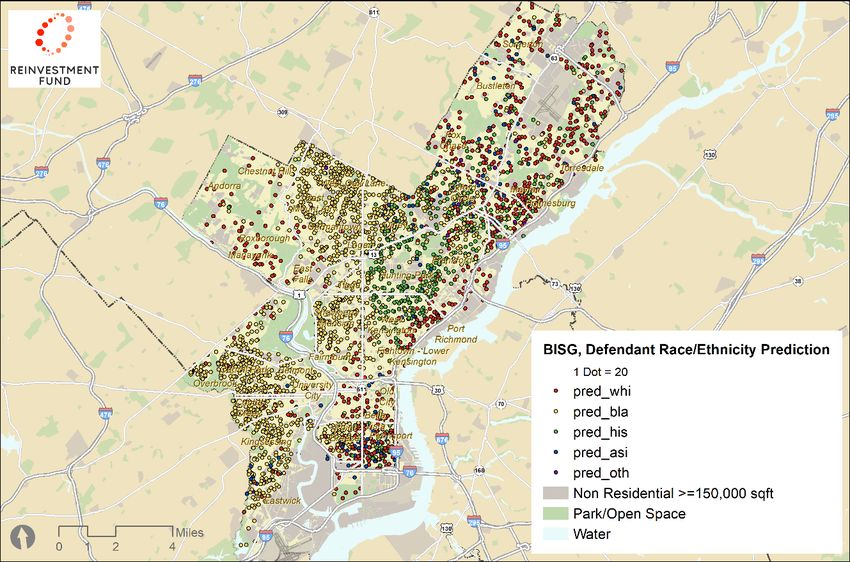
Debt Collection in Philadelphia
This memo presents the results of Reinvestment Fund’s analysis of Philadelphia Municipal Court records
for cases that were filed between January 2016 and April 2020. In total, 90,809 case records were
obtained for analysis.

The document is organized into nine sections:

   1. High-Level Observations and Takeaways.

   2. Characteristics of Defendants and Plaintiffs. Describes the estimated racial and ethnic
      composition of defendants and most common plaintiffs.

   3. Understanding Case Outcomes. Summarizes the most common outcomes of debt collection
      cases.

   4. Average Claims in Debt Collection Cases. Analyzes the size of claims entered on Philadelphia
      cases.

   5. Defendant Representation. Describes trends in defendant representation among debt
      collection cases.

   6. Judgment Awards to Plaintiffs. Summarizes the amount and types of judgments obtained by
      plaintiffs against defendants.

   7. Case Outcomes and Property Ownership. Analyzes the relationships between property
      ownership and case outcomes.

   8. Defendant Stories. This section includes findings from a series of interviews conducted with
      defendants involved in debt collection cases.

   9. Methodology and Data. Summarizes the dataset and methods used to construct this analysis.

                                                                                                     1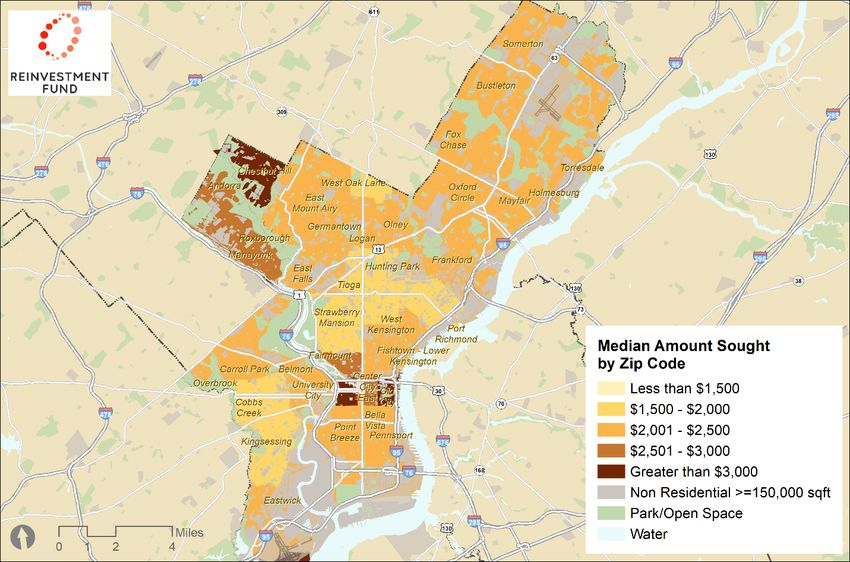
Key Findings

   •   Black Philadelphians are overrepresented among defendants in debt collection cases. Nearly
       half (49%) of cases involved Black defendants, while 41% of Philadelphia households identified
       as Black.

   •   Representation improves outcomes for all defendants and appears to have a mitigating effect
       for observed racial disparities. In areas where we found what appears to be worse outcomes
       for Black and Hispanic defendants over all (e.g., awards for judgment on the merits cases, rates
       of judgments by agreements vs settlements) legal representation acts as an equalizer, reducing
       racial disparities in outcomes. Rates of defendant representation were roughly equivalent across
       different racial and ethnic groups, particularly after controlling for the claim amount – but Black
       defendants were least likely to have an attorney.

   •   Disparities in rates of default judgments between Black and White defendants and our
       interviews raise questions about service for defendants of color. It is not clear why Black and
       Hispanic defendants would have the highest rates of service, but also the lowest rates of
       appearing for court dates. In interviews, three of the five respondents reported being unaware
       of the court cases against them, despite court records that indicated they had been served and
       two said they had not been living at the address listed in the court documents at the time that
       service was allegedly made.

   •   Debt cases in Philadelphia’s court system are disproportionately filed by a small handful of
       plaintiffs. Over half of the 59,618 cases analyzed in this paper were filed by just four plaintiffs. In
       total, the top 10 plaintiffs filed 84% of all cases in the analysis – most of these are entities that
       purchase delinquent debts, and a few are banks.

   •   Black and Hispanic defendants were involved in cases with lower claim amounts, on average,
       than defendants of other races. Although defendant incomes were not available for this
       analysis, income data for areas where these claims are concentrated and for different races
       /ethnicities in the city indicated that these cases with lower claim amounts may represent
       equal or greater financial strain on Black and Hispanic defendants. Judgments represented
       over 10% of the median household’s annual income in zip codes that include neighborhoods
       with some of Philadelphia’s highest concentrations of lower-income Black residents: Mantua,
       Strawberry Mansion, and Nicetown-Tioga. Claim amounts against Black and Hispanic defendants
       represented a larger share of the typical income of a Black or Hispanic household in
       Philadelphia. For example, the average claim amount in a case involving Black defendants
       represented 8% of the median income of a Black Philadelphia household. The average claim
       amount in a case involving White defendants represented only 5% of the median income of a
       White Philadelphia household.

   •   Working with debt consolidation companies did not keep defendants out of court. Three
       interview respondents worked with debt consolidation companies to simplify and reduce their
       debt. For one respondent, the payment agreement she made with the debt consolidation

                                                                                                            2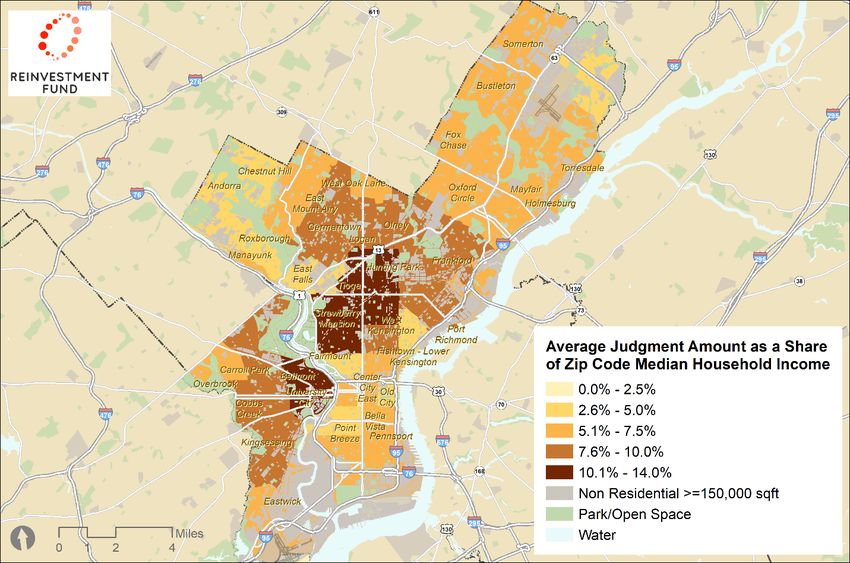
company was too high, and she eventually stopped paying it, resulting in her case. Another
    respondent reported the lawyer from his debt consolidation company did not attend his court
    date, resulting in a judgment for plaintiff by default. A third worked with a debt consolidation
    company, but still ended up with two debt cases against her.

•   Property ownership: We estimate that close to half of debt collection defendants lived in
    properties they or a family member owned. Four interviewees reported owning property in
    Philadelphia. In general, defendants identified as property owners had similar case outcomes as
    those who did not appear to own property in Philadelphia. No respondents were aware of any
    liens on their homes due to their debt cases. One respondent reported he planned to pay his
    debt by taking out a home equity loan. Another respondent wanted to buy a home, but her
    damaged credit score made it difficult to secure a mortgage.

                                                                                                       3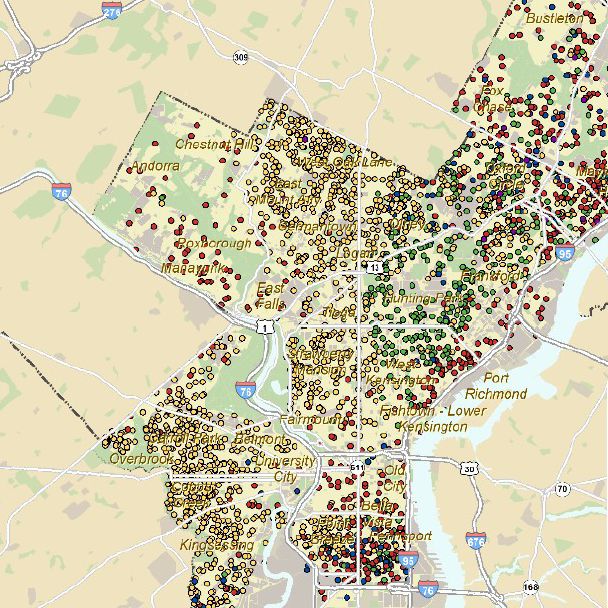
Characteristics of Defendants and Plaintiffs
This section summarizes the characteristics of defendants and plaintiffs in debt collection cases.

Characteristics of Defendants
As noted above, this analysis relied on Bayesian Improved Surname Geocoding (BISG) to estimate and
analyze the likely race of defendants involved in the cases analyzed in this report. The BISG analysis uses
defendant surnames and defendant home addresses to estimate the likely race/ethnicity of each
defendant in our sample. The figure below shows the expected number of cases in the sample that
involved Black, White, Hispanic, and Asian defendants. 1

Compared with the makeup of households in Philadelphia, Black defendants were over-represented in
our sample and White defendants were under-represented. While we estimate that nearly half (49%) of
cases involved Black defendants, only 41% of Philadelphia households are Black. Similarly, we estimated
that only 27% of cases involve White defendants, while 34% of Philadelphia households are White.

Estimated Racial Distribution of Debt Collection Defendants

                                            Hispanic,
                                              15%                Asian, 6%

                                                                    Other, 3%
                Black,
                 49%
                                               White,
                                                27%

Black residents were over-represented in debt collection cases overall, but also within specific
neighborhoods in the city. The map below identifies census tracts in the city where Black defendants are
over-represented relative to the number of Black households in the same census tract. Black defendants
were over-represented in some parts of the city that have long been predominantly Black and have
more recently gentrified, such as Point Breeze, Graduate Hospital, and Kingsessing, as well as in
neighborhoods that are predominantly White, such as Fairmount, Callowhill, and West Mount Airy.

1Throughout this analysis racial and ethnic categories were defined to be mutually exclusive. White, Black, and Asian racial groups refer to non-
Hispanic White, non-Hispanic, Black, and non-Hispanic Asian individuals.

                                                                                                                                               4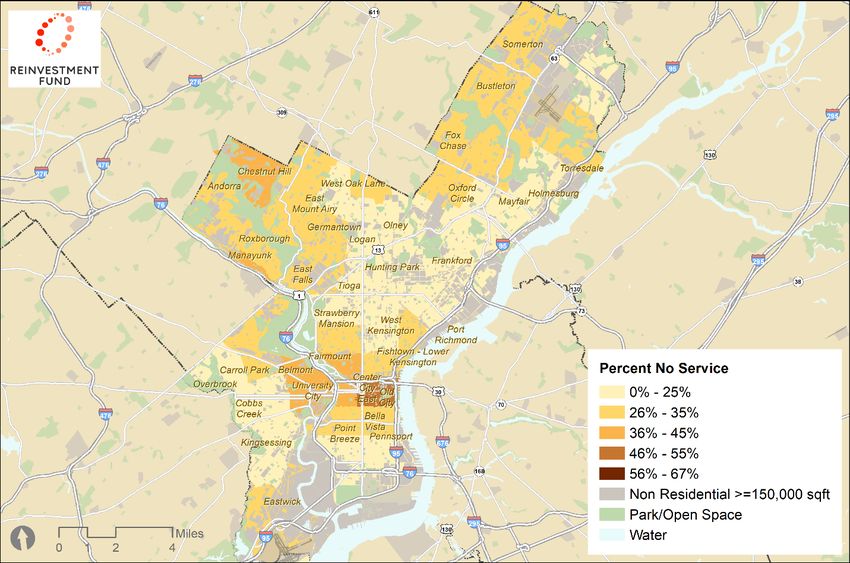
Over-Representation of Black Defendants in Debt Collection Cases

Financial Resiliency in Philadelphia: Housing Cost Burden
Housing cost burdens are one commonly used indicator of a household’s financial resiliency – the ability
to weather ups and downs in income or emergency expenses. Generally, households that spend over
30% of their monthly income on housing costs are considered cost burdened and may have greater
difficulty paying all of their bills. Areas in the city where a greater share of households were cost
burdened had a greater number of debt collection filings. While 66% of Philadelphia households live in
census tracts where over 35% of households are cost-burdened, 72% of debt collection defendants live
in these census tracts.

                                                                                                       5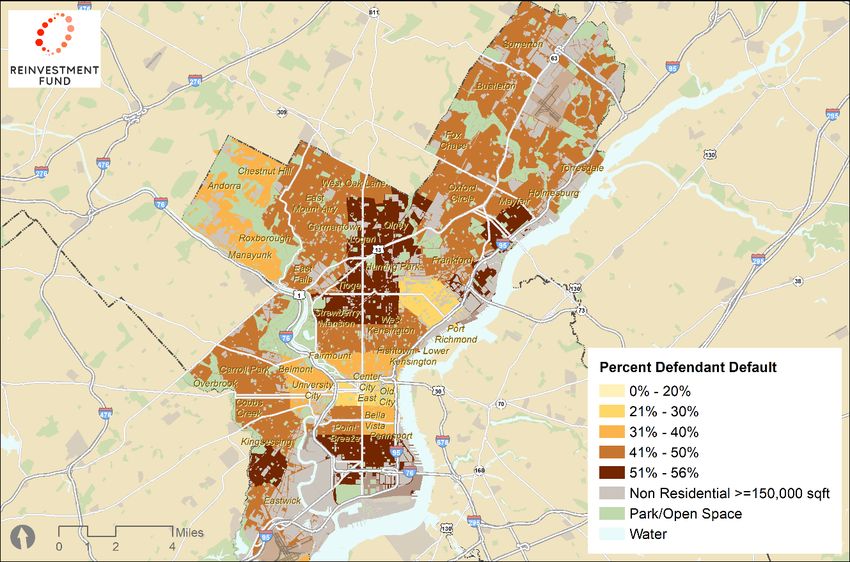
Share of Philadelphia Households and Debt Collection Defendants, by Housing Cost Burden of Census
Tract of Residence
                                                          38%
            34%                                   34%                                          34%
                                                                                    32%

                        28%

       Below 35% of Households              35% to 42% of Households           Above 42% of Households
            Cost Burdened                        Cost Burdened                     Cost Burdened

                  Share of All Philadelphia Households     Share of all Debt Collection Defendants

Characteristics of Plaintiffs
In more than half of cases the plaintiffs were debt collection entities that purchase and pursue
delinquent accounts, and the next most common types of filers were banks and credit unions, which
may have been the initial debt providers issuing a credit card or making a loan. A small number of
defendants were responsible for filing the vast majority of cases. There were 578 unique plaintiffs in our
sample but 58% of cases were filed by just four plaintiffs. In total, the top 10 plaintiffs filed 84% of all
59,618 cases in the analysis.

Top 10 Largest Filers of Philadelphia Debt Collection Cases
 Plaintiff Name                        Cases Filed      Share of All Cases
 Midland Funding                         15,489               26%
 Portfolio Recovery Associates            7,915               13%
 LVNV Funding                             5,630                9%
 Capital One Bank (USA)                   5,580                9%
 Cavalry SPV I                            4,624                8%
 Discover Bank                            4,281                7%
 Philadelphia Federal Credit Union        2,266                4%
 TD Bank                                  1,971                3%
 Barclays Bank Delaware                   1,835                3%
 Synchrony Bank                            746                 1%
 All other Plaintiffs                     9,281               16%

                                                                                                           6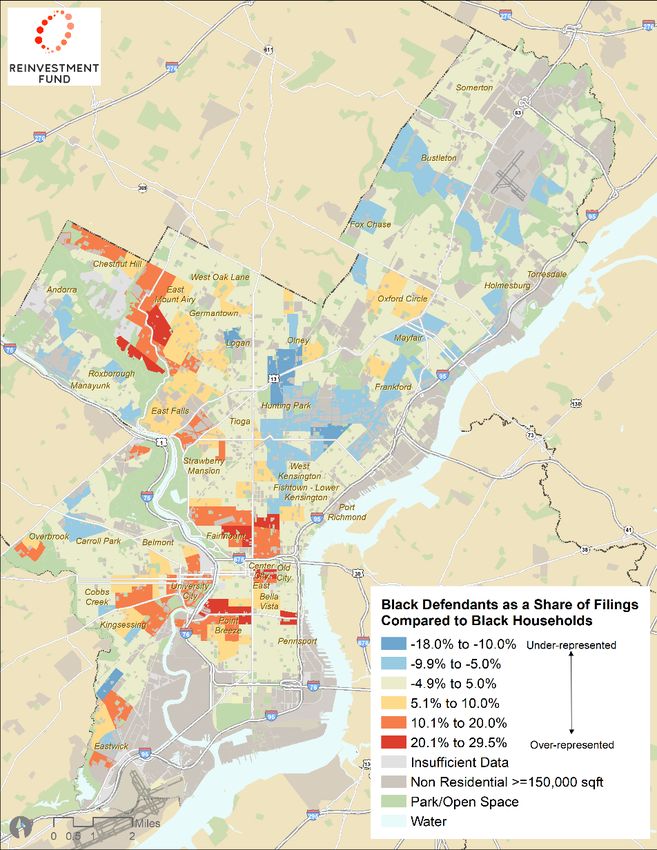
Understanding Case Outcomes
Throughout the analysis we focus on cases that proceeded to court after the plaintiff asserted that
service was made to defendant(s). Just over a quarter of all filings (26%) end with a determination of “no
service” as the final docket entry. Cases with Black defendants were slightly less likely to end due to no
service (25% compared to 27% for cases involving White defendants). Attorneys familiar with debt
collection cases report that many no-service cases are refiled until service can be made.

The figure below shows the share of filed cases where a determination of no service was made to
defendants in each Philadelphia zip code. The largest concentration of cases with no service was in
Washington Square West and Olde City. These areas happen to be among the densest in the city, with
high-rise apartment buildings, many of them luxury, that may make it difficult to reach defendants.

Share of Cases with Determination of No Service by Zip Code

The most common outcome for cases in which the plaintiff asserts successful service was a judgment for
the plaintiff by default (65%). In these cases, the defendant or their representative did not appear in
court. The least common outcome, in only 1% of cases, was a judgment for the plaintiff based on merits.

Altogether, approximately 15% of cases concluded without a money judgment against the defendant.
Most of these cases were withdrawals (12%) while just 3% of all cases ended with a judgment for the
defendant (2% on merit, 1% by default) or were transferred to bankruptcy court (0.01%). It is possible
that some number of withdrawn cases were refiled.

The remaining cases ended with a payment and terms reached through a judgment by agreement (JBA),
which is entered into the court docket (13%), or a settlement between the plaintiff and defendant (6%).

                                                                                                         7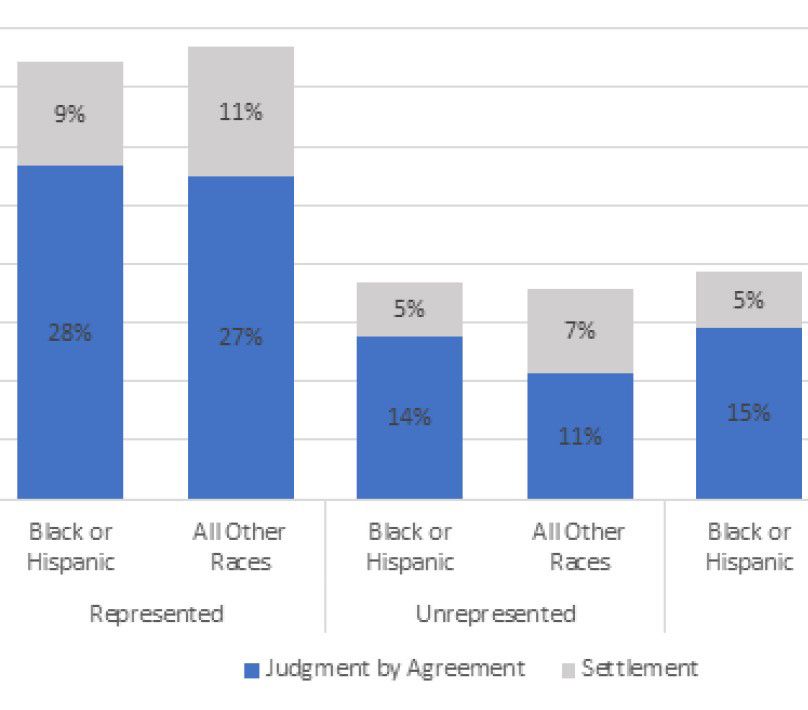
Outcome of Philadelphia Debt Collection Cases (excluding cases concluded for no service)
                   Withdrawn/Bankruptcy;               Judgment for
                           12%                         Defendant (on
                                                        Merit); 2%

                                                                  Judgment for
                                               JBA; 13%           Defendant (by
                                                                   Default); 1%
                        Judgment for
                         Plaintiff (by
                        Default); 65%                     Settlement; 6%

                                                      Judgment for
                                                       Plaintiff (on
                                                       Merit); 1%

Although default judgments were the most common outcome across all defendants, cases involving
Black defendants were somewhat more likely to end in a default—66% compared with 64% of cases
with a White defendant.

Overall, cases with Black and Hispanic defendants were more likely to result in a JBA (15% compared to
12% of cases involving other defendants). But when Black and Hispanic defendants were represented by
an attorney, they entered JBAs at nearly the same rate as other defendants, but they were still slightly
less likely to achieve a settlement. Attorneys familiar with debt collection cases note that settlements
may be more favorable to defendants both in their terms and their impact on defendants’ credit.

Cases Ending in a Formal Payment Agreement: JBA or Settlements

                                                                                                       8
Average Claims in Debt Collection Cases
The size of claims ranged from a low of $100 to a high of $19,441. 2 Almost half of cases (49%) involved
claims between $751 and $2,500 with a median of $2,052 claimed across all cases.
The map below shows the total amount sought across all cases between January 2016 and April 2020, in
each zip code in the city. The total amount claimed in debt collection cases was most concentrated in zip
codes in the Lower Northeast, West Philadelphia, and South Philadelphia.
Total Amount Claimed
2Claims are limited to $12,000, but 14 cases had a recorded amount sought above the limit; it was not clear from the court records whether
these were the result of data entry errors or a different cause.
9Zip codes with higher incomes tended to have higher median claim amounts. See below.
Cases with the most money at stake were also the most likely to end without a court ordered payment
to the plaintiff; among cases with a claim amount over $4,500, nearly 18% ended in a withdrawal,
judgment for defendant, or bankruptcy compared with only 10% of claims for less than $1,000. This
relationship remains even after controlling for different rates of defendant representation.
Share of Cases Ending in Withdrawal, Judgment for Defendant, or Bankruptcy by Claim Amount
17.8% 17.9%
15.1%
13.1%
9.7%
Under $1,000 $1,001 to $1,500 $1,501 to $2,500 $2,501 to $4,500 Over $4,501
(n = 7,574) (n = 8,047) (n = 10,183) (n = 9,341) (n = 8,419)
10Cases involving Black and Hispanic defendants involved lower amounts, on average, than cases with
White and Asian defendants. (See figure below).
The plaintiffs that filed the most cases were more likely to sue for lower amounts than other plaintiffs.
The three most frequent plaintiffs sued for an average of $2,051 compared with $4,117 among all other
plaintiffs.
Average Amount Claimed in Each Case’s Statement of Claim, by Race and Top Plaintiffs
$4,117
$3,143 $3,264
$2,985
$2,822 $2,773
$2,051
White Black Hispanic Asian Other Top 3 All other
(n = 11,535) (n = 21,529) (n = 6,780) (n = 2,558) (n = 1,161) Plaintiffs Plaintiffs
Defendant Representation
The overwhelming majority of defendants were not represented by an attorney at any point during their
case (94%). Representation was more common in cases involving the largest amounts of money; 8.5% of
cases with a claim amount over $4,500 had defendants with representation, compared with less than
3% of cases with less than $1,000 at stake. Rates of defendant representation were roughly equivalent
across different racial and ethnic groups, particularly after controlling for the claim amount – but Black
defendants were least likely to have an attorney.
Share of Defendants with Representation by Claim Amount and Predicted Race of Defendants
White Black Hispanic Asian Other All
Defendants Defendants Defendants Defendants Defendants Defendants
Under $1,000 3.1% 2.7% 2.3% 2.2% 2.8% 2.7%
$1,001 to $1,500 5.0% 5.7% 5.3% 4.5% 6.0% 5.4%
1,501 to $2,500 5.4% 5.4% 5.2% 5.6% 5.9% 5.4%
$2,501 to $4,500 7.0% 7.1% 6.4% 5.5% 7.1% 6.8%
Over $4,501 8.9% 7.3% 10.5% 10.7% 8.4% 8.5%
All Cases 6.1% 5.6% 5.9% 6.2% 6.1% 5.8%
Representation was strongly associated with more favorable outcomes for defendants. For example,
31% of cases where the defendant had representation ended in a judgment for the defendant (by
plaintiff default or on the merits), compared with only 1% of cases where the defendant did not have
11representation. In general, cases where defendants had representation were more likely to result in
withdrawal, judgment for defendant, or bankruptcy—all outcomes that do not involve a court mandated
payment to the plaintiff.
Defendants with representation were more likely to achieve a JBA or settlement. Nearly 70% of cases
where the defendant did not have representation ended in a default judgment compared with only 14%
of cases where defendants had representation.
Distribution of Case Outcomes with and without Defendant Representation
Cases with Representation Cases without Representation
(n = 2,540 cases) (n = 41,024 cases)
Withdrawal/Bankruptcy 21% 12%
Judgment for Defendant 31% 1%
Judgment for Plaintiff by Default 9% 69%
Judgment for Plaintiff on Merit 4% 0%
Judgment by Agreement 25% 13%
Settlement 9% 5%
Total 100% 100%
Judgment Awards to Plaintiffs
In most cases, the ultimate disposition obligated the defendant to make a payment to the plaintiff
through a judgment or settlement. However, the total award was missing from nearly half of all JBAs
and nearly all settlements in our dataset.
This section analyzes the outcomes among those cases where award information was available. Since
settlement terms are typically not docketed, and only 15 of the 2,458 cases that resulted in a settlement
had data, settlement cases are excluded from this analysis (see Appendix I for more information about
missing data).
The table below shows the number of cases with award data, the average amount at issue in each case,
and the average award in each case.
On average, defendants were required to pay 2% more than the amount they were sued for, likely due
to the addition of court costs and fees. Paradoxically, cases that went before a judge and were decided
for the plaintiff (i.e., judgment for plaintiff on merit) were the most favorable for defendants, with
defendants on average paying 15% less than they were sued for. JBA cases also yielded reduced award
amounts, on average, 2% less than the original claim. These patterns held across race/ethnic groups. 3
3 See Appendix II for claim and award amounts by case outcome by race / ethnicity
12Average Amounts Claimed and Awarded by Case Outcome
Average Average Dollar Percent
Total Cases
Claimed Awarded Difference Difference
Judgment for Plaintiff
28,444 $2,839 $2,936 +$97 +3%
by Default
Judgment by Agreement
3,779 $2,918 $2,848 -$70 -2%
(with Award Data)
Judgment for Plaintiff
294 $4,701 $3,997 -$704 -15%
on the Merits
All Cases with Award
32,517 $2,865 $2,935 +$70 +2%
Data
Representation and Case Outcomes
Defendants with representation fared better in total judgment amount, owing an average of 7% less
than they were originally sued for, while defendants without representation were required to pay 3%
more than they were sued for. Awards against represented defendants were lower relative to claim
amount across all case outcomes.
Average Amounts Claimed and Awarded by Case Outcome and Defendant Representation
Cases With Representation Cases Without Representation
Claim Total Percent Claim Total Percent
Amount Award Difference Amount Award Difference
Judgment for Plaintiff
$4,090 $4,152 +2% $2,829 $2,926 +3%
by Default
Judgment by Agreement
$3,859 $3,588 -7% $2,818 $2,769 -2%
(with Award Data)
Judgment for Plaintiff
$4,558 $3,586 -21% $4,789 $4,251 -11%
on the Merits
All Cases with
$4,045 $3,772 -7% $2,839 $2,917 +3%
Award Data
Racialized Differences in Case Outcomes
Representation appeared to eliminate racial disparities in the average outcomes of judgments for
plaintiff on the merits. Among cases decided as judgments for plaintiff on the merits and where the
defendant was not represented by an attorney, cases with White defendants had substantially more
favorable outcomes than cases decided for any other race. White defendants were required to pay 18%
less than the claim amount, while non-White defendants were required to pay 9% less. As an
illustration, if a typical case over $2,500 were decided for the plaintiff in front of a judge, we would
expect the average unrepresented non-White defendant to pay $2,275 and the average unrepresented
White defendant to pay $2,050, a difference of $250.
13Average Amounts Claimed and Awarded Among Judgments for the Plaintiff on the Merits, by Race
and Representation of Defendants
Cases With Representation Cases Without Representation
Claim Total Percent Claim Total Percent
Amount Award Difference Amount Award Difference
White $4,896 $3,805 -22% $4,845 $3,987 -18%
Non-White $4,492 $3,432 -24% $4,771 $4,335 -9%
All Cases $4,624 $3,554 -23% $4,789 $4,251 -11%
A more detailed analysis shows that representation led to more favorable outcomes for all cases case
outcome types and race / ethnicity groups, but the size of that impact varied across those categories.
Having an attorney had a greater positive impact for Asian and Hispanic defendants than for Black
defendants in judgments for the plaintiff by merit.
Average Amounts Claimed and Awarded by Case Outcome, Defendant Representation, and Predicted
Race of Defendants
Cases With Representation Cases Without Representation
Race Average Average Percent Average Average Percent
Ethnicity Claimed Awarded Difference Claimed Awarded Difference
Asian $4,613 $4,655 +1% $3,213 $3,318 +3%
Black $3,520 $3,601 +2% $2,727 $2,822 +3%
Judgment for Hispanic $4,625 $4,628 +0% $2,682 $2,781 +4%
Plaintiff by
Other $3,911 $3,976 +2% $2,868 $2,965 +3%
Default
White $4,464 $4,533 +2% $3,023 $3,125 +3%
Total $4,090 $4,152 +2% $2,829 $2,926 +3%
Asian $4,564 $4,360 -4% $2,907 $2,857 -2%
Black $3,633 $3,367 -7% $2,752 $2,717 -1%
Judgment by Hispanic $3,696 $3,455 -7% $2,715 $2,661 -2%
Agreement Other $3,759 $3,472 -8% $2,891 $2,844 -2%
White $4,273 $3,951 -8% $3,075 $2,988 -3%
Total $3,859 $3,588 -7% $2,818 $2,769 -2%
Asian $5,922 $3,381 -43% $4,209 $3,809 -10%
Black $4,099 $3,427 -16% $4,887 $4,483 -8%
Judgment for Hispanic $4,474 $3,566 -20% $4,712 $4,202 -11%
Plaintiff by
Other $5,198 $3,893 -25% $4,924 $4,375 -11%
Merit
White $4,892 $3,808 -22% $4,845 $3,987 -18%
Total $4,558 $3,586 -21% $4,789 $4,251 -11%
Asian $4,755 $4,341 -9% $3,193 $3,279 +3%
Black $3,667 $3,445 -6% $2,741 $2,818 +3%
All Cases with Hispanic $4,094 $3,824 -7% $2,700 $2,777 +3%
Award Data Other $4,046 $3,707 -8% $2,882 $2,960 +3%
White $4,464 $4,147 -7% $3,038 $3,119 +3%
Total $4,045 $3,772 -7% $2,839 $2,917 +3%
14Although court records do not include defendant incomes, we sought to understand the impact of debt
judgments relative to income at the zip code level. A comparison of median household income to award
amounts indicates that debts may be more burdensome for residents in some communities. The map
below shows the average judgment amount in each zip code as a proportion of median income.
Judgments represented over 10% of the median household’s annual income in zip codes that include
neighborhoods with some of Philadelphia’s highest concentrations of lower-income Black residents:
Mantua, Strawberry Mansion, and Nicetown-Tioga. See map below.
Average Judgment Amount as Share of Median Household Income
Case Outcomes and Property Ownership
Of the 58,535 cases with one defendant in our sample, we were able to successfully match 55,700 (95%)
to a property parcel in Philadelphia, based upon the defendant’s address and OPA parcel data. By
comparing defendant names with property ownership records, we estimate that 26,547 (48%) of
defendants owned the home where they were served at the time of case filing. For property owners,
judgments are liens against real property, making it difficult to access home equity or refinance, and
potentially contributing to the city’s long-running challenges around tangled titles.
Across all race/ethnicity categories, the majority of defendants were renters. Hispanic defendants were
the least likely to own their home and White defendants were the most likely.
15Defendant Property Ownership in Philadelphia by Race/Ethnicity
White Black Hispanic Asian Other
Total
Defendants Defendants Defendants Defendants Defendants
Property Owning 7,197 (49%) 13,166 (48%) 3,905 (45%) 1,597 (48%) 682 (48%) 26,547 (48%)
Non-Property Owning 7,559 (51%) 14,275 (52%) 4,752 (55%) 1,733 (52%) 834 (52%) 29,153 (52%)
All Cases 14,756 (100%) 27,441(100%) 8,657 (100%) 3,330 (100%) 1,516 (100%) 55,700 (100%)
Service by Ownership Status
The chart to the left compares the rate of
Service by Ownership Status service among presumed homeowners and
Including Cases with Only One Defendant renters. Renter defendants were almost twice
100% as likely as owner defendants to have a case
82%
80%
dismissed for no service.
67%
60%
40% 33%
18%
20%
0%
Service No Service
Prop. Owners Non-Prop. Owners
Case Outcomes and Property Ownership
The table below outlines case outcomes organized by property ownership status of defendants. Overall,
property owners were less likely to default— 64% compared to 68% of non-property-owners.
Otherwise, outcomes were nearly the same for both groups.
Outcomes by Ownership Status
Property Owning Non-Property
Total
Defendants Owning Defendants
Withdrawn 2,679 (12%) 2,208 (11%) 4,887 (12%)
Judgment for Defendant 610 (3%) 433 (2%) 1,043 (3%)
Settlement 1,336 (6%) 970 (5%) 2,306 (6%)
Judgment by Agreement 3,072 (14%) 2,438 (13%) 5,510 (13%)
Judgment for Plaintiff on the Merits 148 (1%) 115 (1%) 263 (1%)
Judgment for Plaintiff by Default 13,679 (64%) 13,325 (68%) 27,004 (66%)
All People 21,524 (100%) 19,489 (100%) 41,013 (100%)
16Award Levels and Property Ownership
In general, claim amounts entered for property-owning defendants were larger, averaging $2,978
compared with $2,644 for non-property-owning defendants.
Property-owners had slightly bigger award reductions when they entered into JBAs. When property-
owners were involved in cases that ended as a Judgment for Plaintiff on Merits, they owed more,
relative to the original filing than non-property owners. Awards on average were for 88% of the claim
compared to 83% for non-property-owning defendants.
Average Amounts Claimed and Awarded Among Cases with JBA, Judgment for the Plaintiff on the
Merits, and Judgment for Plaintiff by Default, by Property Ownership Status
Number of Cases Claim Amount Amount Awarded Difference
including Court Costs
Prop. Non-Prop. Prop. Non-Prop. Prop. Non-Prop. Prop. Non-Prop.
Owner Owner Owner Owner Owner Owner Owner Owner
1,924 1,628 -$95 -$37
JBA $3,034 $2,648 $2,939 $2,611
(12%) (11%) (97%) (99%)
Judgment for Plaintiff 148 115 -$538 -$731
$4,586 $4,474 $4,048 $3,743
on the Merits (1%) (1%) (88%) (83%)
Judgment for Plaintiff 13,679 13,325 $100 $98
$2,953 $2,628 $3,053 $2,726
by Default (87%) (88%) (103%) (103%)
15,751 15,068 -$71 -$77
All Cases $2,978 $2,644 $3,049 $2,721
(100%) (100%) (98%) (97%)
Defendant Narratives
To better understand the experiences of defendants, Reinvestment Fund interviewed five individuals
involved in a debt collection case in 2020. RF asked interviewees about their household finances,
awareness of legal or financial counseling services, additional resources available to pay off debt
including family support or savings. Interviewees were also asked about the impact the Coronavirus had
on their financial wellbeing. Case outcomes for interviewees included three judgments for plaintiff by
default, one withdrawal and one judgment by agreement. Four interviewees were Black, one was
Hispanic. All dollar figures reported below were rounded to protect the respondents’ privacy.
Respondent One: New to credit, student loans
Respondent One was a 29-year-old Black woman with an annual household income of $23,000.
Respondent One was sued by an assignee of CitiBank for nearly $1,200 plus $117.75 in court fees.
Although she recognized the debt in question, Respondent One reported that she no longer lived at the
address where service was made and was unaware of the case against her. Court records show that her
case ended in a judgment for plaintiff by default. She had not been involved in other debt collection
cases.
Asked about the source of her debt, Respondent One reported that when she turned 18, she received
multiple credit card offers. She was unemployed and in college at the time, “I had no money, so I was
paying for things with the credit card.” She was able to make payments on the cards until her wages
were garnished to repay her student loans. She did not have enough money to pay off the full debt and
reported that she could only make the minimum payments. She was not able to ask friends or family for
help and did not have $3,000 of savings.
17Respondent One was unaware of city-funded credit counseling but did participate in a program that
promised to “close out her cases.” The program, whose name she could not remember, and which she
found through a Google search, told her she could not consolidate her debt, because it was too low, but
could pay off her debts if she could make a payment of $50 a month.
Respondent One was aware that her debt had impacted her credit rating. She reported her credit score
was low but improving as she repays her student loans. She has been unable to get a mortgage. She
feels that she was targeted and that she should not have had so much credit extended to her at a young
age without more guidance.
The Coronavirus pandemic has positively impacted her financial situation. She reported her student
loans are on hold, and she can save money for the first time. She has not taken on any new debt and
does not plan to until she gets a mortgage.
Respondent Two: Confusing information, medical emergency, Coronavirus, job loss
Respondent Two was a 50-year-old Black woman with an annual household income of $19,200. She
learned of the case against her from two letters she received. Each listed a different court date, but the
plaintiff names were similar. She believed it was two notifications for the same case and attended one
date, but not the other. The case she attended was resolved with a JBA, and Respondent Two was
surprised when she received a notice from the second case indicating that she still owed money. Prior to
these incidents she had never been sued in a debt collection case.
According to court records there were two debt cases against her in early 2020. In one, the plaintiff was
Midland Funding LLC seeking nearly $850 plus $117.75 in court fees. As she reported, the case was
resolved with a JBA. In the second case, the plaintiff was Midland Credit Management Inc. seeking
nearly $1,000 plus $120 in court fees.
Respondent Two recognized the credit card debt from the case that ended in a JBA. She estimated it was
two years old, from a period where she was unable to keep up with her payments after being
hospitalized and subsequently losing her job. In addition to this debt, she had a mortgage and a car loan.
She did not have $3,000 in savings, could not borrow money from friends or family, and did not have
enough savings pay off the total amount of the claim. She reported ranking her bills to keep up with her
monthly expenses and she was unaware of city-funded credit counselling agencies.
Respondent Two reported her credit was damaged by the JBA but did know of a lien on her home.
Typically, a lien will be filed as part of a JBA but is not executed as long as payments are made on time.
Respondent Two shared she was making her payments, so she may be unaware of the lien. She believes
it will take about 32 months to pay off the debt.
When asked about the impact of the Coronavirus on her finances, she reported it has made it more
difficult to pay her bills. After surgery, her immune system was compromised, and she was unable to
work in her public facing position in the airline industry. Her income from disability is much less than she
earned when she was working. She is currently relying more on her credit card to cover expenses.
18Respondent Three: Fixed Income, Debt Consolidation Company
Respondent Three was a 70-year-old Black woman with an annual income of $25,000 a year. TD Bank
sought nearly $1,500 plus $117.75 in court fees. Court records show that her case was withdrawn
without prejudice and indicate service was made to a relative at her home address, however, she was
unaware of the case prior to our interview. She has not been sued in any other debt collection cases in
the past ten years.
Respondent Three recognized the two-year-old debt from a credit card account. Recently retired, she no
longer had enough income to cover her household expenses. She began prioritizing her bills each
month. She had about six or seven other store cards but had paid off the mortgage on her home. She
did not have $3,000 of savings to pay the debt and she did not ask friends or family for help, preferring
to handle it on her own. No liens have been filed against her home because of her debt.
A debt consolidation company sent information to Respondent Three and she decided to work with
them to reduce and pay off her debt. She agreed to pay $200 or $300 a month over 36 months. She
reported it started off well, they paid off some of the debt, but her contact kept changing and then they
stopped being responsive. To her knowledge, she has paid off everything that she owes to the company.
Since she was unaware of the case, Respondent Three did not try to hire a lawyer. She was not aware of
free legal services or city-funded credit counseling agencies, but she reports that her credit score has not
been affected by her debt. However, she shared that her interactions with the debt consolidation
company felt invasive and confusing. She no longer feels comfortable talking to anyone about help with
managing credit cards or debt.
When asked about the impact of the Coronavirus pandemic, Respondent Three reported it did not have
an impact on her financial life. She no longer has any credit cards and has no plans to take on new debt.
She relies on one debit card to pay for her expenses.
Respondent Four: Debt from Starting a Business, Debt Collection Company
Respondent Four described himself as a 53-year-old Black African with an annual household income of
$42,000. The plaintiff, Barclay’s Bank, sought nearly $2,000 and $72.75 in court fees. Respondent Four
learned about the case through his monthly practice of searching his name in court documents online.
He recognized the credit card debt described in the case from a debt he incurred when he opened a
restaurant, which he had funded with multiple credit cards. When the restaurant failed, he was left with
the debt. The case outcome was a judgment for plaintiff by default.
Respondent Four had been involved in other debt collection cases over the last ten years. He did not
have $3,000 in savings at the time. He felt he could have relied on his community to support him in
paying off the debt, but then he would owe them the debt informally instead and the tradeoff did not
seem worthwhile.
Respondent Four decided to consolidate his debt with a private company, National Debt Relief. He felt
negatively about his experience. He believed it resulted in him owing more money, because ‘once they
settle a debt for you, you have to start paying them too.’ He reported that National Debt Relief had
garnished much more than the amount of the debt from his account, and he was upset about the high
fees apparently charged.
19After he learned of the case, he called the credit card company to whom he originally owed the debt.
Their representatives reported they were already in conversation with National Debt Relief. Believing
that National Debt Relief would be attending court and handling the case on his behalf, he did not hire a
lawyer or attend the court date himself. He was disappointed to learn that a lawyer from National Debt
Relief had not attended the court date to represent him. He was still disinterested in hiring a lawyer
citing concerns about cost. He was not aware of free legal services. The current judgment against him
requires him to pay $1,600 over 21 months. He has not started paying because he has not yet received
the official paperwork. But he feels he will be able to pay it off in time through extracting equity from his
home.
The Coronavirus has had a negative impact on Respondent Four’s financial life. He had to close his
restaurant. His credit has been negatively impacted by the debt, and he is unable to secure any new
loans. He will have to work much longer than originally planned to pay off his current debts. Respondent
Four also shared his loss of income from Coronavirus has reduced his ability to send money back to his
country of origin.
Respondent Five: Difficult times, slow recovery
Respondent Five was a 49-year-old Hispanic woman with a household income of $30,000 a year.
Synchrony Bank sought $2,000 plus $117.75 in court fees. Although court documents indicated service
had been made to a member of her household, she reported she had not been living at the address
listed in court documents when service was made and she was unaware of the case prior to our
interview. Her case outcome was recorded as a judgment for plaintiff by default. She had not been sued
in a debt collection court in the last ten years.
Respondent Five reported that several difficult events had happened to her in a short period of time
including: a COVID diagnosis, job loss, separating from her husband and temporarily moving out of her
home, which she owned. She felt her personal life was affecting her financially.
Respondent Five recognized the debt from a credit card but was not aware it had escalated to a court
case. She was unable to keep up with the credit card payments after she lost her job and she had to
choose between paying her rent or paying down her credit card. At the time she incurred the debt she
did have $3,000 of savings. However, she had just lost her job, so she was hesitant to use her savings to
pay off her debt.
She was not aware of credit counseling agencies in the city. As she was unaware of the case, she did not
try to hire a lawyer. She felt unsure of the court process but was open to the idea of using a lawyer to
represent her. Now that she is working again, Respondent Five feels she could pay off the debt if she
could enter a payment plan agreement. Respondent Five was not sure if the case had negatively
impacted her credit score. She knows her score is low but was not sure if it was related to the case.
Respondent Five’s financial wellbeing was also impacted by the Coronavirus pandemic. She was
diagnosed with COVID-19 in March. She then lost her job as an assistant director for a social service
agency. She recently began working as a cleaner and was taking as many hours as she could. She is
concerned with the new round of restrictions, many of the institutions she had been cleaning would
close, leaving her again without work. She has been unable to take on new debt due to her low credit
score.
20Methodology and Data
This memo analyzed court records for cases filed in Philadelphia Municipal Court between January 2016
and April 2020. The sample of cases was restricted to include only Consumer Purchase (Type 4) cases
and cases with at least one Philadelphia resident defendant. This excludes cases where all of the
defendants reported home addresses outside of the city and cases where all of the defendants were
business entities, leaving 59,618 unique case records to analyze.
Case outcomes were determined by reviewing court docket entries to identify each disposition filed for
each case. Court dispositions were classified into 10 categories associated with the outcome of each
case. In cases where multiple dispositions were filed, it was assumed that the disposition filed on the
most recent date was the final ruling.
In cases with multiple defendants, where multiple dispositions were entered, the case was classified as
Judgment by Agreement (JBA) or Settled if any of the defendants entered into a JBA or Settlement. The
case was classified as a Judgment for the Plaintiff if there was no JBA/Settlement and at least one of the
defendants had a judgment decided against them. Cases without a JBA/Settlement or Judgment for the
Plaintiff, but at least one Judgment for the Defendant were classified as having had a Judgment for the
Defendant.
Summary of Case Outcomes
Total Cases Share of Cases
No Service 15,114 25.4%
Withdrawn 5,321 8.9%
Bankruptcy 63 0.1%
JBA 5,878 9.9%
Settled 2,458 4.1%
Judgment for Plaintiff by Default 28,444 47.7%
Judgment for Defendant by Default 301 0.5%
Judgment for Plaintiff on the Merits 295 0.5%
Judgment for Defendant on the Merits 804 1.3%
Ongoing 940 1.6%
Total Cases 59,618 100%
Estimating Defendant Race and Ethnicity
The analysis employed Bayesian Improved Surname Geocoding (BISG) to estimate and analyze the likely
race of defendants involved in the cases analyzed in this report. The BISG analysis uses defendant
surnames and defendant home addresses to estimate the probability that each defendant is White,
Black, Hispanic, or Asian. Individual defendant surnames are compared to a list of race-coded surnames
from the 2010 US Census. Individual estimates are further improved by analyzing the demographics of
the census tract in which each respondent lives. The BISG technique is currently used by Consumer
Finance Protection Bureau’s Office of Research, Division of Supervision, Enforcement, and Fair Lending
in both supervisory and enforcement contexts. For more information about the BISG analysis and its
reliability, see: https://files.consumerfinance.gov/f/201409_cfpb_report_proxy-methodology.pdf
21Analyzing Patterns in Property Ownership
Reinvestment Fund also analyzed the share of defendants who own or owned real property in
Philadelphia at the time of the debt collection filing against them.
Property ownership was determined by comparing defendant address and name to the city’s Office of
Property Assessment (OPA) parcel ownership records. In the event that a matching address was not
identified within the OPA dataset solely using address, a comparison of names was done with all
properties within a 20-meter radius of the defendant address.
If the first and last name of the defendant name successfully matched with any owner name for the
matched OPA address, we conclude that the defendant was a property owner in Philadelphia. If only the
first or only the last name of the defendant name successfully matched with an owner name on the
matched OPA address, we also concluded that the defendant was a property owner in Philadelphia. 4
The decision to mark the status of a defendant as property owner in the event of a partial match (first
name match only or last name match only) is supported by a number of possibilities. In the event of a
last name match only, we make the assumption that the defendant is related to the property owner in
some way. In the event of a misspelled first name (Katherine versus Kathryn) combined with a matched
last name, we can reasonably assume a match. This methodology may not identify some defendants
who reside in an inherited home if the deed was not updated (i.e., a tangled title).
For the property ownership analysis, we focused on the subset of cases that involved a single defendant.
Multi-defendant cases, which comprise approximately 2% of all cases in the analysis, introduce
additional complexity. For example, available court records do not indicate how defendants are related,
making it difficult to assess how defendants who live together are related or share ownership of their
property. For defendants living at separate addresses, it is unclear how the debt referenced in the case
is shared. Multi-defendant cases are included in all other analyses in this report.
Defendant Interviews
To understand more about defendant experiences in Municipal Court, Reinvestment Fund also
conducted five interviews with defendants named in completed cases filed between February and
March 2020. Interviews were conducted with a random sample of defendants who were identified as
Philadelphia residents with claims between $750 and $2,250 (nearly half of all completed cases with
service fell within this range). To ensure racial diversity, each selected defendant had a BISG
race/ethnicity estimation of 85 percent or higher. Each respondent’s race was confirmed during the
interview.
Case outcomes for interviewees include JBA, judgment for plaintiff by default, and withdrawn.
Interviewees were contacted by phone and offered at first a $20 and later a $50 Visa gift card as an
incentive to participate. Full interview script appears in Appendix A.
4 16,007 (58.2%) matches were full matches while 11,501 (41.8%) were partial matches.
22Appendix I: Case Outcomes and Missing Data
Analyses of award amounts in this report only examined cases with valid judgments entered in the
docket. Nearly every case with a judgment for the plaintiff by default or on the merits had a valid
judgment amount entered into the docket. Cases where the outcome was classified as a JBA or
settlement did not always have judgment amounts. In 36% of JBA cases, the judgment amount was
recorded on the docket in a pdf file and could not be analyzed. In a similar way, nearly every settlement
case (99% of cases analyzed) did not include information about the settlement amount anywhere on the
docket.
The table below shows the characteristics of excluded cases (those without award data), compared with
cases that had full judgment award information. Cases concluded through a JBA that had data and those
that were missing data were roughly equivalent in terms of the amount sought, while the few
settlement cases that did have award data had lower claim amounts than cases with missing award
data.
Total Case Counts and Average Amount Sought Among Cases with and Without Award Data
Cases with Award Data Cases without Award Data
Total Cases Claim Amount Total Cases Claim Amount
Judgment by Agreement 3,779 $2,454 2,443 $2,398
Settlement 15 $2,918 2,099 $3,378
All Excluded Cases 3,794 $2,456 4,542 $2,851
23Appendix II: Additional Maps and Tables
Average Amounts Claimed and Awarded by Case Outcome and Predicted Race of Defendants
Race Total Average Average Dollar Percent
Ethnicity Cases Claimed Awarded Difference Difference
Asian 1,641 $3,229 $3,333 $104 +3%
Black 14,303 $2,732 $2,827 $95 +3%
Judgment for
Hispanic 4,365 $2,697 $2,796 $98 +4%
Plaintiff by
Other 751 $2,877 $2,974 $97 +3%
Default
White 7,384 $3,038 $3,139 $101 +3%
Total 28,444 $2,839 $2,936 $97 +3%
Asian 193 $3,133 $3,062 -$71 -2%
Black 2,107 $2,828 $2,773 -$55 -2%
Judgment by Hispanic 656 $2,811 $2,738 -$73 -3%
Agreement Other 97 $2,980 $2,909 -$71 -2%
White 725 $3,211 $3,097 -$113 -4%
Total 3,779 $2,918 $2,848 -$70 -2%
Asian 21 $4,732 $3,678 -$1,054 -22%
Black 131 $4,602 $4,101 -$501 -11%
Judgment for
Hispanic 53 $4,631 $3,985 -$646 -14%
Plaintiff by
Other 8 $5,036 $4,177 -$859 -17%
Merit
White 81 $4,866 $3,905 -$961 -20%
Total 294 $4,701 $3,997 -$704 -15%
Asian 1,856 $3,236 $3,309 $72 +2%
Black 16,541 $2,759 $2,830 $71 +3%
All Cases with Hispanic 5,074 $2,732 $2,801 $69 +3%
Award Data Other 856 $2,908 $2,977 $69 +2%
White 8,190 $3,071 $3,143 $72 +2%
Total 32,517 $2,865 $2,935 $70 +2%
24Location and Defendants and BISG Race/Ethnicity Estimates
Defendant Defaults by Zip Code
25Appendix III: Defendant Interviews
Intro Script
Hello {name of person trying to contact} my name is {name} and I am part of a team of researchers
working on behalf of a local non-profit. We are interviewing Philadelphians so that we can better
understand people’s experience with Philadelphia’s debt collection court. The information we learn
from these interviews will help be used to better serve struggling households and to identify ways to
improve how the court handles collection cases. Your answers will be kept anonymous. All participants
will receive a $20 (the amount was later increased to $50) Visa gift card. The interview will take about 10
to 15 minutes.
Are you interested in participating?
Is now a good time to do the interview or can we set up another time?
Screen
Is your name {name}?
Do you now or have you ever lived at {address}?
How get there
Were you involved in a court case with {entity name from court data} on {date from court data}?
If the interviewee does not remember or is not aware of the case use information cleaned from the
docket including original entity claiming the debt, service details and amount sought.
For anyone who isn’t aware of the case, inform interviewee they can get legal advice by calling the Bar
Association’s Lawyer Referral and Information Service at 215.238.6333 for a private lawyer or, if they
can’t afford a lawyer, by calling Community Legal Services at 215.981.3700.
• Were you aware of the legal case against you when it was filed?
o How and when did you find out about the case or judgment?
o Did you recognize the debt you were being sued on?
o If you recognized the debt, what was the nature of the debt?
o Probe: credit card, car-related, medical, student loans
o When do you think you acquired the debt?
• Do you remember what circumstances led to the initial debt?
o Unexpected one-time expense?
o Keeping up with regular household expenses?
o Something else?
• Do you remember about when you took on the debt?
• Do you remember what circumstances led to not being able to keep up with payments on the
debt?
o Loss of job?
o Unexpected medical, household, or other expense?
o Just too many bills piling up?
26• At the time you incurred the debt, did you have other debts at the time (like credit card,
student, mortgage)?
• At the time you incurred the debt, did you have savings of more than $3,000?
• Did you have difficulty paying any other bills at the time of this court case? If so, did you ever
rank your bills – and either pay some late or not at all?
• Have you been sued in another debt collection case in the past 10 years?
• Are you aware of the city-funded credit counseling agencies in the city? If so, did you ever talk
with a credit counselor about how to deal with the debt?
• At the time the lawsuit was filed, did you have cash available to pay the claim amount if you
wanted to?
o Did you have friends or family from whom you could borrow?
Court Experience
• Did you ever try to hire a lawyer to help in the case? If not, why not?
o Probe for:
Costs too much money,
did not think it would help,
did not know how to get one
o Did you know at the time that many people in Philadelphia who can’t afford to hire a
lawyer qualify for free legal help?
If yes, did you know how to request free legal help?
• Did you go to court in this case?
[for participants whose cases ended in JBA or withdrawal only]
o Did you end up settling the case for less than what you were being sued for?
o At the time the judgment was entered, did you own a home or other property in
Philadelphia?
Did the judgment impact your ownership of that property? Was a lien filed?
o Were you able to work out a payment plan? Did it feel like a realistic, affordable plan to
you?
Household Financial Impact
• If you agreed to a payment plan in the case, how much is or was your monthly payment?
o Are you still paying on that plan? If not, why not?
o Did/does this payment affect your ability to pay other bills? Do you have to rank your
bills or leave some bills unpaid to make your payment?
• Has your credit been impacted by the case?
• Have other aspects of your life been impacted by the case?
• Do you think you will pay off the judgment? If so, how long do you think it will take?
• Is there anything else you’d like to share about the impact of this debt collection case on your
life or your finances?
27Those are all the questions about the collection case. The next few questions are about how the
coronavirus pandemic has impacted your finances.
Coronavirus
• Have you had or are you now having difficulty making payments on credit cards or loans
because of the Coronavirus pandemic?
• Have you taken on new debt, or do you think you will need to take on new debt (credit card or
otherwise), because of the coronavirus pandemic?
• Any other surprising ways that this or other debt has impacted you?
Demographic questions
• What is your age?
• What is your approximate annual household income?
• What is your race and ethnicity?
Those are all the questions we have. Thank you for your time and sharing your experience.
Please let us know where we can send your gift card. We will keep your address private and will not use
it for anything other than mailing the gift card.
28Reinvestment Fund has published a range of reports addressing critical
public policy issues. The highlighted reports below represent recent housing
research projects. For details, please visit our Policy Publications site:
WWW.REINVESTMENT.COM/IMPACT/RESEARCH-PUBLICATIONS
2020 2020
Mortgage Lending in Understanding 21st Century
Philadelphia: Key Take- Gaps in Homeownership
Aways from the 2018 Home Between White and non-
Mortgage Disclosure Act White Households in
Data Release Pennsylvania
2019
2020 2021
Residential
HEMAP’s Enduring
Rental Property
Impact Evictions in Philadelphia:
in Pennsylvania
Owner Perspectives and Race (and Place) Matters
Practices in Philadelphia:
Evaluating Challenges
during the COVID-19
Pandemic
REINVESTMENT FUND is a national mission-driven financial institution that creates
opportunity for underserved people and places through partnerships. We marshal the capital,
analytics, and expertise necessary to build strong, healthy, and more equitable communities.
PHILADELPHIA BALTIMORE ATLANTA
www.reinvestment.com 1700 Market Street 1707 North Charles Street 229 Peachtree Street NE
www.policymap.com 19th Floor Suite 200B Suite 750, International Tower
Philadelphia, PA 19103 Baltimore, MD 21201 Atlanta, GA 30303
TEL 215.574.5800 TEL 410.783.1110 TEL 404.400.1130
real estate early healthcare healthy housing k-12 data & clean
education food education analysis energy
Reinvestment Fund is an equal opportunity provider.You can also read