December 2015 - World Bank Group
←
→
Page content transcription
If your browser does not render page correctly, please read the page content below

Research for Developing Tools of the System Assessment for Better Education Results
(SABER): A Focus on the Participatory School- Based Management System,
Decentralization, and Accountability

Measuring Quality of Policies and Their Implementation for
Better Learning: Adapting the World Bank’s SABER Tools on
School Autonomy and Accountability to Burkina Faso
  Takako Yuki, Kengo Igei, and Angela Demas

                 No. 109

           December 2015

                                        0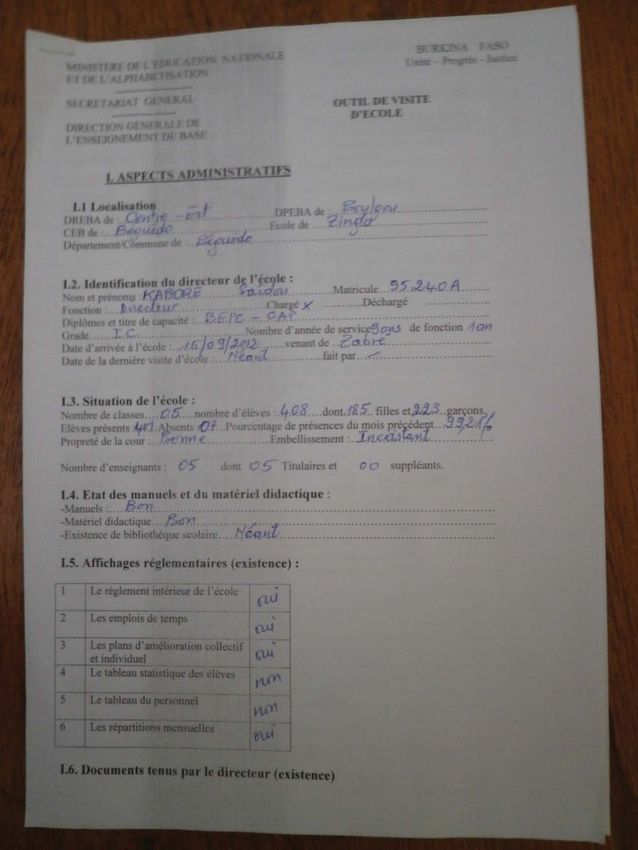
Use and dissemination of this working paper is encouraged; however, the JICA
Research Institute requests due acknowledgement and a copy of any publication for
which this working paper has provided input. The views expressed in this paper are
those of the author(s) and do not necessarily represent the official positions of either the
JICA Research Institute or JICA.

JICA Research Institute
10-5 Ichigaya Honmura-cho
Shinjuku-ku
Tokyo 162-8433 JAPAN
TEL: +81-3-3269-3374
FAX: +81-3-3269-2054
Measuring Quality of Policies and Their Implementation for Better Learning: Adapting
the World Bank’s SABER Tools on School Autonomy and Accountability to Burkina Faso

                                                      †                 ‡
                           Takako Yuki *, Kengo Igei , Angela Demas

Abstract
This paper examines the quality of the policy intent with respect to the school-based management
system in Burkina Faso. It discusses the difference between policy intent and policy
implementation; focusing on the functionality of school councils and their synergies with
decentralization and assessment policies to achieve better learning results. A new policy diagnostic
tool, developed and revised by the World Bank and its partners including JICA was adapted to the
context of Burkina Faso. This tool is based on international evidence of good practice collected
under the System Approach for Better Education Results (SABER) program, relating to the policy
domain of School Autonomy and Accountability (SAA). First, for the quality of policy intent, those
policies that concentrate on the roles of school councils are assessed as advanced, and as emerging
directions on school autonomy through decentralization to communes of operational budget
management and teacher deployment, while policies on standardized student assessments are said
to be advanced on their frequency of use. Differences among stakeholders in the degree of policy
implementation were found using survey data collected in 2013 from various level actors, including
rural school directors, school councils, and local administrations. Regarding school councils, called
COGES (Comités de Gestion des Etablissements Scolaires), these differences are on whether such
councils exist and on how functional they are. The degree of functionality, as measured by
community and parental voluntary contributions to schools, is significantly associated with
variables relating to implementation of procedures in COGES, such as organizing a general
assembly and the Federation of COGES, while controlling for other community contexts. The level
of functionality of COGES significantly explains the observed differences in the quality of
education services and learning achievements in Burkina Faso. Moreover, the use of student
assessments is also positively related to learning achievement. The indicator representing the
common views of stakeholders on decentralization also shows a significantly positive association
with the functionality of the COGES system, and the availability of supplementary lessons. These
findings suggest that strengthening policy implementation within participatory COGES, along with
decentralization and the use of assessment tools, is important for better learning results.

Keywords: SABER, a systems approach, benchmarking, SBM (school-based management),
COGES (school councils), community participation, accountability, assessment, decentralization,
primary education, Burkina Faso, World Bank

*
  Senior Researcher, Global Link Management, Inc., Corresponding Author: yuki.takako@glm.co.jp.
†
  Research Assistant, JICA Research Institute.
‡
  Senior Education Specialist, World Bank.

                                                  1
Section 1: Introduction

Despite the remarkable worldwide progress towards universal primary education, more than

60 million primary school aged children do not attend school, and if we include those children

who are at school but do not acquire the basics, and those children who dropout before

reaching Grade 4, this number increases to 250 million (UNESCO 2014). At the World

Education Forum 2015, the international community committed to providing meaningful

education opportunities for out-of-school children, as well as to quality of education and to

improving learning outcomes. 1

        School-based management (SBM) is a popular domain of education policies that has

been addressed by governments and development partners to improve school participation and

learning. SBM is seen as a way to decentralize decision making power in education from the

central government to the school level (Caldwell 2005; Barrera, Fasih, and Patrinos 2009), and

the school can be represented by any combination of school directors, teachers, parents, other

community members, and students. Decentralization is expected to encourage demand for a

higher quality of schooling, ensure schools reflect local voices and priorities, and then bring

better education outcomes and beneficiary satisfaction. In practice, SBM has been introduced

in various forms and it has had a variable impact on education results.

        As an effort to systematically learn from good practices, and to benchmark these when

helping a country assess its SBM system and identify areas for improvement, the World Bank

and its partners have prepared analytical tools on school autonomy and accountability (SAA).

SAA is one of the policy domains for which analytical instruments have been developed and

tested under the program called the Systems Approach for Better Education Results (SABER),

which is an initiative to produce comparative data and knowledge on education policies and

institutions (Rogers and Demas 2013; Demas and Arcia 2015). Overall, the SABER program

1
   Incheon Declaration on Education 2030: Towards inclusive and equitable quality education and
lifelong learning for all (https://en.unesco.org/world-education-forum-2015/incheon-declaration).

                                               2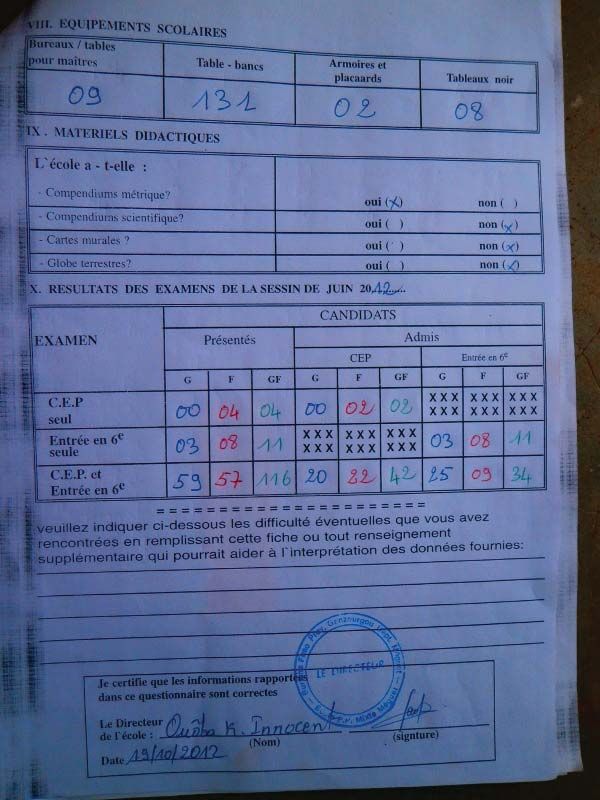
first focused on benchmarking the quality of policy. Then, it began to more explicitly address

the gap between policy intent and policy implementation, especially for developing countries

where institutional capacities are known to be generally weak. This was a response to the

feedback from stakeholders, including the government officials of pilot countries.

        Burkina Faso, our case country in this paper, is a pilot country for SABER-SAA and a

developing country that aims to use SBM to improve education results. Despite remarkable

progress, 2 the country’s primary completion rate was only 58% in 2012 3, and more than 70%

of children of primary school age did not reach Grade 4, or achieve a minimum learning

standard in reading (UNESCO 2014, 193). The two series of regional learning assessments

(PASEC) indicate a significant decline between 1996 and 2006 in the level of student

achievement for Mathematics at Grade 2, and this decline may be due to the way school

participation has evolved (CONFEMEN 2009). Issues of both access and quality of learning

have been more prominent in rural than urban areas Vachon 2007; Chiche et al. 2010; Lewin

and Sabates 2011). The country’s education strategy (Program for Strategic Development of

Basic Education: PDSEB 2012-2021) tackles these challenges by seeking to achieve the

objectives of Education for All by 2021 (MOE 2012a). One of the five main (basic) principles

of the implementation of the PDSEB is democratic governance of the education system based

on the principles of decentralization, devolution and community participation (DEP/MOE

2013). This is also part of a larger movement concerning decentralization for Burkina Faso

that has been on-going since the 1990s. 4

        The objective of this paper is to examine the policy intent with respect to SBM and

SAA in Burkina Faso, and the difference between policy intent and policy implementation. Its

2
  According to the Burkina Faso Ministry of Education (2013, December), the Ten-Year Plan for the
Development of Basic Education (PDDEB) implemented between 2001 and 2010 has greatly improved
primary school enrollment. For example, between 2001 and 2010 the Gross Intake Rate (GIR) rose from
47.4 to 85.8%, the Gross Enrolment Rate (GER) from 45.9 to 74.8%, the Primary Completion Rate
(TAP) from 27.4 to 45.9%, and the success rate for gaining the Certificate of Primary Education (CEP)
from 62.3 to 65.9%.
3
  World Bank online data, downloaded May 2014.
4
  See Dafflon et al. (2013) for timeline of key decentralization policies in Burkina Faso, 1991-2011.

                                                 3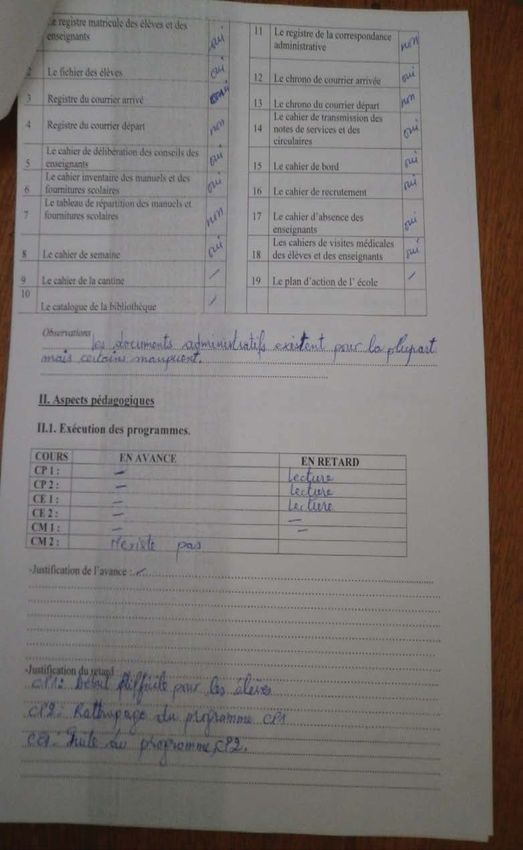
purpose is to highlight which gaps it may be important to close in order to improve education

service delivery and results in rural primary public schools. Built on the World Bank

SABER-SAA diagnostic tool, we developed a complementary tool - a set of questionnaires to

collect detailed information on policies, their implementation, and contexts. These

complementary rubrics were used in 2013 to interview education officers, school directors,

and school councils. The opinions of these people were collected and their administrative

records documented.

        In Section 2 the paper explains the SABER-based analytical framework. Section 3

analyzes the policy intent, which updates and details what the World Bank’s SABER-SAA

assessment found in 2011-2012. Section 4 explains the descriptive statistics of policy

implementation, and presents the empirical analyses. Lastly, Section 5 discusses the

implications for policy reforms and policy monitoring mechanisms.

Section 2: Analytical Framework

2.1 A framework for assessing the SBM system for better education results

To assess the quality of the SBM system (its policy intent), this paper adopts the framework

for what matters most in school autonomy and accountability (SAA) with respect to better

education results. The framework and analytical tools for SAA were prepared by the World

Bank in collaboration with JICA and other partners under the SABER program, according to

global best practice and empirical evidence (see Demas and Arcia 2015 for details).

        The SABER-SAA framework seeks to identify what combination of school

management practices is important for successful education outcomes (Figure 1). As Arcia et

al (2014) point out, while such management practices are still under study, the lessons learned

in the last 30 years indicate that combining managerial autonomy, assessing students learning,

and being accountable to parents and other stakeholders tends to produce good school

performance and increased learning (Bruns, Filmer, and Patrinos 2011). School management

                                              4
under autonomy (with decision-making authority over their operations) may give an important

role to the School Council (e.g. Parent-Teacher Associations), which can include represents of

parents and communities. Although accountability was not initially linked with school

autonomy, in the mid-1990s the concept of autonomy with accountability became increasingly

important (Demas and Arcia 2015). The results from PISA also suggest that combination of

autonomy and accountability tend to be associated with better student performance (OECD

2011). The experience of high-performing countries on PISA, for example, show that

education systems in which schools have more autonomy over resource allocation and those

that publish test results perform better than schools with less autonomy.

        The SABER-SAA framework is detailed as a set of policy goals and action indicators

to be used to benchmark SBM systems or policies on school autonomy and accountability to

ensure better school performance (Table 1). Five policy goal indicators are specified as below

on the basis of empirical evidence from various countries (see Bruns, Filmer, and Patrinos

2011 for a review of the literature, and Demas and Arcia 2015 for summary evidence on each

policy goal identified by SABER-SAA), along with cautions over differences in country

contexts, including the level of capacity of local stakeholders, that can affect how SAA

reforms work:

z   Policy Goal 1, “school autonomy in budget planning and management,” is assessed
    against the degree of local and school authority over school budgets or funds that may
    lead to better incorporation of the interests of local stakeholders and parents, and
    improvements in operational efficiency;
z   Policy Goal 2, “school autonomy in personnel management,” is assessed against the
    degree of local and school authority over personnel appointments and deployment;
z   Policy Goal 3, “the role of school councils in school governance,” is assessed against the
    degree of the participation of school councils (or PTAs) in school finance and activities,
    and how these have been organized to foster a better understanding of their roles and the
    execution of their roles in a transparent and inclusive manner;
z   Policy Goal 4, “school and student assessment, “ is measured against policies that ensure
    regular measurement of student progress as a key precondition for ensuring accountability,
    and against the routine use and sharing of assessment results among various levels of
    stakeholders to reflect and make pedagogical, operational, and personnel adjustments for
    the purpose of improving student performance; and
z   Policy Goal 5, “school accountability”, is assessed by analyzing the way in which
    stakeholders receive comprehensive information on their schools, and how far the school

                                               5
complies with its own regulations.

2.2 A framework for assessing both policy intent and policy implementation

Education outcomes depend not only on the quality of the policies themselves and the

institutional framework within which they operate, but also on whether those policies and

frameworks are implemented effectively at the local and school level (Rogers and Demas 2013,

11). As Figure 2 illustrates, SABER attempts to address “what lies between an education

system’s inputs (the monetary and other resources that go into it) and its outcomes (such as

years of education completed and learning acquired by students)”, which is often a “black

box”. The elements of this approach can be conceptually categorized into three sets (Rogers

and Demas 2013, 4). The first concerns the quality of policies and institutions, and the second

concerns the quality of policy implementation. Both of these are assumed to have major

influences on the third set (the quality of education delivered), which in turn affects student

learning outcomes.

        We applied the conceptual framework of the SABER result chain to our analysis of the

relationship between policy intent and policy implementation, and to the relationship between

better policy implementation and education results. We also added another set of elements on

the means and contexts that can support policy implementation in terms of each actor’s

leadership, organizational characteristics, and community characteristics. Then, by reviewing

the SABER-SAA policy implementation rubrics 5 and the existing tools of other school and

administration surveys, the research team developed a range of complementary tools: a set of

questionnaires for sub-national (regional, provincial, district, and commutes) and school-level

actors in Burkina Faso (discussed further in Section 4).

5
  The World Bank team conducted an assessment of policy implementation on school autonomy and
accountability for Thailand (Arcia et al. 2014). They used an instrument that asked school directors to
choose one of four scaled options for each sub-indicator (using the 2011 version of the SABER-SAA
rubrics).

                                                  6
Section 3: Quality of Policy Intent

3.1 Methodology

As discussed in Section 2, we adapted the SABER-SAA framework and tools to assess the

quality of SBM systems and policies on SAA in Burkina Faso. We collected laws, decrees,

policy documents, and manuals from relevant central ministries of Burkina Faso in 2013 to

update the information used for the previous SABER-SAA policy assessment that was

conducted in 2011 6. The information was analyzed and scored using a rubric for each of

corresponding policy goals and actions 7 (see Annex 1c for the detailed rubrics). This rubric

allows for country policies scored by each individual policy action to be assigned to one of

four levels of development: 1 (latent), 2 (emerging), 3 (established), or 4 (advanced).

        As in the 2011 assessment, we focused on primary education, 8 which is overseen by

the Ministry of National Education and Literacy (MOE). The MOE coordinates with the

Ministry of Administration and Decentralization in charge of decentralization of educational

resources to communes. MOE also coordinates with the sub-national or de-concentrated

offices in 13 regions, 45 provinces, and more than 350 districts. That is, there are regional

education offices (REO), provincial education offices (PEO), and district education offices

(DEO). Thus, we defined the terms of “sub-national” or “local” authorities as the

6
  The results were published in 2012 (World Bank 2012). See also Annex 1a for the results.
7
  The SABER-SAA policy rubrics were modified by the World Bank in 2013 to reflect various
countries’ needs for benchmarking according to feedback from data collection in various countries,
including Burkina Faso. The five policy goals are the same in the 2011 and 2013 versions of the World
Bank’s SABER-SAA tools, while some policy actions (or sub-indicators) were added and revised for
the 2013 version (as explained in the presentation of the World Bank, Burkina Faso in December 2013).
Annex 1c includes remarks on revisions of the instruments of SABER-SAA. For the update of 2013,
the research team first used the previous tool (2011 version) with additional elements focusing on the
role of school councils, as the team originally saw from in-country feedback seminars that the 2011
rubric had some limitations when addressing this aspect. Meanwhile, the Bank team revised the rubrics
for the 2013 version, including more on school councils, and thus the research team adjusted the study
results to this 2013 version of the World Bank SAA. However, our data cannot adequately cover some
other revised elements, and these are not included in Figure 3.
8
  The formal education system is on a 6-4-3 format for primary, lower and upper secondary education.
See UNESCO/IBE (2010) “World Data on Education Seventh Edition” for Burkina Faso for details,
(http://www.ibe.unesco.org/fileadmin/user_upload/Publications/WDE/2010/pdf-versions/Burkina_Faso.
pdf).

                                                  7
de-concentrated offices or the communes as in the 2011 assessment. Regarding school councils,

while the 2011 assessment defined these as being the APE (“Association des Parents d’Elèves”,

parents associations in French), we defined them as being the COGES (Comités de Gestion

des Etablissements Scolaires, or school management committees in French) in the 2013

assessment to reflect the government’s regulations 9 and the new official guidelines on

COGES, approved in 2013. 10

3.2 Quality of policy intent

Figure 3 provides a snapshot of both the 2011 and 2013 assessment results of the quality of

policy intent calculated by the policy goal indicators of each year’s SABER-SAA rubrics, and

presents the detailed results by sub-indicator for 2013. The figure shows the scores from 1 to 4

for each indicator.

            Overall, the scores on policy goal indicators increased between 2011 and 2013. In

particular, a major change over the two years is observed in respect of Policy Goal 3 on the

roles of school councils (SC), with the scores appearing to be high for 2013. In that year, the

government authorized a new nationwide guideline for SCs, and this guideline justifies a high

score on the policy sub-indicators of 3D, 3E, and 3F (score 4 or 3). The descriptions of

corresponding rubrics on these policy sub-indicators for 2013 are as follows (see Annex 1b for

details):

z    There are “formal institutions, manuals, and mandates for organizing volunteers to plan,

     implement, and evaluate activities” for 3D (score 4);

9
  Arrete conjoint°2013-029/MENA/MATS/MATD/MEF du 27 Mars 2013.
10
   COGES was recognized as the school administration and management body by a 2008 decree, with
the expectation that it would strengthen the management of basic education through local communities’
closer involvement (MEBA 2007). To make the new policy work, JICA has provided technical
assistance through a project called PACOGES since 2009 (JICA 2012b), learning lessons from the
successful nationwide scale-up of COGES in Niger (Honda and Kato 2013). PACOGES has assisted the
Government of Burkina Faso in developing the manuals for COGES organization and functions,
training stakeholders, and monitoring progress in pilot regions (originally 2, and then 4 regions) (JICA
2012b, 2013). Reflecting these pilot experiences, the manual was revised and authorized by the
government as a nationwide official guideline in 2013.

                                                   8
z there are “provisions for regularly scheduled elections of SC members and defined term
limits” for 3F (score 4), “(SC has) legal authority to voice an opinion and legal oversight
on some learning inputs to the classroom” for 3E (score 3); and
z “(SC has) legal standing as an organization, and legal authority to have a voice, but no
legal oversight authority on budget issues” for 3B (score 3).
The guidelines give instructions on how individual COGES are to prepare and
implement school action plans and prepare financial and progress reports. There are no
regulatory restrictions on the scope of financing sources or expenditure items, except for the
basic salary of teachers (or contracting full time teachers). They also define the democratic
organizational structure: the COGES would have two types of members, the first type being
decided by regulation and includes the mayor or her alternate, the president of APE, the
president of AME (mother association), the school director, the teachers’ representative, other
NGO’s representatives, and a union representative. The second type of members are those who
belong to the executive board, which is composed of elected members (president, treasurer,
public communication officer, and girls’ education officer), and the school director who is by
right the secretary general. Elected members are elected by secret ballot every 3 years at a
general assembly (GA). The GA is the supreme body of the COGES, and is composed of all
community members and people related to the school. The GA is in charge of identifying and
prioritizing a school’s issues, assigning direct priority to actions, validating the yearly school
action plan, and adopting the budget of the annual action plan.
Also, at the commune level all schools COGES are federated in a structure presided
over by the mayor called the CCC (Coordination Communale des COGES), whose role is to
reinforce the involvement of local authorities in the management of the education system (see
Figure 4 for organizational structures). Through this structure, the COGES have a direct access
to the mayor and can weigh in on the local authorities’ decisions that impact them. Thus, each
9COGES has a voice in the planning and preparation of non-salary items, either directly in the
school action plan or through the CCC at municipal level. When those items fall under their
action plan, they also have final responsibility for their preparation and implementation.
However when those items fall under other budgets, the mayor has the final responsibility
(thus score 2 for sub-indicator 3A). For personnel management however, there is no legal right
or voice in teacher appointments and removals (thus score 1 for sub-indicator of 3C).
For Policy Goals 1 and 2 on school autonomy in the management of budgets and
personnel, Figure 3 indicates that there are variations among the policy action sub-indicators.
That is, policy scores depend on areas of responsibilities, some of which are decentralized as
described below:
z Legal management authority over the operational budget 11 is at the municipal level,
according to the 2009 decree 12 on transferring government resources for primary
education to communes 13 (justifying score 2 for Policy Action 1A);
z The 2009 decree on decentralization would allow regional or municipal governments
(communes) to deploy teachers within their jurisdiction (justifying score 3 for Policy
Action 2A); and
11
The definition of an operational budget in the SABER SAA data collection tool set is: “The budget
transferred through the government channels for the day-to-day operation of schools, excluding salaries
for teachers and non-teaching staff, and capital costs like school construction. Parental and community
contributions as well as other government expenditure lines can be considered as additional funds.”
12
« Decret n°2009-106/PRES/PM/MATD/MEBA/MASSN/MEF/MFPRE portant transferts des
compétences et des ressources de l'Etat aux communes dans les domaines du présocolaire, de
l'enseignement primaire et de l'alphabétisation. Arrêté conjoint 2011-0007/MEF/MATD/MENA portant
répartition de la somme de dix milliards, trois cent un millions, sept cent cinquante-neuf mille, six cent
quatre-vingt-dix (10,301,759,680) francs CFA, représentant les ressources financières transférées en
2011 aux communes en accompagnement des compétences transférées.
13
The transfer of competences to communes is progressive (art 5 law 0055-2004). The transfer of
competences regarding health, pre-schooling, basic education, alphabetization, youth, culture and sports
must have been effective in 2005 at the latest for urban communes (art 76), and three years after the
creation of the elected municipal council for rural communes (art 77). Since every commune in Burkina
Faso participated in the 2006 election, then all communes (rural or urban) should theoretically have
those competences from 2010 on. The 2009 decree and the associated governmental letters (arrêté)
transfer funds for school materials (not including production of textbooks), utilities, renovation of
buildings, and so on.
10z There is no intention yet to decentralize the budget for teaching staff salaries (justifying
score 1 for Policy Action 1C).
For Policy Action 1D on the legal authority to raise additional funds for the school, the
score is “latent” if this is to be done by the school as an institution, while it is “advanced” if it
is to be done by the COGES for the school. A COGES can “raise additional funds from any
source.” According to the 2007 law, 14 all types of fees (e.g. registration fee) during
compulsory education are abolished. Yet, voluntary participation by community to cooperate
with the government or local government is admitted.
In regard to school grant programs, which would transfer funds directly to the account
of an individual school or school level committee for their operational plans, the Burkinabe
education system does not yet have such program in place. A pilot program that transfers to
school councils a grant fund specific for canteen operation is however being experimented
with (MOE 2012ab). For Policy Action 1E on collaborative budget planning, the score is also
“latent”, as “budgetary decisions are made at the national and sub-national levels.” Even
though COGES can influence commune budgets through their commune level federation
presided over by the mayor (CCC) (MOE 2013, 80-81), there is no obligation for the
commune or the national budget to take COGES plans into account.
For Policy Goal 4 on assessment, Figure 3 shows that scores are high for the existence
of student assessments (Policy Action 4C), as various student assessments exist, such as the
graduation exam, provincial standardized assessment for several grades by trimester,
semi-annual national assessment, and a regional assessment called PASEC (see Table 2). Yet,
for the creation of school assessments for making school policy adjustments (pedagogical,
operational, and personnel), the central level policy intent is still emerging. This policy intends
to share the results with regions, but it is not clear whether the intent is to disseminate the
14
Loi n°013-2007/AN portant loi d'orientation de l'éducation, Article 6.
11results to schools with recommendations for improvement (Policy Action 4D). Policy Actions
4A and 4B on school assessments, their frequency, and their use have been established (score
3). School assessments are done at least yearly by the inspectors of the DEO, using a standard
form for their assessment. On school assessment, the school director is to be given the school
assessment report by the DEO, together with any recommendations for pedagogical and
operational adjustments. However, those are not required to be shared with the public.
Section 4: Quality of Policy Implementation
4.1 Methodology
(a) Data sources
The quality of policy intent at the central level was assessed in the previous section, here we
investigate the current status of policy implementation at the Meso and school levels, and
identify any differences compared to the initial policy intent. From April to May 2013, we
conducted questionnaire-based interview surveys with the various levels of education actors,
including school directors, presidents of school councils and parental associations, the
representatives of mayoral offices, and those of the district education offices, provinces and
regions in Burkina Faso. 15
Our procedures in the selection of samples at each level were as follows. First, among
15
At first, 3 schools that had students in 6th grade were randomly selected in each commune, using the
list of schools available from MOE. Then the team adjusted the number of schools per commune based
on the total number of schools in the area (the team also identified a few additional schools that could
be replaced with the sample schools per commune during the field survey as needed). However, largely
because MOE provided the survey team with the contact information of school directors and
administration officers and the survey team called them before the survey, most of the pre-identified
sample schools were reachable during the visits. The survey reports do not indicate cases where
respondent declined to answer. This research focused on rural areas, which have larger educational
challenges as compared with urban areas, and the share of rural schools is more than 80% in our sample
regions (see PADECO Co Ltd (2014) for details of data used in sampling). We sampled only public
schools, which also account for 80% or more of the total schools in the sample regions. We focused
only on public schools partly because the policy context is different between public and private schools,
and the 2011 World Bank’s SABER-SAA assessment and its tools also focus on public schools. For
SABER, there is a policy domain for engaging the private sector, and the policy assessment for Burkina
Faso is being done, but the results are not yet available (as of 2014).
12the 14 regions of the country, four regions were selected in collaboration with Ministry of
Education officers, based on their share of rural population, their share of public primary
schools, the existence of JICA technical assistance on their school councils, the levels of
learning results, access, and other socioeconomic indicators such as poverty incidence and
population density, as well the security situation. The four regions selected consisted of two
regions supported by PACOGES 1, the Central Plateau and Central East regions, and two
others, the Central West and South West regions (see Figure 5). Second, all of the 14
provincial education offices (PEO) under those four regional education offices (REO) were
selected, and 70% of the communes of each of those provinces were randomly chosen. As a
result, 93 district education offices (DEO) for 90 rural communes (mayoral offices) were
selected. 16 Finally, we sampled 303 public schools in total, by randomly selecting schools that
had students in Grade 6 in each commune. About 12% of the public schools (or 18% of the
public schools with students in Grade 6) in the targeted regions were covered.
While the contents of the questionnaires were different depending on each level of
actor, we asked common types of questions: (i) the implementation status of policies and
official procedures focusing on the policy action indicators relevant to each actor among the
SABER-SAA policy rubrics; (ii) the policy contexts and capacities of each actor in terms of
leadership, budgetary and organizational characteristics, and community characteristics; and
(iii) the actual status and perception of services delivered and their educational outcomes. 17
The datasets of all actors were merged into one whose basic unit of analysis is the
school. In addition, we utilized the MOE’s annual school statistics database, 18 especially the
data on the number of students and textbooks per school. In the next section we overview the
16
In a few cases, two DEOs oversee different schools under the same commune.
17
For details of steps and references used in preparing the questionnaires, see PADECO Co. Ltd
(2014).
18
MOE collects basic statistics from all primary schools at the beginning of every school year, using
the questionnaire (called “ENQUÊTE ANNUELLE”) covering basic school information. MOE also
publishes reports, called “national education statistics” (ANNUAIRE STATISTIQUE DE
L’EDUCATION NATIONAL). For each of these, the research team received the raw data by school
from the MOE.
13status of policy implementation, means of support, education service delivery, and learning
outcomes, using the merged dataset of our survey and MOE’s database.
(b) Two analytical steps
Using the datasets explained above, we examine the following questions about the
relationships between policy intent and policy implementation, and between better policy
implementation and education results, according to the framework of the SABER result chain
explained in Section 2:
(1) What gaps exist between policy intent and implementation? How does policy
implementation differ within the country?
(2) What can be the means for better implementation? Which policy implementation appears
to be more important for a better service delivery? Is better implementation related to
better student learning results and other education outcomes? Which policy
implementation appears to be important to have better results?
For the first set of questions, we prepared descriptive statistics based on the variables
that would enable us to measure the differences between policy intent and implementation and
the degree of implementation among stakeholders such as schools, COGEs and communes. As
we assumed that the policy goal that has improved over the past years more than others (Policy
Goal 3) might show a large difference between policy intent and implementation, and we are
also interested in the role of school councils, we first present the results relating to this policy
goal. After reviewing these descriptive statistics, we discuss the statistical models required to
further analyze the second set of questions (see also Section 4.3.1).
144.2 The difference between policy intent and policy implementation
(a) Policy implementation on the role of the School Council
To what extent has the policy on COGES been implemented? First of all, we find that all the
sample schools in the two PACOGES regions have a COGES, while there is no COGES
actively functioning in the other 2 regions. Next, focusing on the two PACOGES regions, we
outline the degree of policy implementation on COGES and the differences among schools
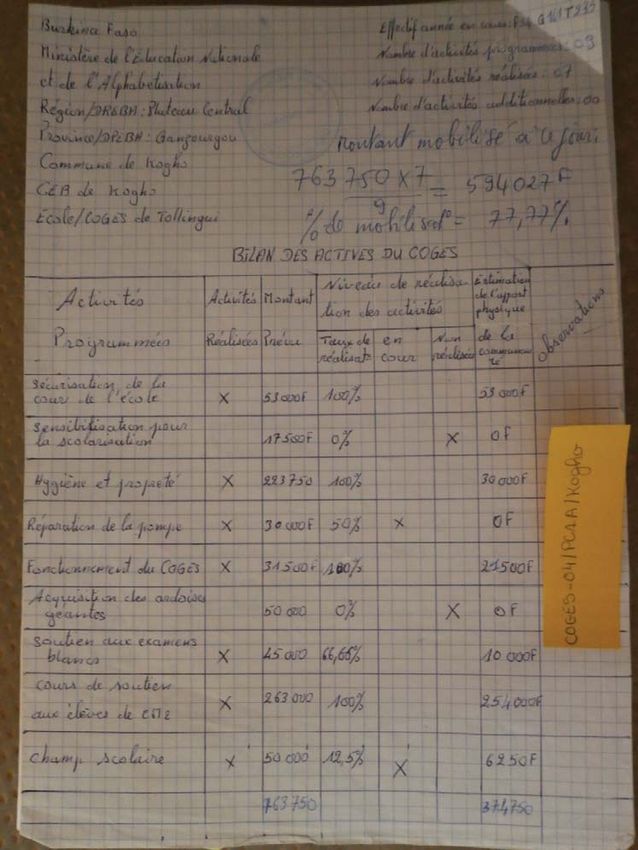
(Table 3). For community participation Policy Action 3D, although almost all of the COGES
have a plan of action, differences appear in terms of the target, the scope of funding sources,
the presence of the progress report or financial report, the number of activities, the amount of
the monetary contribution they mobilized, and the implementation rates of their action plans.
The average number of activities in the action plan is six, and the types of activities also vary,
while many action plans include construction of classrooms, learning materials, mock exams,
supplementary lessons (provided by teachers at schools on the days/hours outside
regular/normal school schedules), and school meals. 73% of school directors responded that
the COGES make progress reports while the rest did not (see Figure 6 for an example). While
the amount of contribution from COGES and APE to school activities also varies by school,
the mean is 391,206 CFA (about 800 USD), or about 7000 CFA per student in Grade 6. For
about half of the COGES (or schools with COGES), the financing source is not only parents
but other community members or the communes. The implementation rate of the plan also
differs, and 58% of schools implemented more than half of what they had planned.
More than 90% of COGESs elected their president and treasurers as intended in the
guidelines relating to Policy Action 3F on transparency in community participation.
Interestingly, a majority of schools also elected the president of their APE (who is also a board
member of the COGES). COGES presidents were mostly elected within the last three years
(2009-2011), and hold the evidence of their investiture (the minutes of general assembly that
elected COGES members). For the year of the survey 2012/13, most COGES also held a
15general assembly at least once and responded that they had prepared a plan in the GA in a
participatory way, although some 20% had not held a GA yet. More than 90% of COGEs have
at least one female COGE board member as intended by the policy.
One interesting area related to the role of COGES is collaborative budget planning
(Policy Action 1E). While the government budget cycle does not yet require communes to
review the COGES action plan in the process, some SDs perceived that their plans were used
by the commune or district education offices. This could be a good sign of the increasing voice
of communities in regular government budget via SC. The proportion is higher for COGES
than for APE, so as expected COGES can enhance the voice of parents and communities
through an increasing institutional involvement.
To strengthen communications among the COGES in each district, and the linkage
between COGES and mayoral offices, there is a new policy to organize CCC or federation of
COGES. 61% of SDs answered that a union (federation) of COGES or APE exists in their
district. It should also be noted that there are differences among stakeholders in the perception
or awareness about the presence of these federations. However, even when district education
offices responded affirmatively on the presence of such federations, the same district’s
mayoral office or school directors might not necessarily respond that it is present. This may be
because the federation is newly established or that it does not have an active relation with the
school level stakeholders and/or with mayoral offices, and thus its presence is not well known.
For the general capacity of stakeholders which could also affect policy implementation,
the differences identified among stakeholders include, for example, the level of education of
school directors and COGES presidents, and their work experiences (Annex 2).
(b) Policy implementation on autonomy
How does policy implementation differ from the policy intent according the opinions of
stakeholders? Table 4 compares the answers of school directors, the DEO, and communes to
16the questions on who has responsibilities for the management of operational budget of
non-textbook materials, and for teacher deployment (Policy Goals 1A and 2A, respectively). In
Burkina Faso, the authority for these issues is supposed to be decentralized to mayoral offices.
While the majority of such offices chose themselves, 37% or 60% of SDs or district education
offices chose “mayoral offices,” respectively.
These variables represent the perceptions of stakeholders, and thus the differences
could affect the understanding and degree of collaboration among them under the policy intent
to gradually transfer responsibilities to communes; a policy allowing responsibilities to be
shared between the central ministry, regional, provincial, and district offices, and communes.
For example, a local newspaper related how a mayor complained about what he perceived to
be a district education office that did not respect his office as he, the mayor, has the final
authority on teachers’ deployment to primary schools in the commune, and was thus entitled to
ignore education office proposals as well as teachers’ protests. 19
(c) Policy implementation on the dissemination of assessment results
Table 5 shows whether schools received the results of student assessment examinations, and
how they used these results. It corresponds to Policy Goal 4. As confirmed in the previous
section, Burkina Faso has student assessment systems, and the results are supposed to be
shared with regional education offices, but the question is whether they are disseminated to
school level as well.
Considering the national graduation examination (CEP) that students take at the end of
Grade 6, about one-third of SDs responded that they had received both results and
recommendations, and 60% of the DEOs responded that their schools had received
recommendations. These responses reflect an implementation status that goes beyond the
19
Source: Le Faso.net Commune de Bondigui : Le maire et des enseignants à couteaux tirés pour les
affectations, December 28, 2011. Accessed July 2014.
http://www.lefaso.net/spip.php?article45587&rubrique14.
17policy intent. The policy intent is not clearly set for the central ministry in relation to
analyzing the CEP results, or making recommendations for pedagogical and operational
adjustments at school level; however, this does not prevent sub-national offices doing so. As a
technical constraint, the central ministry does not have a CEP database at school level. The
data is for each DEO or province. Thus, the ministry cannot analyze the CEP results along
with other school-level data collected in accordance with its mandates, such as annual school
statistics and the teacher database.
For provincial standardized assessments, which are often conducted per trimester, the
pattern is similar. About one-third of SDs responded that schools have received
recommendations, and 60% of DEOs responded that schools have responded to these.
However, regarding the national learning assessment survey (EAS), which is conducted every
two years and targets students of two grades in nationwide representative sample schools
(round 400 schools), a large proportion of SDs did not receive the results, and they do not
appear to know anything about this survey. Thus, if the country improves its way of analyzing
and disseminating results to schools and communities, it may also help individual COGES to
discuss and be more functional in terms of learning achievement.
On the use of the results of examinations, some schools responded they receive the
results with recommendations to be used for pedagogical and operational changes, while
others receive the results only. This difference represents to some extent regional or provincial
efforts, and a new guideline has been developed to clarify the procedure. 20
4.3 Better policy implementation and education results
4.3.1 Statistical models
In the previous two sections, we reviewed the condition of policy implementation and
20
Source: Opinions from participants in the seminar on the interim report held in Ouagadougou in
December 2013.
18educational contexts in Burkina Faso. This section examines policy implementation on school
autonomy, accountability, and participation econometrically, focusing on the roles of school
councils and their linkage to other actors. Based on the analytical framework of the SABER
result chain presented in Section 2, we conducted three analyses: (1) on what variables might
explain differences in the degree of policy implementation regarding school councils; (2) on
how policy implementation is related to quality and quantity of educational services; and (3)
on how policy implementation is associated with the learning outcomes of students.
The first analysis is to examine the factors that explain the differences in the degree of
policy implementation on school councils, in terms of the functionality of the COGES. As the
dependent variable, we mainly adopt the amount of COGES and APE financing contribution
per student of Grade 6 (“SC contributions” hereafter), along with other measures of the degree
of policy implementation. Considering that in Burkina Faso, public schools with school
councils have full autonomy and accountability in relation to these funds, this variable was
assumed to be a representative indicator of the degree of implementation of policies relating to
SAA when focusing on the role of school councils.
The explanatory variables were prepared from the categories below, by considering the
results of descriptive statistics and correlation data (see Table 6 for the list of variables):
z Variables on the implementation of intended procedures of COGES (Policy Goal 3). These
include dummy variables on holding the participatory general assembly, and on having
more than 25% of parents participating in the last general assembly meeting;
z Variables related to policy implementation on autonomy, decentralization, and assessment
(Policy Goals 1, 2 and 4), such as category variables on DEO having a common view with
communes on the implementation of responsibilities over teacher deployment and
purchase of non-textbook materials (an indicator for school autonomy having the decision
making closer to school with decentralized authority, communes), and on school directors
19using the CEP results to make pedagogical, operational, and personnel adjustments for
school (an indicator how assessment results are being used); and
z Other than these variables, we controlled for variables covering the supporting means
related to COGES, such as the frequency of meetings between the DEO and COGES
representatives, the existence of a union of COGES or APE, and the holding of teacher
information sessions by mayoral offices. Variables on other supporting means, such as the
education level and experience of leaderships (of school directors, presidents of COGES,
and DEO chief officers), and variables describing non-policy contexts, such as the
proportion of poor families, and the percentage of parents who speak French, were also
included.
We regressed the variable of SC financing contributions on these explanatory variables
by using Tobit models. This was because 15% of school directors answered that there had been
zero amount of financial contributions; that is, SC contributions are left-censored at zero,
which causes the coefficients of OLS estimation to be biased and inconsistent. We used a
Probit model for the regression of the dummy variable on the implementation, and an OLS
model for the regression of the number of activities.
The second analysis was to examine how policy implementation leads to changes in
the quality and quantity of educational services. The dependent variables are: the total hours of
supplementary lessons in March 2013, the dummy variables covering whether more than half
of Grade 6 students study per day at home by one hour or more, and the amount of distributed
textbooks (see Annex 2b for descriptive statistics). Shortages of textbooks and learning hours
remain important issues for primary education in Burkina Faso (JICA 2011a; Frolich and
Michaelowa 2011). These variables on education services are also assumed to be sensitive to
the degree of policy implementation by the COGES, through their participatory voice and
financial contributions. Thus, key explanatory variables concern policy implementation by the
20COGES, decentralized autonomy for communes, and the use of assessment results. We
controlled for variables relating to supporting means, to policy contexts that could be more
relevant depending on each dependent variable, and non-policy characteristics. Considering
the characteristics of the dependent variables, we used a Tobit model for the regression
analyses of distributed textbooks and hours of supplementary lessons, because these two
variables are left-censored at zero. We also use a Probit model to model the duration of
homework.
The third analysis is to examine the effect of policy implementation on learning
outcomes, measured by the pass rate of the CEP exam at the end of Grade 6. The key
explanatory variables are seen as the policy implementation by the COGES, measured as the
SC’s contribution, which in turn is assumed to have a significant association with the pass rate
of the CEP exam. As for the second analysis above, we also controlled for variables relating to
supporting means and non-policy contexts here. With regard to policy contexts, we included
other variables such as the student to teacher ratio and the qualification of teachers, which are
assumed to be less sensitive to COGES activity in the current situation in Burkina Faso, since
the hiring of contract teachers is not to be done by the COGES. Since the pass rate of the CEP
exam is censored from both sides at zero and 100%, we adopted a two-limit Tobit model.
In all the regression models in this section, we utilized the samples from the two
PACOGES regions, and controlled the fixed effects for the six provinces of those two regions
where deconcentrated education offices are responsible for primary education administration.
We note that the standard errors are clustered at the commune (town) level, which is the
decentralized authority for primary education.
4.3.2 Estimation results
(a) What explains differences in policy implementation on school councils?
As Table 7 shows, SC contributions per Grade 6 student are significantly associated with all
21key indicators of the implementation of the SAA policies, even after controlling for the
contexts of schools (such as the education and experience of the school director, the COGES
presidents and the DEO head), and of the communities.
On the intended procedures of the COGES, variables regarding their participation in
school activities and their transparency, such as holding participatory general assemblies,
having a participation rate of more than 25% of the parents in these general assemblies, and
whether non-parent community members are also included in the assemblies (in addition to
parents), have a positive relation with SC contributions. Setting the improvement of the CEP
pass rate as the target for COGES action plans is significantly related to higher levels of SC
contributions.
Moreover, we found that the SC linkages to the other actors at sub-national level is as
important as anticipated. The frequency of the meetings between the DEO and COGES
representatives has a significant association with this situation. The existence of the union of
COGES or APE is significantly positively correlated to SC contributions. The union of
COGES is led by the mayor of the district, and thus the presence of the COGES union implies
that communes have more information about the schools. As anticipated, a school whose
commune office responded that they have the information on teachers tend to receive more
contributions from the SC. Thus, these results imply that sufficient information sharing
between SC and sub-national actors is essential for better policy implementation by SCs.
Further, better implementation of decentralized autonomy, as measured by the extent
to which the DEO shares a common view with the commune (mayoral office) regarding the
implementation of the commune’s roles, is also significantly related to the amount of SC
contributions. Since the mayor or their representative sits on the COGES board, a better
implementation of decentralization should affect how functional the COGES are.
Better utilization of assessment results is also positively correlated to SC contributions.
A school where the director uses the CEP results with recommendations for pedagogical,
22operational, and personnel changes, tends to have more contributions from the SC. However,
as the majority of school directors receive information about the graduation exams, at least
about the number of students who took and passed it, differences can arise from the way they
review the results and how that knowledge is transformed into solutions and changes.
Table 8 shows the regression results for SC contribution per Grade 6 student when
including the above-discussed explanatory variables in the model. In order to examine the
effect of each explanatory variable on the COGES, we added each of them to the regression
equation one by one (Table 7), and then together (Table 8). The results show that the variables
having significant coefficients include those relating to the general assembly, to views on the
role of communes, and those relating to the union of COGES or APE.
Table 8 also gives the regression results for the other dependent variables that might
capture differences in the degree of functionality of the COGES; including total financing
contributions (not divided by the number of students), and whether the implementation rate of
the action plan is more than 50 percent in columns 2 and 3, respectively. As expected, most
coefficients of the explanatory variables on COGES organizational transparency and
participatory roles are estimated to be positive, but a few become statistically insignificant
when compared with the estimation results in column 1.
The analyses indicate that the SC contribution per Grade 6 student, which exhibits
more continuity in its variation, can be a more representative indicator. While the
implementation rate of their action plan is also important in monitoring the capacity of each
COGES, it might have a mixed implication. For example, a COGES which prepared an
ambitious plan of activities and implemented only half of it may have eventually implemented
a similar degree of activities per student, when compared to another COGES which
implemented 100% of a more modest plan.
23(b) How does policy implementation link to more textbooks and learning hours?
As shown in Table 9, SC contributions are significant in almost all the regression results of
using the hours of supplementary lessons, study hours at home, and the number of textbooks
per student, as dependent variables. A better implementation of SC policies can be related to
higher levels of motivation, the commitment of households and schools to the time of learning
by children through supplementary lessons, as well as to studying at home. The table also
shows that the results do not change when each model is estimated without the two variables
relating to assessment and decentralization.
The total hours of supplementary lessons are also significantly related to a common
view on decentralized management between communes and district education offices (column
2). As assumed, decentralization to mayoral offices could reduce the distance between
authorities and beneficiaries such as parents and communities surrounding the schools, and
increase the incentives for schools to improve their services. The effect of school directors
having records of teacher absence and teachers submitting absence notices to communes tends
to be positive, but it is not statistically significant. Schools which are more accountable for
recording and reporting absences may be more likely to ensure the full implementation of
teaching hours through supplementary lessons.
For home study hours, the variable of the student assessment utilization (CEP results)
indicates a significant and positive association, while the variable on representing
decentralization has a positive but not significant association (see columns 6 to 8 of Table 9).
In the case of textbooks, these two variables also tend to have a positive but not significant
association (see columns 10-12 and 14-16 in Table 9). The procurement of textbooks is
currently centralized, and thus it is not surprising to find a weak relationship of this with
decentralization, while community contributions ensure that the books reach the students. In
fact, SC contributions have a significant relationship with this variable, and the coefficient of
the variable on the receipt of textbooks signed by a school director along with the president of
24You can also read