DETECTION OF HBA1C IN BLOOD USING DIODE LASER (491) NM
←
→
Page content transcription
If your browser does not render page correctly, please read the page content below
Sys Rev Pharm 2021;12(1):700-704
A multifaceted review journal in the field of pharmacy
Detection of HbA1c in Blood Using Diode Laser (491) nm
Layla M.H. Al-ameri1, Rawaa A. Faris1 , Sara J. Belal2
1Institute of Laser for Postgraduate Studies, University of Baghdad, Iraq
2Department of Laser and Optoelectronics Engineering, University of Technology, Baghdad, Iraq
Corresponding Author: Rawaa A. Faris E-mail: rawaa@ilps.uobaghdad.edu.iq
ABSTRACT
Laser radiation is widely used in several applications like medicine, biology and Keywords: HbA1c; Diode Laser; diabetes; LMA-10 Photonic crystal fiber
industry. Laser biosensor is one of the tools in the biological applications. A laser
biosensor is designed with different lengths of solid core photonic crystal fibers Correspondence:
(LMA-10) (1.5cm, 1cm and 0.5cm) to be used for different tests. For the blood Rawaa A. Faris
test, the highest sensitivity of 153 ABS/RIU was found for the (1.5cm) length. Institute of Laser for Postgraduate Studies, University of Baghdad, Iraq
Moreover, the biosensor was used for the detection of HbA1c for the diagnosis E-mail: rawaa@ilps.uobaghdad.edu.iq
of diabetes being a recognized valuable tool in diabetes management. Blood
samples been taken from healthy people and others suffering from diabetes
people. The results showed that the presence of diabetes led to increasing the
output intensity of the laser beam as a results of enhancing the nonlinearity .
The sensitivities of diabetes is 28.934 ABS/ RIU.
INTRODUCTION important component in blood of diabetes patient and is
Parts of the laser biosensor architecture are less costly, used to track long-term glycemic regulation and to assess
more reliable, and more precise than test strips. There the risk of developing complications of diabetes(7).This
are a range of biosensors that use methods of laser- work aims to construct of a laser biosensor based on in-
based-detection, such as SPR , waveguides, optical fiber, line Mach-Zehnder interferometer (Micro-Holes
etc. In many fields, laser-based biosensors, including Collapsing) using a solid core photonic crystal fiber
immunoassays and drug screening, play an important (LMA-10). The laser biosensor is used for Sensing for
role because of their high sensitivity and accuracy(1). By HbA1c concentration measurement.
using optical fibers, most important laser-based- Sample Collection:
detection approach utilized in many instruments coud be The HbA1c concentrations were estimated by using (4
miniaturized. In biosensors, the laser detection method ml) of fasting venous blood and then performed by Mach-
depend on evanescent waves is usualy used(2). Laser Zehnder interferometer (Micro-Holes Collapsing) using a
biosensor has become very useful instruments in solid core photonic crystal fiber (LMA-10).
different fields in the last years, like pharmaceutical Optical Properties Measurments:
research, analytical biochemistry, and food- Using a UV-Vis spectrophotometer, the transmission
environmental expermints(3), and diagnostic methods(4). spectrum was collected. By the z-scan measurments
In applications such as disease observations, drug presented by Sheik Bahae et al.(8), the nonlinear optical
detection, pollutant detection, disease by tests were carried out. As aresult of the occurrence of
microorganisms and biomarkers which are markers of a optical nonlinearity, the Z-scan technique relies on the
disease in body fluids (urine, saliva, blood, sweat), spatial beam profile and reduction of the Gaussian beam
biosensors are used(5). in the far-field. In Z-scan experiment, the nanosecond
HbA1c is a small part of adult hemoglobin, that is formed SHG-Nd: YAG laser was utilized. With a beam diameter of
from hemoglobin and glucose slowly and non- < 1.5 mm, a beam divergence of 0.711 mrad and a
enzymatically. HbA1c is produced over the lifetime of the maximum energy of 120 mJ, this laser has a Gaussian
erythrocyte cause erythrocytes are permeable to glucose; profile. The intensity of the laser also can be calculated, at
the rate of formation of its is proportional directly to the the focal point being around 17 GW/cm2. For closed
amount of ambient glucose(6). The quantities of HbA1c aperture measurments, an aperture with a pinhole size
therefore give a 'glycemic past' of the past 120 days, was set.The schematic diagram of the Z-scan technique is
which would be the average life of erythrocytes. Whilst depicted in Fig.1. The alteration in the transmitted laser
also HbA1c reflects glycemia over the previous Twelve intensity is verified utilizing an optical detector (RJ-7610)
weeks, it is weighted to the most recent Four weeks. as a function of the sample location.
Blood glucose and blood or urine ketone monitoring
provide helpful info for day to day diabetes management,
where HbA1c gives crucial data on average glycemic
regulatory
oversight. It is an
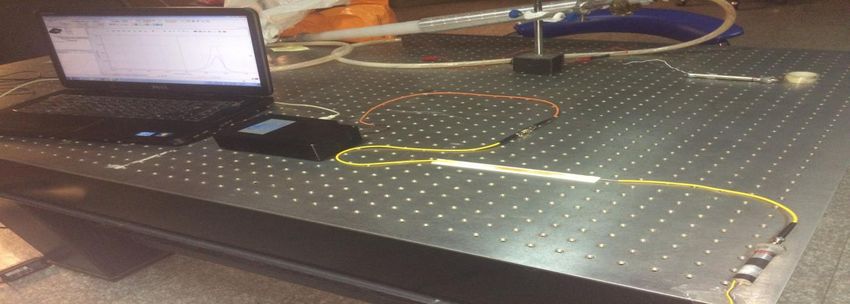
Fig.1: Z-scan experimental setup of z-scan.
700 Systematic Reviews in Pharmacy Vol 12, Issue 1, January 2021Al-ameri et al. /Detection of HbA1c in Blood Using Diode Laser (491) nm
Biophotonic Sensor Set-up: refractive index of the biological sample. The light source
In-Line PCF Mach-Zehnder Modal Interferometer with been used in this experiment is green laser ( SHG Nd:YAG
Mico-Hole Collapsing: Micro-hole collapsing is a simple laser) with λ=532nm and output power=12.2nw which is
kind of MZI because its fabrication only need to cleave shown in figure (2).The beam of the light emitted from
and splicing the optical fiber(9). the LMA-10 photonic the laser source toward the spectrum analyzer
crystal fiber spliced using fusion splicer type (FSM 60 S) transmitting within the PCFs, in which the blood sample
to the SMF-28. Collapsing technique can be implemented exists above. The detected signal could be obtained from
in this sensor. PCF sensor used with length 1.5cm because the spectrometer.
it proved to be the most sensitive sensor for changing the
Computer connected to
spectrometer
Spectrometer (HR-2000)
osensor Set-
up Fo
PCF (LMA-10) (L=1.5cm)
Green laser
(λ=532nm)
Fig. 2. The experimental setup of biophotonic sensor
RESULTS AND DISCUSSION the suitable wavelength of laser source for the detection
Optical properties of Blood Samples: set-up. Figure (3) show the absorption spectra for the
The absorption spectra for blood samples are measured blood samples.
using (T60 UV-VIS-Near IR) spectrophotometer to select
Figure (3): Absorption spectrum for normal blood sample.
By using the closed-aperture Z-scan experiment, the
where is the intensity of laser beam at focusing
nonlinear refractive index(n2) alterations can be
estimated, when the blood sample is moved along the z (Z=0), and means to the effective length inside the
and the transmitted intensity is reported in the far-field sample which is given by(9):
via an aperture. The normalized transmittance (Fig.4) is
plotted against the approximate z sample position for the ……………(2)
focal plane. The sign of the nonlinear refractive index n2 where L is the geometrical length of blood sample. The
relating to self-focusing or defocusing, where the
term means phase shift, and it is calculated by(9,10):
signature of the sample can be shown, is taken from this
plot. The sample generates both the focusing and the
defocusing in the laser beam, depending on the nonlinear
refraction of the matter. By using equ.(1) (n2 ) calculated ……………(3)
(9):
is the transmittance difference between the
maximum value and the minimum values. The resulting
behavour of the closed aperture Z-scan are shown in
…………… (1) Fig.4. From these measurements, blood samples are
found to be self-focusing material.
701 Systematic Reviews in Pharmacy Vol 12, Issue 1, January 2021Al-ameri et al. /Detection of HbA1c in Blood Using Diode Laser (491) nm
1.3
1.2
1.1
1
Transmittance
0.9
0.8 patients blood"
normal blood
0.7
0.6
0.5
0.4
-60 -40 -20 0 20 40 60
Z (mm)
Fig.(4): closed aperature z-scan
An open-aperture Z-scan experiment is measured by In addition, the theoretical fitting is carried out on the
removed the aperture in Fig.4; thus the transmitted beam basis of the nonlinear equation of propagation concerning
enters the photodetector after passing the blood sample. two-photon absorption (2PA) or the saturable absorption
For the blood samples, the normalized transmittance is given by(9):
plotted against the z-location of the sample shown in
Fig.5. The nonlinear optical response of the blood sample
to the light beam was confirmed by the occurrence of a
peak or a valley in an open aperture(11). By fitting the
experimental data using the following equ.(4) (9), the ……………………..(5)
magnitude of the nonlinear absorption coefficient can be
calculated:
…………………….(6)
where the intensity dependent absorption, and
………….(4) is the saturation intensity (9).
0.88
0.87
0.86
transmittance
0.85 normal blood
0.84 patients blood
0.83
0.82
0.81
-60 -40 -20 0 20 40 60
z(mm)
Fig. 5: open aperature z-scan
The open-aperture Z-scan curves for samples excited at
an energy of approximately 120 mJ are shown in Fig.5.
With two photon absorption or free-carrier absorption, ………………..(8)
the reverse saturable absorber effect can be considered. The imaginary part of third-order susceptibility:
The third-order susceptibility results of the blood
samples. Table 3 illustrates the measured effects. The
susceptibility of the 3rd is determined directly from the ……………….(9)
following equation: The (real and imaginary) parts of third order nonlinear
susceptibility have been calculated as about 10-10 esu and
……….(7)
where, 10-9 esu, respectively. So, the total is in the order of
The real part of third-order susceptibility: 10-9 esu, as presented in Table 1.
702 Systematic Reviews in Pharmacy Vol 12, Issue 1, January 2021Al-ameri et al. /Detection of HbA1c in Blood Using Diode Laser (491) nm
Table1: The nonlinear properties of the normal and patients blood sample.
Samples
(cm2/W) (cm/W) (e.s.u.)
0.0551 4034.28 3.9*10^-9
Patients blood sample
0.0393 3434.28 1.6*10^-9
Normal blood sample
Biophotonic Sensor Results: biosensor for sensing blood sample with different HbA1C
The laser biosensor with (1.5cm) PCF length and with concentration can be shown in fig.(6). The values of Hb
532nm wavelength is used to measuring the Hb concentration have been known by the blood picture
concentration. Different blood samples with different Hb examination in laboratory of pathological analyzes. The
concentration had been taken from several people. refractive indices of different values of Hb concentrations
Transmission spectra of 1.5cm LMA-10 PCF laser are shown in table (2).
Fig. 6. Transmission spectra of 1.5cm LMA-10 PCF laser biosensor for sensing blood sample with different HbA1C
concentration
Table 2. Represented the optical response for different HbA1C concentration.
N0. Of sample HbA1C concentration % Central wavelength nm Wavelength shift
|Δʎ=ʎair-ʎsample|
1 6 491.0690622 0.00142
2 12 491.0692908 0.003708
CONCLUSION refraction and absorption which the competition of self
In summary, the linear, and nonlinear optical responses focusing and self-defocusing with saturable and reverse
of normal and patients blood samples have been saturable absorption have been studied.
investigated using spectrophotometer, and Z-scan
techniques. From these studies, the samples reveal an ETHICAL CLEARANCE
nonlinear behaviour, broad optical absorption peak The study have the acceptance of Minstory of Health in
within the wavelength region of 300–900 nm, with a high Iraq, Institutional Human Ethics Committee.
nonlinear optical response. blood behaves as nonlinear
703 Systematic Reviews in Pharmacy Vol 12, Issue 1, January 2021Al-ameri et al. /Detection of HbA1c in Blood Using Diode Laser (491) nm
CONFLICT OF INTEREST
There were no conflicts of interest.
SOURCE OF FUNDING
Authors declared that a self-fund have been utilized for
this research.
REFERENCES
1. Shriver-Lake LC, Breslin KA, Charles PT, Conrad DW,
Golden JP, and Ligler FS .Detection Of Tnt In Water
Using An Evanescent-Wave Fiberoptic Biosensor .
Anal. Chem.1995; 67: 2431–2435.
2. Dhadwal HS, Kemp P, Aller J, and Dantzler
MM.Capillary waveguide nucleic acid based
biosensor. Analytica Chimica Acta.2004; 501(2):
205–217.
3. Ciminelli C, Campanella CM, Dell’Olio F, Campanella
CE, and Armenise MN.Label-free optical resonant
sensors for biochemical applications.Progress in
Quantum Electronics. 2013; 37( 2): 51–107.
4. Banerjee A., Mukherjee S, Verma RK, Jana B, Khan TK,
Chakroborty M, Das R, Biswas S, Saxena A, Singh V,
Rajput RS, Tewari P, Kumar, S Saxena, Ghosh AK,
John J, and Gupta-Bhaya P.Fiber optic sensing of
liquid refractive index.Sensors and Actuators, B:
Chemical. 2007; 123(1):594–605.
5. Zhang X, Ju H, and Wang J. Biosensors and Their
Biomedical Applications. J. Electrochemical Sensors .
2008; 53( 9).
6. Prasad PN. Introduction to Biophotonics. Optical
Biosensors J. 2004; 356: 311–356.
7. Zhang Y, Zhang B, and White HS.Electrochemistry of
nanopore electrodes in low ionic strength solutions.
Journal of Physical Chemistry B.2006; 110(4):1768–
1774.
8. Sheikbahae M, Said AA, Wei TH, Wu YY, Hagan DJ,
Soileau MJ and Vanstryland EW.Z-Scan – A simple and
sensitive technique for non-linear refraction
measurements.Spie - Int Soc Optical Engineering,
Bellingham;1990.
9. Belal Sara J, Alameri Layla M , Rashid Fareed F and
Mansour Tahreer S, Laser Biosensor as for
Pregnancy Test by Using Photonic Crystal
Fiber.International Journal of Medical Research &
Health Sciences.2019; 8(2): 41-49.
10. Rawaa A Faris, Zainab F Al-Bawi; Optical Properties
for Prepared Silver Nanocomposite. 1st edition LAP
LAMBERT Academic Publishing;2017.
11. Rawaa A Faris, Zainab F Mahdi, Mohammad DAH.
Immobilised Gold Nanostructures on Printing Paper
for Lable-Free Surface-enhanced Raman
Spectroscopy.IOP Conference Series: Materials
Science and Engineering.2020;871(1):012- 019.
704 Systematic Reviews in Pharmacy Vol 12, Issue 1, January 2021You can also read