Determinants of U.S. passenger car weight
←
→
Page content transcription
If your browser does not render page correctly, please read the page content below
Int. J. Vehicle Design, Vol. x, No. x, xxxx                                         1

Determinants of U.S. passenger car weight

        Donald MacKenzie
        Massachusetts Institute of Technology,
        77 Massachusetts Ave.,
        Cambridge, MA 02139, USA
        E-mail: dwm@mit.edu
        *Corresponding author

        Stephen Zoepf
        Massachusetts Institute of Technology,
        77 Massachusetts Ave.,
        Cambridge, MA 02139, USA
        E-mail: szoepf@mit.edu

        John Heywood
        Massachusetts Institute of Technology,
        77 Massachusetts Ave.,
        Cambridge, MA 02139, USA
        E-mail: jheywood@mit.edu

        Abstract: After a precipitous drop from 1976-1982, the weight of
        U.S. passenger cars has grown steadily. This paper examines multiple
        conflicting influences on vehicle weight in two categories: technological
        changes that reduce vehicle weight and improvements in functionality
        that, ceterus paribus, add to vehicle weight. The widespread adoption
        of unibody construction, lightweight materials and smaller engines have
        been offset by growth in vehicle size and feature content. The best
        estimates from this work indicate that new features and functionality
        would have added at least 250 kg (550 lbs) to the weight of the average
        new car between 1975 and 2009, if not for offsetting improvements
        in technology. Over the same period, it is estimated that alternative
        materials, more weight-efficient vehicle architectures, and reduced
        engine sizes have taken 790 kg (1,700 lbs) out of the weight of the
        average car. These observable influences do explain the full extent of
        the drop and subsequent growth in weight, suggesting that substantial
        non-observed technological improvements were made from 1976-1982,
        and that unobserved improvements in areas such as crashworthiness
        and NVH have added substantially to vehicle weight in the past two
        decades.

        Keywords: weight; lightweighting; materials; unibody; features.

Copyright c 2012 Inderscience Enterprises Ltd.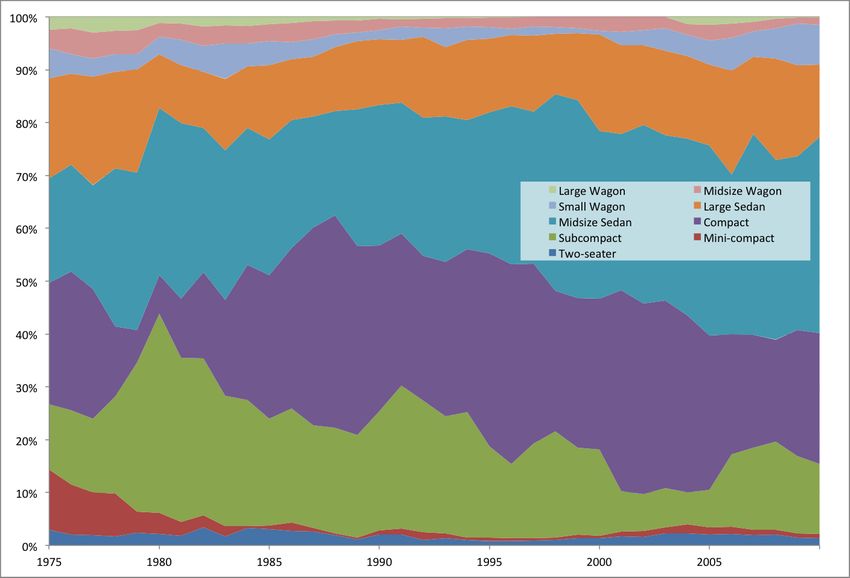
2       MacKenzie et al.

        Reference to this paper should be made as follows: MacKenzie et
        al. (xxxx) ‘Determinants of U.S. passenger car weight’, Int. J. Vehicle
        Design, Vol. x, No. x, pp.xxx–xxx.

        Biographical notes: Donald MacKenzie is a PhD candidate in
        the Engineering Systems Division at the Massachusetts Institute of
        Technology (MIT). His research focuses on measuring rates of advanced
        technology adoption and their relationship to government policies in
        the light-duty automotive sector.

        Stephen Zoepf is a PhD student in the Engineering Systems Division
        at MIT, where his work examines rates of deployment of new
        technologies, as well as prospects for new models of vehicle ownership.
        He previously worked in Accessory Development Management and
        Product Development roles for BMW and Ford.

        John Heywood is Professor of Mechanical Engineering and Sun Jae
        Professor Emeritus at MIT. He is the author of more than 200
        publications and five books on automotive technologies and engines.

1 Introduction

Between the late 1970s and the early 1980s, something remarkable happened to the
cars sold in the United States: they shed more than 450 kg (1000 lbs) from their
average curb weight. Even more remarkably, this 25% weight reduction occurred
in only six years (and most of it in just four). Today, after nearly a decade of rising
fuel prices and with Corporate Average Fuel Economy (CAFE) standards poised
to jump sharply, the auto industry is once again looking to cut dramatically the
weight of new vehicles. Ford has stated a goal of cutting 340 kg (750 lbs) off its
vehicles by 2020. Renault and PSA Peugeot Citroen have established a goal of
cutting 200 kg (440 lbs) by 2018, while Hyundai planned in 2010 to cut its average
vehicle weight by 10% (150 kg or 330 lbs) over five years. One goal of this work,
therefore, was to take a retrospective look at the specific changes that permitted
the dramatic weight reductions that occurred between 1976 and 1982.
    Following its rapid decline, the average weight of a new U.S. car remained
essentially unchanged until the late 1980s, at which point it began to rise steadily,
a trend that persisted until quite recently. A second objective of this work was
to examine why weight increases resumed despite continued growth in the use of
weight-saving technologies.
    The general patterns described above were observed for both cars and light
trucks. However, cars showed a more dramatic weight decrease in the early years,
while trucks underwent a steeper increase in the later years. The focus of this
work is on cars exclusively rather than light trucks, for several reasons. First, cars
showed a more dramatic decline in weight than did trucks in the late 1970s – early
1980s. Second, some key data sources were more readily available for cars than for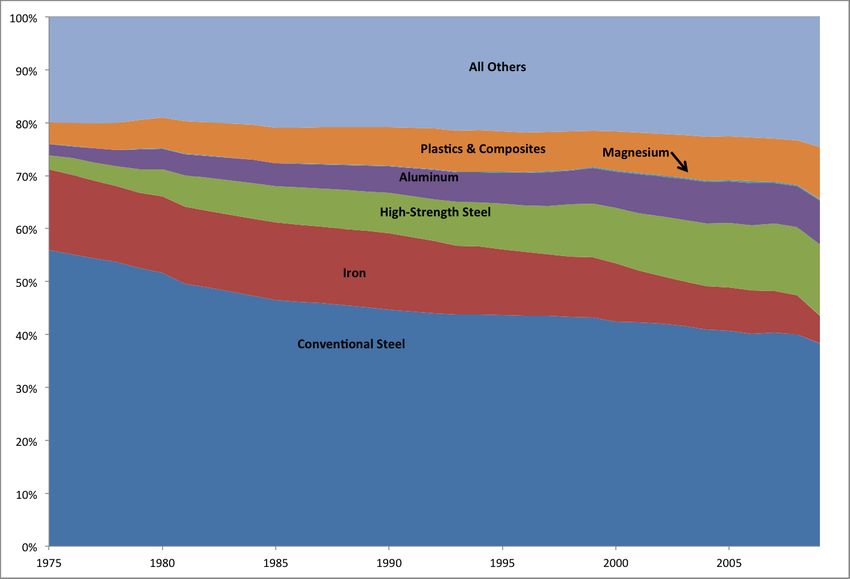
Determinants of U.S. passenger car weight                                   3
Figure 1   U.S. average vehicle weights since 1975

trucks. Finally, cars have remained fairly well defined as a class of vehicles over
time, whereas the types of roles fulfilled by trucks have changed considerably over
the last 35 years, in particular with the advent of the minivan, SUV, and crossover.
    Changes in curb weight are brought about by two fundamentally opposing
forces. Improvements in vehicle capability, such as higher performance, larger size
or carrying capacity, and greater levels of equipment add weight to a vehicle, while
advances in materials, design and manufacturing technologies remove weight from
a vehicle.
    This analysis incorporates estimates of the above sources of weight increase
and decrease that are observable (vehicle size, architecture, features, engine size,
material content) using a bottom-up analysis that estimated the contributions to
changes in average weight of various technologies, features, and vehicle size classes.
First, the effects of weight-saving technologies on the weight of an individual car
were estimated from model-level data and from the literature. Second, the weight-
increasing effects of adding features and changing car classes were estimated.
Finally, these individual-level estimates were aggregated into overall effects on
average vehicle weight based on the changes in market penetration of the various
technologies and features.

2 Weight reduction: Technological improvements

Weight-reducing effects were estimated for both major architectural changes and
for the incremental replacement of traditional steel and iron with lighter and
4 MacKenzie et al.
stronger alternative materials. A broader definition of weight-reducing technology
would include myriad other advances in engineering, design, and manufacturing
practices that permit materials to be used more effectively in building vehicles,
but these sorts of technologies were not represented in the data used in this work.
2.1 Major architectural changes
New cars in the United States underwent large architectural shifts between 1975
and 1990 that contributed substantially to reductions in weight. In 1975, about
half the cars on the market in the U.S. used unitized body (unibody) construction,
and fewer than one in 10 were front-wheel drive. By 1990, 85% were front-wheel
drive and 95% used unibody construction.
Unibody construction
Unibody construction reduces weight by eliminating the traditional frame and
integrating its structural functions into the vehicle’s body shell. Data compiled by
Audatex North America indicate that the overwhelming majority of cars offered
in the U.S. since 1975 have used either unibody or body-on-frame construction.
In addition, a small number of cars have used space frame construction, which
employs a 3-dimensional structure of welded tubes to which non-structural body
panels are attached, primarily in low production high performance cars. A
few others have used a mixed, unibody-on-frame construction that incorporates
elements of both unibody and body-on-frame construction.
Estimates of the weight savings from unibody construction vary widely.
Dupnick and Graham (1996) suggested a weight difference of more than 450 kg
(1000 lbs) between unibody and body-on-frame cars, while a 1970s case study from
Ford attributed only 87 kg (192 lbs) of weight reduction to the switch from body-
on-frame to unibody (Gutherie, 1978).
In this work, the weight reduction due to switching from body-on-frame to
unibody construction was estimated by creating matched sets of unibody cars and
comparable body-on-frame cars using Mahalanobis matching. Size, transmission,
drive, and model year data were obtained from a database maintained by the
U.S. Environmental Protection Agency (U.S. EPA). Data on construction type by
model and year were provided by Audatex North America, and were merged with
the EPA database. The matched sets of vehicles were created by matching unibody
cars with body-on-frame cars that had the same transmission type and drive
type, similar interior volume (within 5 cubic feet or 0.14m3 ), and were of similar
vintage (within 2 model years). The two matched groups had identical fractions
of transmissions and drive types, and were very well balanced on model year and
interior volume. The difference between these groups indicated that the average
unibody car weighs 280 kg (616 lbs) less than a body-on-frame car with the same
drive type, transmission type, and size, from the same model year, would weigh. A
similar analysis indicated that the average space frame car weighs 156 kg (344 lbs)
less than a comparable unibody car would, and that cars using unibody-on-frame
construction do not differ significantly in weight from comparable unibody cars.
These results are summarized in Table 1.
A potential source of bias in these estimates is the possibility that vehicles
employing more advanced construction techniques may also tend to make greaterDeterminants of U.S. passenger car weight 5
use of alternative materials. Such as bias would lead to inflated estimates of
the weight savings associated with advanced construction techniques, but data
on materials composition were not sufficient to support an exploration of this
possibility.
Table 1 Estimated differences in construction type.
Comparison Relevant Estimated Standard
Group Difference (kg) Error (kg)
Construction
Unibody vs. Body-on-Frame Unibody cars -280 5
Space Frame vs. Unibody Space frame cars -156 19
Unibody-on-Frame vs. Unibody Unibody-on-Frame cars -39 35
Drive
FWD vs RWD FWD cars -296 6
Front-wheel drive
A second major architectural change in U.S. cars is the transition from rear-
wheel drive to front-wheel drive. Compared with rear-wheel drive, front-wheel
drive yields both a direct weight reduction in the drivetrain, and an indirect weight
reduction due to improved packaging of the drivetrain. Eliminating the need for
a tunnel running the length of the vehicle allows for greater interior space, and
so the exterior dimensions of the vehicle (and thus weight) can be reduced while
maintaining interior space.
The weight effect of front-wheel drive relative to rear-wheel drive was estimated
by matching front-wheel drive vehicles with rear-wheel drive vehicles that had
the same transmission type and construction type, similar interior volume (within
5 cubic feet or 0.14m3 ), and were of similar vintage (within 2 model years).
The matched groups had identical fractions of different construction types and
transmission types, and were very similar in average interior volume and model
year. Based on the different between these groups, it was estimated that a front-
wheel drive car weighs an average of 296 kg (653 lbs) less (standard error: 6
kg) than a rear-drive vehicle with the same transmission type, construction type,
interior volume, and model year.
Engine cylinder counts
During the period of this analysis engine technology has matured in numerous
ways, allowing manufacturers to extract more performance from a given engine
mass. These changes are partly reflected in materials analysis discussed later:
newer engines more commonly use aluminum blocks and heads than in 1975,
and ancillary equipment (intake manifolds and accessories) are increasingly
manufactured from composite materials.
This analysis attempts to quantify the improved power density, less materials
changes, by assessing the mass impact of changes in engine cylinder counts as a
proxy for materials-neutral power density. Nearly all production cars during this
timeframe use 4, 6 or 8 cylinder engines—balanced configurations for which most6 MacKenzie et al.
production and reliability issues have been resolved. A few vehicles use 3, 5, 10, 12
and 16 cylinder engines in limited production.
Using a matching process that holds constant for vehicle model, model year,
body style and transmission type, this analysis identified an average decrease in
weight of 64 kg (142 lbs) by decreasing from 8 to 6 cylinders, and an average
decrease of 67 kg (147 lbs) by decreasing from 6 to 4 cylinders.
2.2 Alternative (lighter / stronger) materials
Traditional low-carbon steel and iron now make up less than half the weight of
a new vehicle, as they are increasingly displaced by alternatives such as high-
strength steel, aluminum, plastics, and magnesium. Because the substitution of
alternative materials into a vehicle’s design is strongly dependent on the demands
of the specific application in question, estimating a single figure for the amount of
weight saved by these materials is difficult. Nevertheless, it is helpful to generate
some rough approximations based on the properties of different materials and
reports in the literature. Cheah (2010) and Wohlecker et al. (2006) provide
relationships for estimating the weight ratios of parts made with alternative
materials to those made with conventional materials, for a variety of generic load
cases. These provide a useful starting point for estimating the weight reduction
potential of various alternative materials. In addition, rules of thumb and case
studies of vehicle designs using alternative materials have been reported by a
variety of authors. The weight-saving characteristics assumed for key materials are
summarized in Table 2 and more detailed discussions of the assumptions for each
material are found in the following sections.
Table 2 Comparison of material performance differences.
Material Relative Weight Weight Reduction
Savings (fraction of Potential, P (kg
weight saved by replacing conventional material
conventional steel or iron displaced per kg advanced
with advanced material) material)
Conventional Steel 0% 1.0
Iron 0% 1.0
High-Strength Steel 23% 1.3
Aluminum 45% 1.8
Magnesium 60% 2.5
Plastics & Composites 50% 2.0
High-strength steel
Rule-of-thumb relationships like those mentioned above, when used with typical
values for materials properties, indicate that parts made from high-strength steel
(HSS) can be expected to weigh between 0 and 25% less than a conventional
steel part, depending on the application. Salonitis et al. (2009) estimated a 10-
30% weight reduction from using advanced high-strength steels, and Roth et al.Determinants of U.S. passenger car weight 7 (1998) reported an advanced steel unibody weighing 25% less than conventional unibodies. Das et al. (1997) assumed that high-strength steels could reduce weight by 50% relative to conventional steels, but the rationale for this high value was unclear. A particular challenge in estimating a weight reduction potential for high- strength steel is that there is such a broad range of grades available, with widely varying properties. For purposes of this work, with its focus on assessing weight reduction to date, it was assumed that each kg of high-strength steel replaced 1.3 kg of conventional steel (a 23% weight reduction). Aluminum Rules of thumb based on generic load cases suggest that substituting aluminum for conventional steel can reduce weight by up to 70%, with a 50% reduction predicted in many applications. The trade press has noted that the greatest concentration of automotive aluminum use is in engines, and that aluminum engine blocks weigh half as much as iron blocks (Murphy, 2006). Stodolsky et al. (1995) estimated that in engine applications, aluminum reduced cylinder head weight by 50% and block weight by 40%. They also reviewed a number of studies and concluded that substituting aluminum for steel in the body reduces weight by about 40-47%, even when “the design of the vehicle is not completely optimized for aluminum manufacture.” Mayer et al. (1994) concluded that a 45% reduction in weight for the body-in-white was possible by substituting aluminum for steel in a BMW 3- series. Das et al. (1997) assumed that substituting aluminum for steel and cast iron delivers a 45% weight reduction, while Carle and Blount (1999) estimated a 40% reduction in weight relative to steel in automotive body applications. Although generic load cases suggest that replacing steel with aluminum can reduce weight by as much as 70%, most of the (considerable) literature on the topic suggests that a value of around 45% is more realistic(i.e. that each kg of aluminum can replace 1.8 kg of conventional iron or steel)). The latter was the value assumed in this work. Magnesium Magnesium still represents a very small fraction (0.3% in 2009) of automotive materials usage, and fewer estimates of its weight reduction potential have been reported. Based on generic load cases, it is estimated that magnesium can reduce weight by up to 70% compared with conventional steel or iron. Luo (2002) calculated savings as high as 80% for some wrought magnesium alloys. Das et al. (1997) assumed that substituting magnesium for steel and cast iron would deliver a 67% weight reduction. In this work, it was assumed that each kg of magnesium replaced 2.5 kg of conventional steel or iron (a 60% reduction). Plastics & composites Estimating weight reduction potential for plastics and composites is particularly difficult because of the wide range of materials included in this category. However, some rough calculations with typical ranges of values for materials properties indicate that weight reductions in excess of 80% could be possible, relative to conventional steel or iron. For example, Luo (2002) estimated a weight reduction potential of 35-70% for polycarbonate/ABS based on generic load cases. Das et al.
8 MacKenzie et al.
(1997) assume a 30-60% weight reduction from substituting composites for steel.
The American Chemistry Council (ACC, 2011) has estimated that each kg of
plastics and composites replaces 2-3 kg of other materials (a 50-67% reduction).
A report commissioned by Plastics Europe (Pilz et al., 2005) concluded that each
kg of plastic replaces an average of 1.5 kg of heavier material (a 33% reduction in
weight), but found reductions of up to 75% in some components. In the present
analysis, it was assumed that each kg of plastic or composite has displaced 2 kg of
traditional steel or iron (a 50% weight reduction).
2.3 Other technological improvements
In addition to major architectural changes and increased use of alternative
materials, several other sources of technological improvements may have
contributed to weight reductions in new cars. Improvements in manufacturing
processes and technologies, tighter tolerances, and the like may enable the
production of parts that are more precisely designed to use material only where it
is needed.
Concurrently, improvements in engineering methods and the availability of
tools such as finite element analysis and computer-aided engineering may have
enabled the design of parts and systems that make more effective use of materials,
better optimizing component designs and interactions. There is clearly also the
possibility of synergies between these two sets of improvements. The contributions
of these tools to overall weight reduction is hard measure directly, but we will
return to them later as a possible means to explain gaps between observed weight
changes and those expected from materials substitution and architectural changes.
3 Weight growth: Functionality improvements
While the use of weight-saving technologies has steadily grown, it has been
offset (and at times, more than offset) by increases in the deployment of weight-
increasing features and a shift toward heavier (larger) car classes. In this section,
the weight differences between various car classes are summarized, as are the
subsystem weights associated with a variety of emissions, safety, and comfort &
convenience features.
3.1 Weights by car class
In this work, the effects on weight of shifts in the mix of vehicle sizes sold
was estimated using data found in the U.S. EPA’s annual Fuel Economy Trends
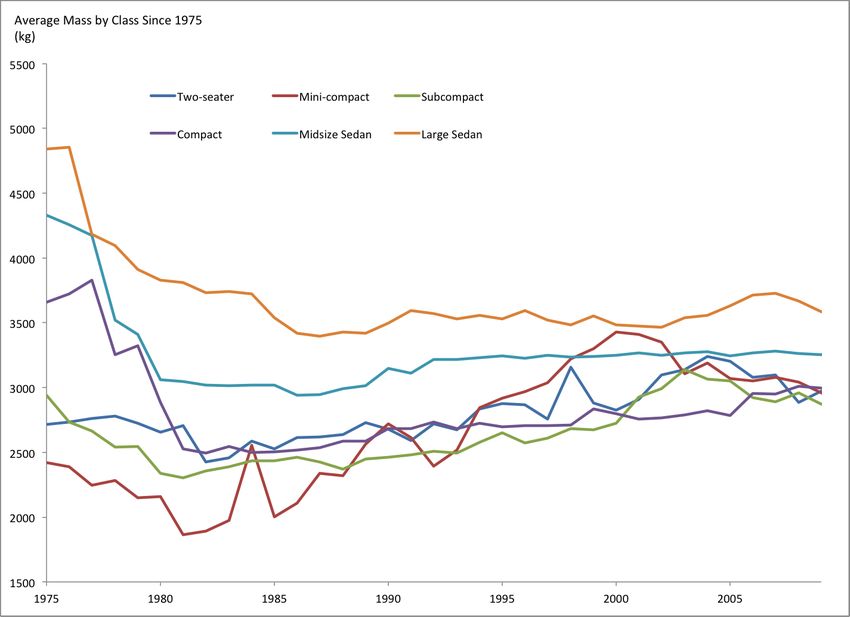
Report. Figure 2 shows the average curb weight (average inertia weight minus 136
kg or 300 lbs) for each of six classes of cars tracked by EPA (weights for large,
midsize, and small wagons tracked closely with those of the corresponding sedan
classes, and are omitted from the figure for clarity). Several features visible in the
figure are worth highlighting. First, weight decreases in the early years were much
greater among the larger car classes than among the smaller classes. Second, since
about 1980, the weights of compacts, subcompacts, and two seaters have been
quite similar. Finally, the overall spread between classes has been shrinking overDeterminants of U.S. passenger car weight 9 Figure 2 U.S. average vehicle weights by class. (EPA, 2012) time, first due to weight decreases in the larger classes and more recently driven by weight increases in the smaller classes. 3.2 Feature content One of the most readily observable changes to vehicles during the past four decades has been the widespread addition new features. For the purposes of this analysis, features included not only optional equipment (e.g. air conditioning) but also safety and emissions equipment such as airbags and catalytic converters that are required by regulation in new passenger cars. This analysis is unable to capture all improvements in these areas—noise, vibration, and harshness (NVH), for example, has dramatically improved in new vehicles as a result of balance shafts, sound insulating materials and active noise cancelation. Other metrics such as reliability and body rigidity have also improved. This analysis does not attempt to quantify such metrics. In total, features were estimated to add a total of 109 kg (240 lbs) to the average 1975 passenger car. In 2010, the estimated contribution grows to 223 kg (62 kg safety, 25 kg emissions, 136 kg comfort/convenience; a total of 491 lbs). These estimates do not include the contribution of secondary weight, discussed in the following section.
10       MacKenzie et al.
4 Secondary weight

Secondary weight represents the notion that for every unit of weight added to
(or removed from) a vehicle, the supporting systems and structures also grow
(or shrink) so that structural integrity and braking, acceleration and handling
performance can be maintained. Typically, the secondary weight is expressed as
some percentage an initial (primary) weight change. In the work reported here,
secondary weight enters as the form of a percentage multiplier on bottom-up
component analyses.
    Cheah (2010) reviewed more than twenty published studies of secondary weight
and identified estimates ranging from 23 – 129%, with a mean value of 79.6%. For
the purposes of this study the secondary weight was assumed to be 80% of the
primary weight added or removed. This secondary weight coefficient was applied to
the bottom-up analyses of features and materials, in which the initial estimates of
weight change were generated from component-level data. However, the secondary
weight multiplier was not applied for mix shifting or architectural changes, since
the weight effects of these changes had already been assessed at the whole-vehicle
level.

5 Estimating fleet-level            contributions       of    technologies       and
  functionality

The general approach to estimating the effects of technologies and functionalities
on average vehicle weight is captured in the question, “What would be the average
weight of vehicles from some base year be, if those vehicles instead had some
future year’s combination of technologies and features?” The effects of changes in
size mix, features, major architectural technologies, and alternative materials were
estimated sequentially and added up as outlined in this section. In all cases, the
changes in size mix, features, and technologies are measured relative to a base year
of 1975.

5.1 Mix shifting

The first step in estimating weight changes was to account for shifts in the mix of
size classes between 1975 and each future year t up to and including 2009. Nine
car classes based on body style and interior volume are tracked by U.S. EPA and
were used as the basis of the mix shifting analysis in this work. For each year t, a
weight value was calculated to represent the average weight of cars in that year, if
the average weight within each class had been the same as in 1975 but the market
share of each class were the same as the actual share in the year t.
             X
      Wts =      Sit · Wi,1975
             i

    In the above expression, Wi,1975 is the average weight of cars in class i in 1975,
Sit is the market share of class i in year t, and Wts is interpreted as the average
weight in year t, adjusted only for changes in shares of various car classes since
1975.
Determinants of U.S. passenger car weight 11
The deployment rates of other major technologies considered in this analysis
also tend to be correlated with car class. As a result, some changes in the market
share of front-wheel drive, unibody construction, and different engine sizes would
be expected to occur due to mix shifting. Therefore, the market share expected
based on the change in mix was estimated as follows:
X
s
Sjt = Sit · Sij,1975
i
In the above expression, Sit is the market share of class i in year t, Sij,1975 is
s
the market share of technology j within class i in 1975, and Sjt is interpreted as
the market share of technology j in year t, adjusted only for the changes in class
mix between 1975 and year t.
5.2 Architectural changes
After accounting for changes in weight and major technologies due to mix shifting,
the next step was to estimate the aggregate weight effects of changes in major
vehicle architectures. To do this, the per-vehicle weight effect of each architectural
change (δj ) was multiplied by the difference in market share of that architecture
between the year t and 1975 (where the latter share has first been adjusted for mix
shifting between 1975 and year t, as noted in the preceding section). The values
obtained were then summed over all architectural changes:
X
Wts,a = Wts + s
(Sjt − Sjt ) · δj
j
The above expression, Wts,a is interpreted as the average weight in year t, after
adjusting for changes in both mix and the prevalence of major architectures
between 1975 and year t. Specifically, this approach was used to estimate the
weight effects of the front-wheel drive and unibody transitions, as well as shifts
in the prevalence of 4-, 6-, and 8-cylinder engines. As discussed in section 4, the
weight differences associated with these architectural changes were estimated using
vehicle-level data, and do not require further adjustment to account for secondary
weight effects.
5.3 Safety, comfort, & convenience features
The next step was to estimate the weight effects of growth in the adoption of
safety, comfort, and convenience features. Since the weights of the features were
estimated based on teardown data for the associated components or subsystems,
the secondary weight multiplier was included to estimate the effect of these
features on overall vehicle weight:
X
Wts,a,f = Wts,a + (1 + σ) (Skt − Sk,1975 ) · δk
k
In the above expression, Skt is the take rate of feature k in year t, Sk,1975 is the
take rate of the feature in 1975, δk is the weight associated with the feature based12 MacKenzie et al.
on teardown analysis, σ is the secondary weight factor, and Wts,a,f is interpreted as
the average weight in year t, based on adjusting average weight in 1975 for changes
in mix, major architectural changes, and features.
The component-level masses used in these analyses of feature mass are limited
in their ability to embody technological improvements in the features themselves.
The study of safety features referenced, (DOT, 2004) incorporates at best two
point values for the mass of a given feature, while comfort and convenience feature
weights are based on a single teardown of four MY2009 production vehicles.
5.4 Alternative materials
The final step in estimating weight changes was to incorporate the effects of
changes in alternative materials usage between 1975 and each future year. This was
done by answering the question: “By how much would the weight of the average
car change if the materials mix from some base year 1975 were replaced with the
materials mix from some future year t?” This question was addressed in several
steps, premised on an assumption that all materials substitution occurs among the
materials in set C, which comprises conventional steel and iron, high-strength steel
(HSS), aluminum, magnesium, and plastics.
The first step was to ask, “What would be the weight of iron and steel in a
car if all of the steel, iron, high-strength steel (HSS), aluminum, magnesium, and
plastics in it were replaced by only conventional steel and iron?” This estimate was
made using the following expression:
X
Wtconv only =Wts,a,f fl,1975 ·P l
l∈C
In the above expression, Wtm,a,f is the average weight adjusted for changes in
size mix, major architectures, and features, as explained in the preceding sections;
fl,1975 is the weight fraction of material l in 1975; Pl is that material’s weight
reduction potential (i.e. the weight of conventional material replaced per unit
weight of material used, equal to 1 for conventional steel and iron and greater
than 1 for weight-saving alternative materials); and set C includes those materials
assumed to be subject to substitution. Other materials, such as glass, zinc, and
fluids, were explicitly excluded at this stage.
The second step was to ask, “How would the resulting weight estimate change
if the conventional steel and iron were replaced with HSS, aluminum, magnesium,
and plastics in the proportions used in year t?” The new weight using these
proportions of alternative materials was estimated as:
P
conv only flt
adv
Wt =Wt P l∈C
l∈C lt ·P l )
(f
Third, the weight of miscellaneous materials (the set D, including glass, zinc,
fluids, etc), was assumed to be unaffected by the materials substitution, and was
added to the estimated weight of steel, iron, HSS, aluminum, magnesium and
plastics:
X
Wts,a,f,m =Wadv,t + Wts,a,f flt
l∈DDeterminants of U.S. passenger car weight 13
Figure 3 Representation of modeling logic.
Finally, the weight was adjusted for the secondary weight effects resulting from the
materials substitution:
Wt =Wts,a,f,m +(Wts,a,f,m −Wts,a,f )(1 + σ)
The above weight, Wt , constitutes an estimate of the average car weight in year
t, obtained by starting from the average weight in 1975 and adjusting for changes
in size mix, major architectures, feature content, and materials composition
between 1975 and year t. The logic for estimating the weight effects of alternative
materials is summarized in Figure 3.
6 Examining weight trends since 1975
By combining all estimates of weight-reducing technologies and weight-increasing
functionality improvements as shown in Figure 3, an estimate was developed
for the net change in weight year over year. The results of these individual
contributions are reported here, and in section 7 they are aggregated up and
compared with actual net changes in average passenger car weight.
6.1 Sources of weight increase
All else equal, adding functionality to a vehicle in the form of greater size or
feature content will generally tend to increase weight. As will be shown in this
section, changes in the size mix have added approximately 50-100 kg (110-220
lbs) to the average new car in recent years. The addition of new safety, comfort,
and convenience features (and associated secondary weight increases) has added
approximately 200 kg (440 lbs) to the average new car since 1975.
Figure 4 shows the mix of car classes, weighted by sales, reported by
EPA (2012). In the late 1970s, there were noticeable shifts from the compact
segment to subcompacts, and to a lesser degree from large sedans to midsize.
Over the subsequent years, these trends were gradually reversed. More recently,
subcompacts have once again regained share from compacts, as have midsize cars
from large cars.
Figure 5 shows the estimated weight effects of safety, emissions, and comfort
& convenience features for the average new car since 1975, including secondary
weight effects. Comfort and convenience features have added more weight than
either safety or emissions features, with the most significant contributions coming
from near-universal application of air conditioning and automatic transmissions.14 MacKenzie et al.
Figure 4 Historical sales mix of passenger cars by class.
Figure 5 Impact of safety, emissions and comfort & convenience features from 1975 -
present including secondary mass.Determinants of U.S. passenger car weight 15
Figure 6 Cumulative impact of feature changes and mix shifting.
Greater detail, including the market shares and weight effects of each specific
feature considered, can be found in Zoepf (2011).
The estimated cumulative weight effects of additional features and mix shifting
are summarized in Figure 6. There was little change in the weight of features
between 1975 and 1980, but since 1980 the weight of features has steadily
increased, and was estimated to account for approximately 200 kg (440 lbs) of
additional vehicle weight in 2009, compared with 1975. The effect of mix shifting
since 1975 peaked at an increase of 106 kg (233 lbs) in 2005, before falling back
to +54 kg (120 lbs) by 2009 as the longstanding trend toward larger cars was
reversed. The results in Figure 6 indicate that if not for the effects of weight-saving
technologies, mix shifting and the adoption of new features would have increased
the weight of the average car by approximately 250 kg (550 lbs) between 1975 and
2009.
6.2 Sources of weight reduction
Technological improvements, including greater use of front-wheel drive, unibody
construction, lighter and stronger materials, and a shift from 8-cylinder to 4- and
6-cylinder engines, have all tended to reduce the average weight of new cars since
1975.
Figure 7 shows the fractions of cars using each construction type from 1975
through 2010. The shares in Figure 7 are based on data compiled by Audatex
North America, and are based on available models rather than sales. About half
of the cars offered for sale in the U.S. in 1975 used unibody construction, but this16 MacKenzie et al.
Figure 7 Availability of major passenger car construction types from 1975 - present.
share rose steadily to more than 90% by 1990, and has changed only slightly since
then.
Figure 8 shows the market share of front-wheel drive in U.S. cars from 1975 to
2010, as reported by EPA (2012). These values are sales-weighted. Less than 10%
of new cars employed front-wheel drive in 1975. As with unibody construction, this
share rose rapidly through 1990, but has remained fairly steady since then.
Figure 9 shows the sales-weighted shares of 4-, 6-, and 8-cylinder engines by
year, which together account for the overwhelming majority of all engines in U.S.
cars. Eight-cylinder engines suffered a huge loss in market share between the late
1970s and early 1980s, followed by slower declines in later years. After peaking
in the mid-1980s, the share of 4-cylinder engines declined slightly and then held
steady before recovering as fuel prices rose after 2005.
The materials content of cars was compiled from several related sources,
primarily various editions of the Transportation Energy Data Book (TEDB)
published by Oak Ridge National Laboratory. The scope of the materials analyses
and the original sources of the data varied from year to year, but there was
substantial overlap between the various time series. Table 3 summarizes the years
included in each time series, and which of these were incorporated into the time
series reported in this work. In years for which no data could be found, materials
content was linearly interpolated.
The materials content data warrants additional discussion. Two potential issues
are the changing scope used over the years (U.S.-built car, domestic car, domestic
light vehicle), and the differing original sources of the data. Fortunately, there
is substantial overlap between the different data sets, and in general the weight
fractions of each of the key materials are very similar in the different dataDeterminants of U.S. passenger car weight 17 Figure 8 Sales-weighted penetration of front-wheel drive in passenger cars. Figure 9 Market share of 4, 6 and 8-cylinder engines in passenger cars.
18        MacKenzie et al.
Table 3   Sources of material content data used in this analysis.
Series    Source                Scope           Years Available             Years Used
(1)       TEDB, Ed. 6           U.S.-built      1975-1981                   1975-1981
          (citing Ward’s)       car
(2)       TEDB,      various    Domestic        1978,   1984,       1985,   1984, 1985,
          (citing Ward’s)       car             1992,   1993,       1994,   1992, 1993,
                                                1996, 1997                  1994, 1996,
                                                                            1997
(3)       TEDB, various         Domestic        1977,   1978,    1985,      1987, 1990
          (citing American      car             1987,   1990,    1998,
          Metal Market)                         1999, 2001, 2003, 2004
(4)       TEDB, various         Domestic        1995-2009                   1998-2009
          (citing Ward’s)       light vehicle
(5)       American              Domestic        1987-2005                   None
          Chemistry Council     light vehicle

series. This helps to mitigate concerns over inconsistencies in the data over time.
Moreover, personal communication with Ward’s has confirmed that the American
Chemistry Council is the original source of the Ward’s data.
    An additional issue is that these data are based on domestic vehicles, and
not imports. This is a legitimate concern, but in the absence of any data on
the materials composition of imported cars, the materials composition time series
reported here were assumed to apply to all cars sold in the U.S.
    Figure 10 charts the evolution of the materials composition of U.S. cars based
on the composite data set described above. The share of conventional iron and steel
in overall vehicle weight has shrunk by a third since 1975, with HSS, aluminum,
and plastics rising to fill in the gap. Plastics & composites account for twice as
large a share of weight as they did in 1975, while aluminum content has quadrupled
and HSS content quintupled. Although magnesium’s share has grown by a factor of
10, it still only accounted for about 0.3% of vehicle weight in 2009. Miscellaneous
materials (rubber, glass, fluids & lubricants, etc.) have risen modestly, from 20%
to 25% of overall vehicle weight.
    The estimated effects of the various technological improvements on average car
weight are summarized in Figure 11. Each series corresponds to the estimated
cumulative weight change relative to 1975. All of these technological changes
contributed significantly to weight reduction, especially in the early years.
Since 1990, weight reductions have largely been driven by alternative materials
substitution, as the market has become saturated with front-wheel drive and
unibody cars and the shift away from 8-cylinder engines slowed considerably. All
told, the combined effects of technology are estimated to have reduced the weight
of the average new car in the U.S. by 790 kg (1,700 lbs) versus 1975.

7 Estimating average weight

The effects of growing feature content, mix shifting, and weight-reducing
technologies were summed up as outlined in section 5 (Estimating Fleet-Level
Contributions of Technologies and Functionality). The resulting weight estimates
Determinants of U.S. passenger car weight 19
Figure 10 Materials composition of U.S. passenger cars, 1975 - present.
Figure 11 Estimated effects of technological improvements on vehicle weight, 1975 -
present.20 MacKenzie et al.
for each year are plotted in Figure 12, along with the actual average weight
as reported by U.S. EPA. The estimates developed here capture the general
trends observed in the weight of the average new car between 1975 and 2000:
namely, a large and abrupt decrease in the late 1970s - early 1980s, followed
by a gradual reversal and increase. After 2000, actual average weight continued
to climb, while the estimates of this work declined slightly, driven by growth in
alternative materials.
Although the results reported here reflect the general trends in average car
weight, two key discrepancies are apparent in Figure 12. First, the estimates
developed in this work are too high in the early years. Second, the estimates
continue to fall while actual weights remained constant, and have not risen as
quickly as actual weights have in recent years. These discrepancies are highlighted
by a residual term, also plotted in Figure 12 and calculated as the difference
between the actual average weight and the average weight predicted by this
analysis. That the predicted values for weight would not perfectly agree with
the true averages should not be surprising, given the disparate and often highly
aggregate nature of the data used to generate the estimates. Nonetheless, patterns
in the actual and estimated weight trends may be due to a variety of causes, and
deserve further discussion.
It appears that some substantial source of weight reduction has been omitted
from the estimated values in 1976-78, which suggests that one of two things may
have been happening at that time. There may have been additional technological
improvements that served to reduce weight. Some of these were discussed in section
2, and might include improvements in design, engineering, and manufacturing
practices. Another possibility is that design tradeoffs were made that sacrificed
functionality in order to save weight, but that these sacrifices were not captured in
the data on feature content or size mix. The latter explanation seems less plausible,
given that there was so little change in weight due to feature content or size
reductions during this period. Presumably, if design tradeoffs were being made to
save weight, they would not be restricted to only those attributes that happen to
be excluded from our data set.
A second feature of Figure 12 is that the estimated weight is approximately
constant after 1988, but actual weight increased during this period. This suggests
that additional features or functionality, not captured in the data on feature
content, may have been added to cars during this period. Some possibilities were
discussed in section 5, and include things like NVH improvements. It is also
possible that the estimated weight reductions from technology in this latter period
were too high. However, in order to fully explain the actual change in weight during
this time, the weight savings from technology improvements (largely alternative
materials during this period) would need to be essentially zero. Even if the true
weight savings from alternative materials were lower than assumed, it is unlikely
that they would be zero, since there would be no incentive to adopt more expensive
materials if they didn’t save weight (or equivalently, increase strength per unit
weight).
An additional possible explanation for the discrepancies between the actual
and predicted weights is that certain parameters assumed to be constant in this
analysis may have actually varied over time. For example, it is plausible that the
secondary weight factor might have been higher in earlier years and lower in moreDeterminants of U.S. passenger car weight 21
Figure 12 Actual and estimated average car weights since 1975 with residuals.
recent years. Alternatively, the weight savings from front-wheel drive or unibody
construction may have declined over time. While these factors would tend to push
the estimated weights closer to the actual weights (lower in the early years, higher
in the later years), none of them on its own is adequate to resolve the discrepancies
between the actual and estimated average weights.
8 Conclusions
In the work reported here, a bottom-up analysis was developed to explain as fully
as possible the rapid decline and subsequent steady increase in the average weight
of new U.S. cars since 1975. The weight effects of various technologies and features
were estimated using reviews of available literature and analysis of model-level
data. Weight trends across the fleet of new cars were estimated by aggregating up
these vehicle-level data using fleet-wide penetration rates.
The best estimates from this work indicate that new features and functionality
would have added at least 250 kg (550 lbs) to the weight of the average new car
between 1975 and 2009, if not for offsetting improvements in technology. Over the
same period, it is estimated that alternative materials, more weight-efficient vehicle
architectures, and reduced engine sizes have taken 790 kg (1,700 lbs) out of the
weight of the average car.
The switch to front-wheel drive, that from body-on-frame to unibody
construction, and increased use of alternative materials all contributed significantly
to historic weight reductions, and observed changes were able to explain about22 MacKenzie et al.
80% of the weight reduction that occurred between 1975 and 1982. In later years,
accounting for observed features and technology replicated the observed weight
increases of the 1990s, but did not capture the continued weight increases since
2000.
Several explanations are possible for the observed patterns. First, there might
be substantial unobserved technology improvements or engineering emphasis on
reducing weight that was omitted from the data set, particularly concentrated
in the early years. Such a theory is generally supported by anecdotal evidence
from industry experts at the time (Lutz, 2011) who claim that CAFE regulations
and economic conditions forced radical redesigns of domestic vehicles in the early
1980s.
Such a shift in engineering emphasis could result in the discontinuity of the
application of technology or diminishing marginal returns in unobserved weight-
reducing technologies that are reflected in the residual error observed here. This
effect could potentially be modeled using a non-fixed secondary weight multiplier
that is higher in early years. Alternatively, our inability to accurately predict
weight changes during late phases of the 1975-2009 period considered could
indicate a shift in focus to improve the feature and functionality of vehicles in
non-observed ways such as crashworthiness or reductions in NVH.
As noted at the outset, many automakers have recently announced a renewed
focus on reducing the weight of their vehicles. An update to this work within
the next few years will be particularly telling. Will automakers realize this weight
reduction primarily through observable materials or structural changes, or will
these reductions come through unobservable design and process changes? More
importantly, however, will be whether these reductions are actually realized, or
they are offset by the continued growth in vehicle features and functionality
witnessed over the past three decades.
References
ACC. Chemistry & light vehicles. Technical report, American Chemistry Council,
December 2011.
D. Carle and G. Blount. The suitability of aluminium as an alternative material for car
bodies. Materials & design, 20(5):267–272, 1999.
L.W. Cheah. Cars on a diet: the material and energy impacts of passenger vehicle weight
reduction in the US. PhD thesis, Massachusetts Institute of Technology, 2010.
S. Das, T.R. Curlee, and S.M. Schexnayder. Materials used in new generation vehicles:
supplies, shifts, and supporting infrastructure. Technical Report ORNL/TM-13491,
Oak Ridge National Lab., TN (United States), 1997.
DOT. Cost and weight added by the federal motor vehicle safety standards for model
years 1968-2001 in passenger cars and light trucks. Technical Report DOT HS 809
834, U.S. Department of Transportation, December 2004.
E. Dupnick and J. Graham. The demand for advanced materials in the automotive
industry: Projections for the next decade. In AIP conference proceedings, volume
361, page 163, 1996.
EPA. Light-duty automotive technology, carbon dioxide emissions, and fuel
economy trends: 1975 through 2011. Technical Report EPA-420-R-12-001a, U.S.
Environmental Protection Agency, March 2012.Determinants of U.S. passenger car weight 23
AL Gutherie. Fairmont/zephyr-engineered for lightweight and improved fuel economy.
Technical Report 780134, Society of Automotive Engineers, 400 Commonwealth Dr,
Warrendale, PA, 15096, USA,, 1978.
A.A. Luo. Magnesium: current and potential automotive applications. JOM Journal of
the Minerals, Metals and Materials Society, 54(2):42–48, 2002.
R. Lutz. Car Guys vs. Bean Counters: The Battle for the Soul of American Business.
Portfolio/Penguin, New York, NY, 2011.
S. Mayer, AD Seeds, and Society of Automotive Engineers. BMW’s aluminum light-
weight prototype car projects: Comparison of aluminum and steel performance.
Technical Report 940154, Society of Automotive Engineers, 400 Commonwealth Dr,
Warrendale, PA, 15096, USA,, 1994.
T. Murphy. Aluminum claims no. 2 ranking. WardsAuto.com, March 2006.
H. Pilz, J. Schweighofer, and E. Kletzer. The contribution of plastic products to resource
efficiency. Technical report, Plastics Europe - Association of Plastics Manufacturers,
Brussels, Belgium, 2005.
R. Roth, J.R. Dieffenbach, R. Koehr, and J.A. Isaacs. Economic analysis of the ultra
light steel auto body. In SAE Conference Proceedings P, pages 285–290. Society of
Automotive Engineers, 1998.
K. Salonitis, J. Pandremenos, J. Paralikas, and G. Chryssolouris. Multifunctional
materials used in automotive industry: A critical review. In Engineering Against
Fracture, volume 1, page 59, 2009.
F. Stodolsky, A. Vyas, R. Cuenca, and L. Gaines. Life-cycle energy savings potential
from aluminum-intensive vehicles. In 1995 Total Life Cycle Conference & Exposition,
Vienna, Austria, October 1995.
R. Wohlecker, H. Wallentowitz, R. Henn, and J. Leyers. Communication module–
mass reduction. Technical Report 56690, Forschunggesellschaft Kraftfahrwesen mbH
Aachen, Body Department, November 2006.
S. Zoepf. Automotive Features: Mass Impact and Deployment Characterization. Master’s
thesis, Massachusetts Institute of Technology, 77 Massachusetts Ave. Cambridge,
MA 02139, USA., 2011.You can also read