Outline I. Quit-Layoff Distinction (Brief Summary of Evidence) II. Interpreting the Quit-Layoff Distinction III. Evidence on Earnings Losses of ...
←
→
Page content transcription
If your browser does not render page correctly, please read the page content below
Professor Steven Davis, University of Chicago, January 2018

Outline
I. Quit-Layoff Distinction (Brief Summary of Evidence)
II. Interpreting the Quit-Layoff Distinction
III. Evidence on Earnings Losses of Displaced Workers
IV. Evidence on Other Consequences of Job Loss/Job
    Displacement
V. Relating the Evidence to MP-type Search and
    Matching Models
VI. Some Directions for Future Research
                                                                1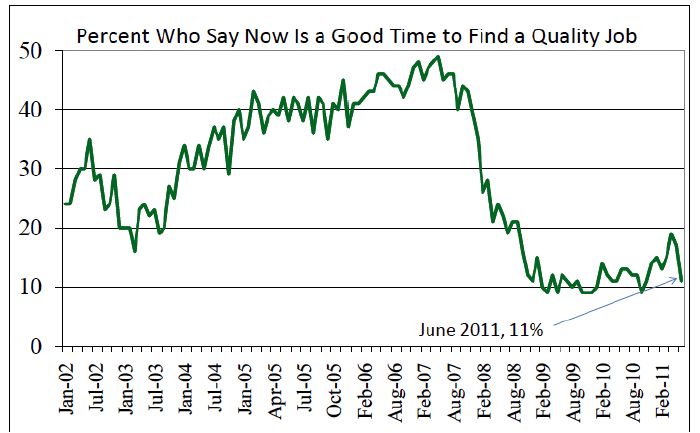
• A large body of empirical research investigates the
  wage, earnings, and employment outcomes
  associated with quits and layoffs.
• Layoffs involve greater unemployment incidence
  and longer unemployment spells than quits.
  – Leighton and Mincer (1982) find that laid-off workers
    are twice as likely as quits to become unemployed in
    the National Longitudinal Survey of Men.
  – McLaughlin (1990) finds higher unemployment
    incidence for laid-off workers in the Panel Study of
    Income Dynamics.
                                                       2
– Mincer (1986) finds that two-thirds of layoffs among
    white men result in unemployment, as compared to
    one-third of quits. Conditional on unemployment,
    mean spell length is nearly twice as long for laid-off
    workers in Mincer’s study.
  – Similarly, CPS data show that monthly escape rates
    from unemployment are 10-15 percentage points lower
    for permanent layoffs than for quits. See Figure 6.8 in
    Davis, Haltiwanger and Schuh (1996) and Figure 4 in
    Bleakley et al. (1999).
• Layoffs are associated with larger earnings losses
  than quits, as seen in the chart on the next page.3
Reproduced from Flaaen,
Shapiro and Sorkin (2013)
Using SIPP data on quits and layoffs (worker reports) and LEHD data on quarterly
earnings (administrative records), excluding quarters with zero earnings.
4• Many laid-off workers experience large and
persistent earnings losses, apparently as a direct
consequence of job loss.
– The evidence on this point is most dramatic and
compelling for prime-age workers who lose high-
tenure jobs in mass layoff events.
– These job losers experience large, persistent declines
in earnings relative to their previous earnings and
relative to the earnings of observationally similar
workers who are not laid off.
5– Jacobson, Lalonde and Sullivan (1993) provide one of the best-known studies of this phenomenon. See Couch and Placzek (2010) for an important follow up. – Stevens (1997) finds that an initial displacement event raises a worker’s incidence of job loss for several years thereafter. – Similarly, Ruhm (1991) finds that displaced workers experience higher unemployment rates for at least four years after the initial job loss event. – Topel (1990) presents evidence that earnings losses (relative to pre-displacement levels) are smaller and less persistent for job losers with lower tenure. – There is much later work on earnings losses 6
Summarizing:
1. Laid-off workers are more likely to become unemployed
2. They have lower exit rates from unemployment
3. They experience less employment stability following an initial
   displacement event
4. They often experience a large and persistent decline in earnings
5. The loss in earnings is bigger and more persistent for job losers
   with higher tenure.
6. As documented earlier in the course (and below), the incidence
   of layoffs fluctuates in a strongly counter-cyclical manner.
    In short, laid-off workers experience significantly worse
    labor market outcomes, and recessions bring many
    more laid-off workers. More on this topic below.       7
• There are many competing interpretations for
the systematic outcome differences between
quits and layoffs.
• One view interprets all separations (and
retentions) as efficient outcomes in the sense
that they maximize the joint surplus of employer
and worker. According to this view, quits and
layoffs are mere labels that lack deeper
economic significance.
– McLaughlin (1990, 1991) provides a systematic
development of this view.
8• Another view, articulated by Hall and Lazear
(1994), stresses two-sided information
asymmetries that preclude fully efficient
separation outcomes in bilateral employment
relationships.
• According to this view, second-best solutions to
informational problems lead to real wage rigidity
and the excess sensitivity of quits and layoffs to
labor demand.
9• Other interpretations of the quit-layoff
distinction stress:
– Legal and institutional constraints on compensation
and separations. Examples include minimum wage
laws and collectively-bargained wage floors.
– Negative effects of wage cuts on employee morale
and productivity (Bewley, 1999)
– Adverse selection effects on quits and workforce
quality induced by wage cuts (Weiss, 1990)
– Insider-outsider conflicts that lead to inefficient
wage structures and rigid separation policies
(Lindbeck and Snower, 2002).
10• Many of these other interpretations of the quit-
layoff distinction depart, implicitly or explicitly,
from a strictly bilateral perspective on
compensation, separations and other aspects of
the employment relationship.
– Collective bargaining is an obvious example.
– Many European countries feature a major role for
centralized wage setting in which collectively
bargained agreements are extended to much of
economy. For a discussion of the Swedish case, see
“Centralized Wage-Setting as Industrial Policy,” Davis
and Henrekson (Labour Economics, 2005). 11• Aside from collective bargaining and legal
constraints, employers often rely on wage
policies – rather than individually bargained
wages – to determine compensation and
influence turnover.
• These policies specify wages as a function of
seniority, credentials, and position within an
organization, and concerns about internal pay
structure loom large.
12• Such “multi-lateral” compensation policies offer
greater scope for a meaningful distinction between
quits and layoffs than the bilateral perspective that
pervades equilibrium search theories.
• It is a challenge to incorporate “multi-lateral”
aspects of compensation and turnover and
departures from bilateral efficiency into equilibrium
search models.
• In recent years, several researchers have developed
equilibrium search models with multiple workers,
but most lack a meaningful quit-layoff distinction.
13• Many recent studies exploit large-scale worker-
employer longitudinal data sets to study the
impact of job loss/displacement on affected
workers (and, in some cases, on family members
and communities).
• Jacobson, Lalonde & Sullivan (1993) is the first
high-quality study to exploit large-scale
administrative data to study this issue.
14Broadly speaking, there are two empirical approaches to the earnings consequences of job loss events. • One approach uses household survey responses to identify worker-employer separation events that fit some reasonable conception of unwanted job loss. Most early work uses household survey data. • Another approach uses longitudinal employer-worker linked administrative records to identify mass-layoff events defined by sharp, large and persistent employer contraction episodes. The empirical investigation then proceeds under the presumption that workers who separate in these mass-layoff events experience an unwanted job loss due to the employer contraction. 15
• JLS consider a “mass-layoff” sample of workers
  with job tenure of six or more years, and who lose
  jobs during the early and mid 1980s.
• Their sample contains job separators from
  establishments in Pennsylvania that, within a year
  of separation, have employment levels at least
  30% below their maximum levels in the late 1970s.
• They further require that the employer have at
  least 50 employees in 1979, and that separators
  have positive earnings (in Pennsylvania) during
  each calendar year.                             16
• JLS find that mean earnings fall by 50% in the
  quarter of displacement, then recover by
  roughly half over the following six quarters.
• Five years after displacement, mean earnings
  remain 25% below pre-displacement levels.

                                                   17
• Couch and Placzek (2010) reassess the JLS
evidence. They point out that the JLS data cover a
period of high unemployment in a heavily
industrialized state characterized by
disproportionate job losses in manufacturing.
– These features of the JLS sample contribute to higher
earnings losses for displaced workers.
• CS consider the earnings losses for Connecticut
workers who lost jobs in 1998-1999 using a similar
methodology to JLS.
– 1998-99 were much better years than the early 1980s,
and Connecticut is less industrialized than Pennsylvania
18• CS Table 1 summarizes the evidence on the
earnings losses of displaced workers from
several high-quality studies.
– The losses found by JLS are on the high side but
not out of line with other studies, especially when
one considers the nature of the JLS sample.
19Recessions and the
Costs of Job Loss
Steven J. Davis and Till von Wachter
Brookings Papers on Economic Activity,
Fall 2011
20Outline
• Incidence of Job Loss and Job Displacement
• Earnings Losses Associated with Displacement
– Empirical Specification for Estimating Losses
– Magnitude of Present Value Losses
– Sensitivity to Conditions at Time of Displacement
– Selection Bias?
• Response of Worker Anxieties and Perceptions
to Contemporaneous Conditions
• Earnings Losses Due to Job Loss in Leading
Models of Unemployment Fluctuations
21Fig. 1. Job Loss Indicators, Quarterly, % of Employment
10.0 Job Destruction (BED) 7.0
Unemployment Inflows (CPS)
9.0 Layoffs (JOLTS) 6.0
8.0 5.0
7.0 4.0
6.0 3.0
5.0 2.0
Initial Claims for UI Benefits
(Right Axis)
4.0 1.0
1990
1991
1992
1993
1994
1995
1996
1997
1998
1999
2000
2001
2002
2003
2004
2005
2006
2007
2008
2009
2010
2011
22Job Loss Indicators, Quarterly, % of Employment
10.0 Job Destruction (BED) ~9 million 7.0
Unemployment Inflows (CPS)
per quarter
9.0 Layoffs (JOLTS) 6.0
8.0 5.0
7.0 4.0
6.0 3.0
5.0 2.0
Initial Claims for UI Benefits
~5 million per quarter
4.0 1.0
1990
1991
1992
1993
1994
1995
1996
1997
1998
1999
2000
2001
2002
2003
2004
2005
2006
2007
2008
2009
2010
2011
23Defining Job Displacements in SSA Data 1. A worker separates in year y if he has earnings with the employer in y-1 but not in y. 2. A worker is displaced in year y if: • He separates from his (main) employer in y • 3+ years of tenure with employer as of y-1, and • Employer experiences a mass-layoff event in y 2. Employer criteria for a mass-layoff event in y: • 50+ employees in y-2 • Employment contracts by 30-99% from y-2 to y • Employment in y-2 < 130% of employment in y-3 • Employment in y+1 < 90% of employment in y-2 24
Fig. 2. Annual Job Displacement Rates, Percent
20                                                                              6
                                                            Displacement

                 Men, 50 and younger,                       Rate

18
                 3+ Years of Prior Job Tenure Using a 1%
                                              R.S. of men
                                                                                5
                                                      with a valid
                                                      SSA #, then
                                                      applying age, 4
16                                                    tenure, firm
                                                      size & industry
                                                      criteria        3

14
                                                                                2

12                Job Destruction                                               1
                  At Firms with
                  50+ Employees (left axis)
10                                                                              0
                                                                           25
  1977   1981   1985   1989   1993    1997    2001   2005      2009
Fig. 2. Annual Job Displacement Rates, Percent
20 6
31-36% of men in our SSA data 20% cumulative
satisfy the age, job tenure and
firm size criteria.
displacement
5
18 from 1980
to 1985 ~
4
2.7 million
16
men
3
14
2
12
1
10 0
26
1977 1981 1985 1989 1993 1997 2001 2005 2009Fig. 2. Annual Job Displacement Rates, Percent
20 6
The CPS Displaced Worker Supplement uses a less restrictive
concept of displacement. It reports 6.9 million persons with
3+ years of prior job tenure were displaced from 2007 to 2009,
5
18 and another 8.5 million with less tenure were displaced.
4
16
3
14
2
12
1
10 0
27
1977 1981 1985 1989 1993 1997 2001 2005 2009Fig. 3. Annual Displacement Rates by Tenure,
Men 50 or Younger at Firms w/50+ Employees
28Fig. 3. Annual Displacement Rates by Age, Men
w/3+ Years Tenure at Firms w/50+ Employees
29Estimating the Dynamic Pattern of Annual Earnings Losses for
Workers Displaced in Displacement Year y
For workers displaced in y, y+1 or y+2,
Level of real earnings on dummies turn on k years after displacement.
mainDistributed Lagyear
job for i in Model
t Quartic in Age Song, Manchester (2011)
von Wachter,
Individual and Calendar Allowing for differential Fit to 1974-2008 longitudinal
Year Fixed Effects earnings trends earnings data separately for
k= years since or to job displacement each displacement year from
1980 to 2005.
Event Job displacement in y, y+1, y+2
Control Group Workers not separating from employers in
y, y+1, y+2 (same age, tenure and 50+ requirements)
Identification Evolution of control group earnings
Assumption is a valid counterfactual for earnings of
displaced workers in the absence of job displacement,
conditional on controls 30Fig. 4B. Average Annual Earnings Losses Before and After Job
Displacement Relative to Control Group Earnings,
Men 50 or Younger with At Least 3 Years of Job Tenure
We construct these plots by averaging the estimation
results over displacement years from 1980 to 2005.
Last year of
positive earnings
with pre-
displacement
employer
31Fig. 4C. Average Annual Earnings Losses Before and After Job Displacement
Relative to Control Group Earnings, Fraction of Pre-Displacement Annual
Earnings, Men 50 or Younger with At Least 3 Years of Job Tenure
32Fig. 5. Annual Earnings Losses in the Third Year of Job
Displacement, Men 50 or Younger with at Least 3 Years of
Job Tenure Prior to Displacement
Displacement Annual Earnings
Earnings Loss Relative to Pre-
Unemployment Rate in Displacement Year (Year 1) 33Is It Selection Bias? • Workers displaced from employers with >80% contraction experience similar earnings losses – Argues against within-firm selection • Losses are smaller when controlling for firm- year effects, but they remain large and persistent. – Argues against between-firm selection • Selection does not explain larger losses for workers displaced in worse times, when negative selection effects are likely weaker. • See von Wachter, Manchester and Song (2009) for more on selection. 34
35
Table 1.
Magnitude of PV Earnings Loss at
Job Displacement in Mass Layoffs
  from 1980-2005: Men, 50 or
Younger with 3+ Years of Prior Job
             Tenure

                                     36
Fig. 6. PV Earnings Losses over 20 Years from Displacement,
Men 50 or Younger with 3+ Years of Prior Job Tenure
PV Earnings Loss As a Multiple of Pre-
Displacement Annual Earnings
Unemployment Rate in Displacement Year 37Table 2.
Magnitude of PV Earnings Loss at
Job Displacement in Mass Layoffs
from 1980-2005: Men, 50 or
Younger with 6+ Years of Prior Job
Tenure
and Women, 50 or Younger
with 3+ Years of Tenure
38Integrating Survey & Administrative Data
In “Reconsidering the Consequences of Worker
Displacement: Firm versus Worker Perspective,”
Flaaen, Shapiro and Sorkin (2017) neatly combine
survey-based information from the SIPP on the
reason for worker separation with LEHD data
(derived from administrative records) on employer
growth rates and mass-layoff events.
Like other studies based on administrative
records, they use high-quality data on individual
earnings tracked longitudinally over many periods.
39Integrating Survey & Administrative Data, 2 They sort mass-layoff (ML) separators into distress, quit, and other classifications based on SIPP responses to questions on the reason for separation. In their first main result, they show that the post- separation earnings trajectories of ML separators differ radically depending on the worker-supplied reason for the separation. In other words, when faced or hit by a mass-layoff event, workers differ greatly in their capacity to adjust, and in a manner that is partly captured by a simple three-way survey- based classification. 40
Integrating Survey & Administrative Data, 3
 The paper’s most important and novel contribution is to
 develop and implement a method for identifying a latent
 ML earnings loss trajectory for each type of separator
 (distress, quit, and other) and for ML separators on
 average. The latent earnings loss trajectory accounts for
 the big fact that distress, quit, and other separations
 occur regularly, and not just because certain employers
 contract. To address this issue, the authors look to
 separation rates and earnings loss trajectories at relatively
 stable firms. That, plus worker and period controls, gives
 them a sensible counterfactual, which they use to identify
 and isolate the contraction-induced effects on separation
 rates and earnings trajectories in ML events.             41
Integrating Survey & Administrative Data, 4
   Somewhat surprisingly, the latent earnings loss
   trajectory for the average ML separator identified in
   this manner is very similar to the comparatively naïve
   earnings loss trajectory yielded by the standard
   approach to administrative records data.
   The paper contains other results as well. They are well
   summarized in the introduction.

                                                        42
IV. Evidence on Other Consequences of
Job Loss/Job Displacement
• The few studies that estimate the effects of job
loss or unemployment on consumption typically
find sizable near-term declines in consumption
expenditures (and lack evidence on long-term
consumption responses). See Gruber (1997) and
Stephens (2004), for example.
• Baker (2014), a recent Stanford PhD now at
Northwestern, finds that spending responses to
household income shocks (driven by shocks to
their employers) rise with HH indebtedness.
43Other Consequences, 2
Baker exploits a new, very rich dataset that
contains detailed information on spending,
incomes and balance sheets for millions of
American households.
• See Stevens (2007), VSM (2011) and Jarosch
(2014) for evidence that job displacement brings
lower job stability, greater earnings instability, and
recurring spells of joblessness.
44Other Consequences, 3
• Other studies find evidence that displaced workers
suffer short- and long-term declines in health, a
higher incidence of stress-related ailments (e.g.,
heart attacks), and higher mortality rates. See
Burgard, Brand and House (2007), Sullivan and von
Wachter (2010) and Black et al. (2012).
• Black et al. (2012) find evidence that much of the
negative health effects associated with job loss are
driven by increased smoking. See Black et al.
(2012) for additional references to the literature
on the relationship of job loss to health outcomes.
45Other Consequences, 4
• Several studies point to negative long-term effects
of layoffs on the children and spouses of job
losers, e.g., Oreopoulos, Page and Stevens, 2008
and Wrightman (2009).
• Banzhaf (2013) investigates how the effect of job
loss on divorce depends on the earnings potential
of both spouses.
• Not surprisingly, job loss and unemployment lead
to reductions in happiness & life satisfaction (Frey
& Stutzer, 2002).
46Worker Anxieties about Job Loss and
other Labor Market Prospects
• Perceptions about job loss and the difficulty of
job finding track actual unemployment rates
• Worker anxieties about job loss, hours cuts,
wage and benefit cuts rose sharply after the
2008 financial crises and remain very high
• These high anxiety levels likely produce
important stresses and psychological costs for a
large segment of the population.
47Fig. 8. Perceived Likelihood of Job Loss in Next 12
Months, All Available Years in the General Social
Survey, 1977 to 2010
Unemployment rate data from the CPS, perceptions data from the GSS.
48Fig. 9. Perceived Likelihood of Job Finding,
All Available Years in the General Social Survey,
1977 to 2010
Unemployment rate data from the CPS, perceptions data from the GSS.
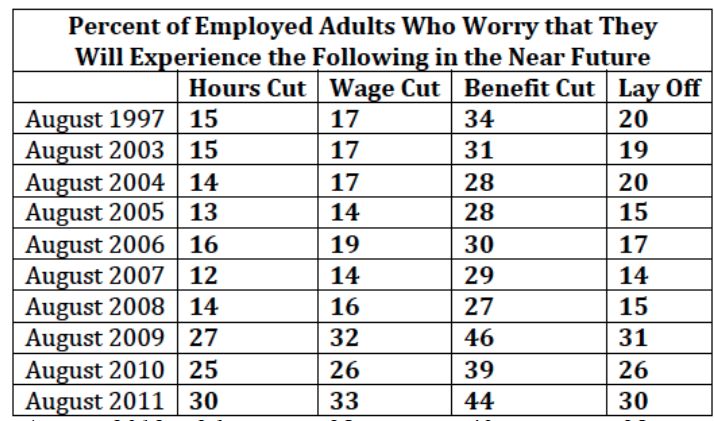
49Figure 10. Perceived Ability to Find a Quality Job,
March 2002 to June 2011, Gallup Polling
50Based on polling from 5-8 September 2013.
51Source: www.gallup.com/poll/158918/
jobs-outlook-dismal-across.aspx
52Table 3. Worker Anxiety Rose Sharply in the Wake of
the 2008 Financial Crisis and Remained High
August 2012 26 28 40 28
August 2013 25 29 43 31
5354
Basic MP Model of Frictional Unemployment
• Homogenous jobs, workers and matches
• Filled jobs/matches blow up at constant rate
• Aggregate productivity, common to all jobs, is
  exogenous and stochastic
• Hires = M(Unemployed, Vacancies), CRS
• Wage determination: Nash or BRW
• Free entry of employers/vacancies
• The only nontrivial decision in the model is how
  many vacancies employers create.
Job-Filling                               Per-period
Rate                                      Recruiting 55Cost
Table 4. PV Income and Earnings Losses
Due to Job Loss in the Basic MP Model

 All calibrations follow Hall and Milgrom (AER, 2008).
                                                         56
MP Model of Burgess and Turon (2010)
• Start with Mortensen and Pissarides (1994)
• Add costly search on the job and other changes
The Model Yields:
• Worker flows apart from job flows
• Heterogeneity in productivity and wages
• A job ladder
! • Job loss spikes due to negative aggregate
shocks !
!!!!!!!!!!!!!!!!!!!!!!!!!!!!!!!!!!!!!!!!!!!!Search!on!the!Job!!!!!!!!!!!!!!!!!!!!!!
! !
!!!!!!!!!!!!!!!!!!!!!!!!!!!!!!!!!!!!!!!!!!!!!!!!!!!!!!!!Replacement!Hiring! !
!
!!!!!!!4σ!!!!!!!!!!!!!!R(p)!!!!!!!!!!!!!!!!!!!!!!T(p)!!!!!!!!!!!!!!!!!!!!!!!!!!!!!!!!!!!S(p)!!!!!!!!!!!!!!!!!!!!!!!!!!!!!!!!!!!σ!!!!!!!!!!!
!!!
Idiosyncratic!Productivity!Thresholds!for!Job!
Destruction,!Replacement!Hiring!and!Search!on!the!Job!5758
Table 5. PV Earnings Losses Due to Job Loss
  in Model of Burgess and Turon (2010),
     MP(1994) with Search on the Job

  Note: We calibrate the model to match U.S. job-finding rates. Burgess and Turon
  calibrate their model to match features of the British economy from 1964 to 1999.
  Using their calibration, which entails much lower job-finding rates for unemployed
  workers, the Mean PV earnings losses range from 4.4% to 5%.
                                                                                 59
Table 5, Continued
60Summary
1. Job displacement brings large PV earnings losses
Unemployment Rate in Mean PV Losses as Multiple
Displacement Year of Pre-Displacement Earnings (Men)
Less than 6% 1.4 Years
More than 8% 2.8 Years
Full Sample, 1980-2005 1.7 Years
2. Incidence of job loss & displacement rises in recessions and
slumps, especially severe ones
3. Job displacement leads to many other negative consequences
for workers and their families
4. Job loss is a rather inconsequential event in leading models of
unemployment fluctuations
– Off-the-shelf MP models do not account for magnitude of PV losses,
or the sensitivity to conditions at the time of displacement
– They miss why workers and policymakers are so concerned about job
loss, recessions and unemployment 61VI. Recent Work on Models
Designed to Explain the Earnings
Losses of Displaced Workers
62A Model of Jarosch (2015)
• A model of individual earnings, wage and employment
dynamics with search frictions and an exogenous
distribution of jobs on offer
• Workers search while employed and unemployed
• Individuals accumulate general human capital while
working, and human capital depreciates when not working
• Workers and firms bargain over wages, with threat point
defined by Max{value of unemployment, value of best offer
since last jobless spell}.
• Re-bargaining only when a credible threat is in hand
• Follows the sequential auction process of Postel-Vinay
and Robin (2002) and Cahuc et al. (2006)
• Key model innovation: Jobs differ with respect to
productivity and job security (i.e., expected time till
exogenous job destruction) 63Fitting and Evaluating the Model Jarosch fits his model by SMM to German data on: • E-E rates and the unemployment rate • Incidence of secondary job loss • Wage growth with tenure on a given job • Wage changes between jobs and between unemployment spells • Moments of the cross-sectional wage distribution He allows a flexible specification for the joint distribution of offers over productivity and job security. The fitted model largely accounts for the magnitude and persistence of earnings losses in the wake of job displacement in the German data. These losses are similar to the ones seen in U.S. data. 64
Job Loss Effects in German Data, Jarosch (2015)
Analysis of a 2% r.s. of German workers who held private sector jobs, 1974 to 2010,
using treatment and control group definitions and regression specifications that
parallel Davis and von Wachter (2011).

The magnitude and persistence of earnings losses in the wake of job displacement in the
German data are very similar to the U.S. data. The German data also allow for a
                                                                                65
clean distinction between (daily) wages and earnings.
Effects of Job Displacement on Workers:
Model Compared to Data
Earnings Wages
66Effects of Job Displacement on Workers:
Model Compared to Data
Employment Rate Separation Risk
67How the Model Works, 1 A Job Ladder with “Slippery” Lower Rungs Because the unemployed are not choosy when encountering a job opportunity, they are more willing to accept jobs that offer low job security (and low productivity). To a lesser extent, the same is true in expectation for recently re-employed workers. Eventually, workers move into jobs with high productivity and high job security, unless they are hit again by a job loss event. These dynamics result in a job ladder that is more “slippery” on its lower rungs, so that an initial layoff event raises the likelihood of secondary job loss after re- employment. This key mechanism prolongs the recovery path of earnings following an initial displacement event.68
How the Model Works, 2
Two Other Model Features Amplify the Wage and
Earnings Effects of Job Loss
1.Individuals accumulate general human capital while working, and
their human capital depreciates when out of work. Shortfalls in
human capital due to initial and secondary unemployment spells pull
down wages in a persistent manner (in expectation) after a job
displacement event.
2.The sequential auction process yields worker “negotiation rents”
that tend to rise with time since last jobless spell. Even when a
worker stays on his current job, an attractive outside offer lets him
negotiate a larger share of the rents. Thus, wages rise with time since
last jobless spell because the worker has had more time to find a
high-productivity job and because past offers enable him to obtain a
larger share of current match surplus.
                                                                   69
VI. Directions for Research
• Put human capital and job ladders into DMP
models
– Learning about match quality (Jovanovic, 1979) – a
type of human capital and one source of a job
ladder. See Krolikowski (2017) for a model of this
sort that aims to explain the earnings losses
associated with worker displacement.
– Climbing a job ladder defined by better jobs/bigger
share of match surplus (Burdett & Mortensen,
1998, Postel-Vinay and Robin, 2002, and Jarosch,
2015).
70Directions for Research, 2
– Learning by doing on the job + HC depreciation
when not working. Jarosch (2015) has elements
of HC accumulation and depreciation as well
• Ljungqvist and Sargent (1998) consider a model with
these features, but not in a DMP setting.
– Costly investments in job-specific training
(Becker, 1962)
– For a model with human capital, occupational
sorting by skill and endogenously determined,
and time-varying, hiring standards, see Huckfeldt
(2016).
71Directions for Research, 3
• Account for (other sources of) worker rents in
theoretical models and empirical studies of the
earnings losses associated with job loss
– Pay equity and fairness norms (Akerlof and Yellen, 1982)
– High pay to deter shirking (Bulow and Summers, 1986)
– Appropriation of quasi-rents on capital (Grout, 1986)
– Worker sharing of product market rents (Brown &
Medoff, 1989)
– Downward stickiness due to contracting and one-sided
commitment by firms (Beaudry and DiNardo, 1992)
• See Schmieder and von Wachter (2010) for evidence that wage
stickiness of this form is a feature of U.S. labor markets, and
that it helps explain which workers get displaced. 72Directions for Research, 4
• To what extent does the loss of imputed rents
account for the estimated PV earnings losses
associated with job displacement?
– Use estimated rent component of industry,
employer size, and union wage effects
• Why don’t wages fall (more) at firms that
undergo mass layoffs?
– There is astoundingly little work on this question,
given the size of the apparent earnings losses
associated with mass layoff events.
73Directions for Research, 5
• Turning the displaced worker literature upside-
down: What’s the impact on PV earnings of
(early) attachment to a firm that experiences
rapid, sustained growth?
• How do (anticipated) job displacement events
affect savings and portfolio allocation
behavior?
– See Gallen (2013) and Basten et al. (2013) for two
recent efforts to tackle this question.
74Directions for Research, 6
• Incorporating lessons from research on
graduating in a recession
– Workers who enter the labor market when
conditions are slack suffer persistent negative effects
on future earnings (Kahn, 2010)
– Lasting declines in employer quality and lasting
effects of low starting wages on wage growth within
firms (Oreopolous, von Wachter and Heisz, 2013)
– These results suggest that weak conditions at the
time of labor market entry (or displacement) slow
the accumulation of rents and specific human capital
for many years thereafter.
– Huckfeldt (2016) is relevant here. 75Directions for Research, 7
• Who recovers from displacement events? How
much explanatory power from “standard”
measures of skills, education and cognitive ability?
– Is there an important role for social networks (size and
character) in recovery from displacement? See Saygin,
Weber and Weynandt (2014).
– Do personality traits matter and, if so, how much?
• Resilience, optimism, perseverance, sociability, organizational
skills and practices, propensity to plan, attitudes, etc.
• How do perceptions of labor market conditions
affect behavior by individuals and employers?
76• Baker, Scott R., 2017. “Debt and Consumption Responses to Household Income Shocks,”
forthcoming in the Journal of Political Economy.
• Banzhaf, Melissa Ruby, 2013. “When It Rains, It Pours: Under What Circumstances Does Job Loss
Lead to Divorce?” Center for Economic Studies, U.S. Bureau of the Census.
• Basten, Christoph, Andreas Fagereng and Kjetil Telle, 2013. “Saving and Portfolio Allocation Before
and After Job Loss,” working paper.
• Bewley, Truman (1999) Why Wages Don’t Fall During a Recession. Cambridge, Massachusetts:
Harvard University Press.
• Binmore, Ken, Ariel Rubinstein, and Asher Wolinsky, 1986. “The Nash Bargaining SoluGon in
Economic Modelling,” Rand Journal of Economics, 17(2), 176--188.
• Bleakley, Hoyt, Ann E. Ferris and Jeffrey C. Fuhrer (1999) “New Data on Worker Flows During
Business Cycles,” New England Economic Review (July/Agust), 49-76.
• Boisjoly, Johanne, Greg J. Duncan and Timothy Smeeding (1998) “The Shifting Incidence of
Involuntary Job Losses from 1968 to 1992,” Industrial Relations, 37, no. 2 (April), 207-231.
• Black, Sandra E., Paul J. Dvereux and Kjell G. Salvanes, 2015. “Losing Heart? The Effect of Job
Displacement on Health,” ILR Review.
• Brown, Charles and James L. Medoff, 1989. “The Employer Size-Wage Effect,” Journal of Political
Economy, 97, no. 5 (October), 1027-1059.
• Burdett, Kenneth and Dale T. Mortensen, 1998. “Wage Differentials, Employer Size, and
Unemployment,” International Economic Review, 39, no. 2.
77• Burgard, Sarah A., Brand, Jennie E., and House James S. 2007. “Toward a Better Estimation of the
Effect of Job Loss on Health.” Journal of Health and Social Behavior, 48(4): 369–384
• Cahuc, Pierre, Fabien Postel-Vinay and Jean-Marc Robin (2006), “Wage Bargaining with On-the-
Job Search,” Econometrica, 74, no. 2, 323-364.
• Couch, Kenneth A. and Dana W. Placzek, 2010. “Earnings Losses of Displaced Workers Revisited,”
American Economic Review, 100, no. 1 (March), 572-589.
• Davis, Steven J. (2005) “Comments on ‘Job Loss, Job Finding and Unemployment in the U.S.
Economy over the Past 50 Years’ by Robert Hall,” NBER Macroeconomics Annual.
• Davis, Steven J., John C. Haltiwanger and Scott Schuh (1996) Job Creation and Destruction.
Cambridge, MA: The MIT Press.
• Davis, Steven J. and Till von Wachter (2011) “Recessions and the Costs of Job Loss,” Brookings
Papers on Economic Activity, Fall.
• Den Haan, Wouter, Garey Ramey and Joel Watson (2000) “Job Destruction and the Experiences of
Displaced Workers,” Carnegie-Rochester Conference Series on Public Policy, 52, 87-128.
• Flaaen, Aaron, Matthew D. Shapiro and Isaac Sorkin, 2017. “Reconsidering the Consequences of
Worker Displacements: Survey versus Administrative Measurements,” working paper.
• Frey, Bruno S. and Alois Stutzer, 2002. “What Can Economists Learn from Happiness Research?”
Journal of Economic Literature, 40, no 2 (June), 402-435.
• Gallen, Yana, 2013. “Anticipating Unemployment: Savings Evidence from Denmark,” working
paper
78• Gruber, Jonathan. 1997. “The Consumption Smoothing Benefits of Unemployment Insurance.”
The American Economic Review, 87(1): 192–205.
• Hagedorn, Marcus and Iourii Manovskii. 2008. “The Cyclical Behavior of Equilibrium
Unemployment and Vacancies Revisited.” American Economic Review, 98(4), 1692--1706.
• Hall, Robert E. and Edward P. Lazear (1984) “The Excess Sensitivity of Layoffs and Quits to
Demand,” Journal of Labor Economics, 2, no. 2, 233-257.
• Hall, Robert E. and Paul R. Milgrom, 2008, “The Limited Influence of Unemployment on the Wage
Bargain,” American Economic Review, 98(4), 1653--1674.
• Huckfeldt, Christopher, 2016. “Understanding the Scarring Effect of Recessions,” working paper.
• Jacobson, Louis S., Robert J. Lalonde and Daniel G. Sullivan (1993) “Earnings Losses of Displaced
Workers,” American Economic Review 83, no. 4: 685-709.
• Jarosch, Gregor, 2015. “Searching for Job Security and the Consequences of Job Loss,” University
of Chicago, downloadable at https://sites.google.com/site/gregorjarosch/research.
• Jung, Philip and Moritz Kuhn, 2017. “Earnings Losses and Labor Mobility over the Life-Cycle.”
• Krolikowski, Pawel Michal, 2017, “Job Ladders and Earnings of Displaced Workers,” American
Economic Journal: Macroeconomics, 9, no. 2, 1-31.
• Leighton, Linda and Jacob Mincer (1982) “Labor Turnover and Youth Unemployment,” in The
Youth Labor Market Problem: Its Nature, Causes and Consequences, edited by Richard Freeman
and David Wise. Chicago: University of Chicago Press.
79• Lindbeck, Assar and Dennis J. Snower (2002) “The Insider-Outsider Theory: A Survey,” IZA
Discussion Paper No. 534.
• Ljungqvist, Lars and Thomas Sargent, 1998. “The European Unemployment Dilemma,” Journal of
Political Economy, 106, no. 3 (June), 514-550.
• McLaughlin, Kenneth J. (1990) “General Productivity Growth in a Theory of Quits and Layoffs,”
Journal of Labor Economics, 8, no. 1 (January), 75-98.
• McLaughlin, Kenneth J. (1991) “A Theory of Quits and Layoffs with Efficient Turnover,” Journal of
Political Economy, 99, no. 1, 1-29.
• Mincer, Jacob (1986) “Wage Changes in Job Changes,” Research in Labor Economics, 8A, 171-197.
• Mortensen, Dale and Christopher Pissarides, 1994. “Job Creation and Job Destruction in the
Theory of Unemployment,” Review of Economic Studies, 61 (July), 397-415.
• Oreopoulos, Philip, Andrew Heisz and Till von Wachter, 2013. “Short- and Long-Term Career
Effects of Graduating in a Recession,” American Economic Journal: Applied Economics.
• Oreopoulos, Philip, Marianne Page and Ann Huff Stevens. 2008. "The Intergenerational Effects of
Worker Displacement." Journal of Labor Economics, 26(3): 455-483.
• Postel-Vinay, Fabien and Jean-Marc Robin, 2002. “Equilibrium Wage Dispersion with Worker and
Employer Heterogeneity,” Econometrica, 70, no. 6 (November), 2295-2350.
• Ruhm, Christopher J. (1991) “Are Workers Permanently Scarred by Job Displacements?” American
Economic Review 81, no. 1, 319-324.
80• Saygin, Perihan Ozge, Andrea Webert and Michele A. Weynandt, 2014. “Coworkers, Networks,
and Job Search Outcomes,” working paper, 13 May 2014.
• Schmieder, Johannes F. and Till von Wachter, 2010. “Does Wage Persistence Matter for
Employment Fluctuations? Evidence from Displaced Workers,” American Economic Journal:
Applied Economics, 2, no. 3, 1-21.
• Shimer, Robert, 2005. “The Cyclical Behavior of Equilibrium Unemployment and Vacancies,”
American Economic Review 95(1): 25-49.
• Stephens, Melvin Jr., 2004. “Job Loss Expectations, Realizations, and Household Consumption
Behavior,” Review of Economics and Statistics, 86, no.1 (February), 253-269.
• Stevens, A. H. (1997) “Persistent Effects of Job Displacement: The Importance of Multiple Job
Losses,” Journal of Labor Economics 15, 165-188.
• Sullivan, Daniel and Till von Wachter. 2009. “Job Displacement and Mortality: An Analysis using
Administrative Data.” Quarterly Journal of Economics Vol.124 (3): 1265-1306.
• Topel, Robert (1990) “Specific Capital and Unemployment: Measuring the Costs and
Consequences of Worker Displacment,” Carnegie-Rochester Conference Series on Public Policy, 33,
181-214.
• von Wachter, Till, Jae Song and Joyce Manchester. 2009. “Long-Term Earnings Losses due to Mass-
Layoffs During the 1982 Recession: An Analysis Using Longitudinal Administrative Data from 1974
to 2008.” Mimeo, Columbia University.
• Weiss, Andrew (1990) Efficiency Wages: Models of Unemployment, Layoffs and Wage Dispersion.
Princeton, New Jersey: Princeton University Press.
• Wightman, Patrick, 2009. The Effect of Parental Job Loss on Children. Ph.D. Dissertation, 81
University of Chicago, Irving B. Harris Graduate School of Public Policy Studies.You can also read