Post-Exercise Sweat Loss Estimation Accuracy of Athletes and Physically Active Adults: A Review - MDPI
←
→
Page content transcription
If your browser does not render page correctly, please read the page content below
sports
Review
Post-Exercise Sweat Loss Estimation Accuracy of
Athletes and Physically Active Adults: A Review
Eric O’Neal 1, *, Tara Boy 1 , Brett Davis 2 , Kelly Pritchett 3 , Robert Pritchett 3 ,
Svetlana Nepocatych 4 and Katherine Black 5
 1    Department of Kinesiology, University of North Alabama, Florence, AL 35633, USA; tgoldman@una.edu
 2    Department of Kinesiology, Auburn University at Montgomery, Montgomery, AL 36166, USA;
      bdavis56@aum.edu
 3    Department of Health Sciences, Central Washington University, Ellensburg, WA 98926, USA;
      Kelly.Pritchett@cwu.edu (K.P.); Robert.Pritchett@cwu.edu (R.P.)
 4    Department of Exercise Science, Elon University, Elon, NC 27244, USA; snepocatych@elon.edu
 5    Department of Human Nutrition, University of Otago, Dunedin 9054, New Zealand;
      katherine.black@otago.ac.nz
 *    Correspondence: eoneal1@una.edu

 Received: 23 May 2020; Accepted: 5 August 2020; Published: 11 August 2020

 Abstract: The main purposes of this review were to provide a qualitative description of nine
 investigations in which sweat losses were estimated by participants following exercise and to perform
 a quantitative analysis of the collective data. Unique estimations (n = 297) were made by 127 men and
 116 women after a variety of exercise modalities in moderate to hot environmental conditions. Actual
 sweat loss exceeded estimated sweat loss (p < 0.001) for women (1.072 ± 0.473 vs. 0.481 ± 0.372 L), men
 (1.778 ± 0.907 vs. 0.908 ± 0.666 L) and when all data were combined (1.428 ± 0.806 vs. 0.697 ± 0.581 L),
 respectively. However, estimation accuracy did not differ between women (55.2 ± 51.5%) and men
 (62.4 ± 54.5%). Underestimation of 50% or more of sweat losses were exhibited in 168 (54%) of
 estimation scenarios with heavier sweaters displaying a higher prevalence and trend of greater
 underestimations in general. Most modern guidelines for fluid intake during and between training
 bouts are based on approximate sweat loss estimation knowledge. These guidelines will likely have
 minimal efficacy if greater awareness of how to determine sweat losses and accurate recognition of
 sweat losses is not increased by coaches and athletes.

 Keywords: hydration strategies; team sports; endurance; fluid balance; sweat

1. Introduction
     Over the last two and a half decades, multiple scientific cohorts and conclaves have devoted
extensive efforts to provide physically active individuals with robust guidelines for fluid intake
strategies during and in the times between training bouts [1–7]. While some viewpoints have
contended that thirst is an adequate indicator and stimulus for proper fluid consumption [6,8],
most other guidelines include detailed recommendations for ideal fluid intake practices based on
approximate estimates of sweat losses that will be incurred [1,3,4,7]. There is no lack of original
research concerning hydration and physical activity, but one article in particular, Passe et al. [9], piqued
the interest of the current authors in regards to whether the more nuanced guidelines have pragmatic
value in real world practice.
     Passe et al. [9] reported that during a 16-km run trained runners severely under replaced
sweat losses with fluid intake (replacing 30.5% ± 18.1% of sweat loss) in comparison to formal
contemporary hydration recommendations of that period suggesting fluid intake match sweat losses [1].

Sports 2020, 8, 113; doi:10.3390/sports8080113                                      www.mdpi.com/journal/sports
Sports 2020, 8, 113 2 of 12
This occurred despite fluid intake opportunities that were designed to be as accommodating as possible.
The recommendation of complete fluid replacement during exercise [1] that the investigators used to
interpret the adequateness of fluid consumption has since been deemed excessive and that body mass
loss during exercise should occur [4]. However, to our knowledge Passe et al. [9] also presented the
first evidence that reported athletes’ perceptions of sweat losses, with an average underestimation of
sweat loss volume of ~43%. Beverage intake adequateness changes drastically if replacement volume
is viewed from the standpoint of the runners’ perceived sweat loss volume. This finding is revelatory
but almost universally disregarded when discussing the efficacy of nearly all contemporary, formal
hydration guidelines that base fluid replacement recommendations on individual sweat loss volume.
Since the seminal article that reported sweat loss estimation accuracy, multiple attempts to
document athletes’ perception of sweat loss volume have been undertaken in the current authors’
respective laboratories. However, there has been no formal review of these sweat loss estimation
investigations. The two primary purposes of this review will be to provide a single, concise literature
overview source of sweat loss estimation investigations and combine individual data from these
studies for a comprehensive descriptive analysis of athletes’ sweat loss estimation accuracy in field
and laboratory settings. A tertiary aim was to offer some brief, real world application considerations
based on these findings for coaches, athletes and sport medicine staff.
2. Methods
The lead author initiated communications with all authors of investigations that had cited his
original sweat loss estimation study [10] and collected original sweat loss estimation data in their
respective publications. Although not a formal systematic review, each author then completed their
own individual search of literature that cited their original sweat loss estimation studies. No additional
published articles were discovered. Data from nine published investigations [10–18] in which sweat loss
was estimated were shared by current authors through personal communication. A new spreadsheet
database was created for comprehensive analysis. Data included a description of participants (age,
sex and training background) and physical activity conditions (exercise modality, environmental
conditions and duration of exercise). Additionally, pre-activity body mass, post activity body mass,
fluid intake and void output (if applicable) were used to calculate actual sweat loss, post-exercise
estimated sweat loss volume and sweat loss as a percent of body mass. Sweat loss was calculated as
change from pre- to post-exercise body mass with adjustment for fluid intake or urine production
and under the assumption that 1 kg of body mass change was equal to 1 L of sweat loss. The authors
recognize that sweat loss is more complex than this simple model due to the presence and density of
electrolytes and metabolites found in sweat [19] and respiratory water and gas exchanges related to
metabolic processes [20]. However, due to the variety of exercise modalities and duration of exercise
for most of the investigations, the authors have chosen to represent sweat loss volume in liters as
equivalent to change in body mass in kilograms.
Each investigation is summarized in Table 1. Two running studies [11,18] and one basketball
study [12] incorporated designs in which sweat loss estimations were made twice by the same
participants during separate training sessions. In these studies, participants were not informed of their
actual sweat losses until after study completion. Thigpen, Green and O’Neal [12] examined sweat
loss estimation in short conditioning practices and longer, in-season practices, and Davis et al. [18]
looked at sweat loss estimation during treadmill running under temperate versus hot conditions.
Both of these studies subcomponents are presented in separate rows in Table 1 due to the dramatic
difference in testing conditions. The findings of Shaver et al. [11] are not presented in two rows due
to the consistency in exercise modality, duration and environmental conditions. Muth et al. [16] also
incorporated multiple sweat loss estimations within subjects, but participants were informed of their
sweat loss volume after the first estimation session. Thus, only first sweat loss estimation accuracy
scores are presented in Table 1 for [16], but data has been presented separately for male and female
rugby players.Sports 2020, 8, 113 3 of 12
Table 1. Synopsis of sweat loss estimation investigations.
Participants Exercise Condition Sweat Loss
Sex = n Modality: Duration (M ± SD; Range) Actual (L)
Study
Age (Years) Environmental Conditions (M ± SD; Range) Predicted (L); Prediction Method
Training Status Sweat Loss as % of Body Mass % of Actual
F = 18 M = 3 Hot Hatha yoga; 60 min 0.814 ± 0.539
Campbell et al. (2017) [15] 33 ± 11 Dry = 38.7 ± 2.7 ◦ C Relative humidity = 35.8 ± 13.3% 0.512 ± 0.335; 1000 mL bottles
Recreational 1.11 ± 0.57% 72.5 ± 49.0%
F = 20 M = 30 CrossFit™ ; 34.3 ± 5.5 min 0.746 ± 0.305
Cronin et al. (2016) [14] 30 ± 9 WBGT = 20.1 ± 2.8; 16.0–22.7 ◦ C 0.655 ± 0.404; 250 mL bottles
Recreational 0.91 ± 0.31% 96.0 ± 60.8%
M = 12 Treadmill running-temperate environment; 60 min 1.348 ± 0.282
Davis et al. (2019) [18] A 22 ± 2 WBGT = 18.1 ± 0.2 ◦ C 0.793 ± 0.333; paper race cups
Recreational 1.72 ± 0.29% 60.5 ± 26.6%
M = 12 Treadmill running-hot environment; 60 min 1.907 ± 0.529
Davis et al. (2019) [18] B 22 ± 2 WBGT = 25.6 ± 0.5 ◦ C 1.198 ± 0.550; paper race cups
Recreational 2.43 ± 0.56% 66.7 ± 35.4%
F = 20 M = 19 Outdoor running: 59.14 ± 3.46 min 1.468 ± 0.484
O’Neal et al. (2012) [10] 41 ± 11 WBGT = 24.1 ± 1.5; 21.3–27.7 ◦ C 0.738 ± 0.470; paper race cups
Recreational to collegiate 2.11 ± 0.52% 50.4 ± 23.0%
F = 23 (2 trials) Outdoor running 15-km time trial; 79.98 ± 7.00 min 1.306 ± 0.307
Shaver et al. (2018) [11] 26 ± 6 WBGT = 20.0 ± 2.8; 12.8–25.6 ◦ C 0.498 ± 0.516; water bottle reference
Recreational 2.20 ± 0.48% 39.9 ± 40.9%
F = 8 M = 12 Outdoor running; 59.91 ± 3.42 min 1.374 ± 0.423
O’Neal et al. (2014) [13] 20 ± 2 WBGT = 20.1 ± 2.8; 16.0–22.7 ◦ C 0.697 ± 0.600; paper race cups
Recreational to collegiate 1.96 ± 0.51% 50.1 ± 39.1%
Collegiate basketball conditioning practice; F = 1.112 ± 0.271 M = 0.969 ± 0.250
F = 11 M = 11
(F = 95 min, M = 46 min) F = 0.394 ± 0.242 M = 1.316 ± 0.847; standard practice
Thigpen et al. (2014) [12] A 20 ± 1
WBGT F = 20.4, M = 20.0 ◦ C water bottle
NCAA Division II
F = 1.47 ± 0.27, M = 1.13 ± 0.27% F = 37.5 ± 28.3 M = 142.6 ± 102.4%
Collegiate basketball in-season practice; (F = 170 min, F = 1.910 ± 0.441 M = 2.471 ± 0.495
F = 11 M = 11
M = 170 min) F = 0.632 ± 0.284 M = 1.740 ± 1.201; standard practice
Thigpen et al. (2014) [12] B 20 ± 1
WBGT F = 18.5; M = 17.2 ◦ C water bottle
NCAA Division II
F = 2.53 ± 0.43, M = 2.90 ± 0.50% F = 35.1 ± 20.1 M = 70.6 ± 56.9%
F = 16 Outdoor rugby practice; 95 min 0.928 ± 0.446
Muth et al. (2019) [16] A 20 ± 1 Dry = 11.0 ± 1.4 ◦ C Relative humidity = 57.5 ± 3.5% 0.335 ± 0.243; 532 mL cup
NCAA Rugby Union 1.19 ± 0.55% 53.0 ± 69.2%
M = 20 Outdoor rugby practice; 90 min 1.917 ± 0.516
Muth et al. (2019) [16] B 20 ± 1 Dry = 8.5.0 ± 2.1 ◦ C Relative humidity = 46.5 ± 9.2% 0.373 ± 0.183; 532 mL cup
NCAA Rugby Union 2.00 ± 0.54% 20.9 ± 12.5%
M = 20 Outdoor rugby practice; 120 min 3.291 ± 0.948
Love et al. (2018) [17] 25 ± 4 Dry = 35.0 ◦ C Relative humidity = 40% 0.898 ± 0.575; 532 questionnaire
Professional 3.2 ± 0.9% 27.4 ± 17.2%
Abbreviations: F = Female, M = Male, NCAA = National Collegiate Athletic Association, WBGT = Wet Bulb Global Temperature. A, B = sub sets of data from same study.Sports 2020, 8, 113 4 of 12
Statistical Analysis
Following testing for equal variance, independent samples t test were used to analyze differences
between sexes for age, weight, duration of exercise, sweat loss (absolute and as percent body mass)
and sweat loss estimation accuracy. Dependent t tests were used to compare absolute and estimated
sweat losses within each sex and for all data combined. Three scatterplots were prepared using data
from all studies. In the first scatterplot, estimated sweat loss ((estimated sweat loss/actual sweat loss)
× 100) is plotted relative to actual sweat loss. The second and third plotted sweat loss estimation
accuracy as a percentage against sweat loss as a percent body mass ((sweat loss/body mass) × 100) with
markers identifying participants by study or by sex. Additionally, a contingency table was prepared
to categorize outcomes from the scatterplots. All data were analyzed and figures were created using
Microsoft Excel. Because of the large sample size, an alpha of 0.01 was selected a priori. All data are
presented as mean ± SD.
3. Results
The nine studies included 243 participants (males = 127; females = 116) and produced 297 unique
samples (Table 1). All participants were at least 18 years of age and varied in experience from
recreational exercisers to professional athletes (Table 1). Exercise modalities included hot yoga, running,
rugby, basketball and CrossFit™ training (Table 1). Female particpants exhibited lower (p < 0.001)
body masses, sweat loss as a percent body mass, absolute sweat losses and sweat loss estimations
than male participants despite no difference in exercise duration (Table 2). Actual sweat losses were
approximately double the estimated sweat loss volumes and significantly differed for female, male and
all participants, but there were no significant differences in the accuracy of predictions by percentage
between male and female participants (Table 2). Table 3 and Figures 1–3 collectively further highlight
the high prevalence of underestimation with participants experiencing greater absolute and relative
sweat losses more heavily underestimating sweat loss volume.
Table 2. Cumulative comparisons of sweat loss estimation variables for all participants and by sex
(mean ± SD).
Female (n = 147 *) Male (n = 150 **) All (n = 297)
Age (years) 27.3 ± 9.7 26.4 ± 9.6 26.8 ± 9.7
Weight (kg) 66.2 ± 11.1 87.1 ± 13.5† 76.7 ± 16.2
Exercise duration (min) 77 ± 33 74 ± 38 75 ± 36
Sweat loss
% body mass 1.64 ± 0.71 2.04 ± 0.92 † 1.84 ± 0.84
Absolute (L) 1.072 ± 0.473 ‡ 1.778 ± 0.907 †‡ 1.428 ± 0.806 ‡
Estimated (L) 0.481 ± 0.372 0.908 ± 0.666 † 0.697 ± 0.581
Accuracy (%) 55.2 ± 51.5 62.4 ± 54.5 58.9 ± 53.1
* = 147 estimations were made by 116 female participants. ** = 150 estimations were made by 127 male participants.
† = p < 0.001 for comparison between sexes. ‡ = p < 0.001 for comparison made between estimated and actual sweat
loss volume.Sports 2020, 8, x FOR PEER REVIEW 6 of 13
Table 3. Contingency table for sweat loss estimation accuracy comparisons (values = n (% of total
sample)).
Sports 2020, 8, 113 5 of 12
Absolute Volume Comparisons
Estimated Actual Sweat Loss (L)
Table 3. Contingency table for sweat loss estimation accuracy comparisons (values = n (% of
Sweat Loss (L)
total sample)). 0–1 1–2 2–3 3+
0–1 82 (27)Absolute122 (41) Comparisons
Volume 29 (9) 12 (4)
1–2 7 (2) Actual
22Sweat
(7) Loss (L)9 (3) 5 (1)
Estimated Sweat Loss (L)
2–3 0–1 1 (0.3) 1–2 3 (1) 2–3 4 (1) 3+
0 (0)
0–1 82 (27) 122 (41) 29 (9) 12 (4)
3+ 0 (0) 0 (0) 1 (0.3) 0 (0)
1–2 7 (2) 22 (7) 9 (3) 5 (1)
2–3 1 (0.3) 3 (1) 4 (1)
Relative comparisons 0 (0)
3+ 0 (0) 0 (0) 1 (0.3) 0 (0)
Sweat loss as a % of body mass
Estimation accuracy (%) Relative comparisons
0–1 Sweat loss 1–2 2–3
as a % of body mass 3+
Estimation accuracy (%)
0–50 0–1 17 (5) 1–274 (24) 2–355 (18) 22 (7)
3+
0–50
50–100 17 (5) 16 (5) 74 (24)
33 (11) 55 (18)
21 (7) 227(7)
(2)
50–100 16 (5) 33 (11) 21 (7) 7 (2)
100–150
100–150 10 (3) 10 (3) 17 (5)17 (5) 4 (1)4 (1) 3 3(1)(1)
150+ 12 (4) 4 (1) 2 (0.6) 0 (0)
150+ 12 (4) 4 (1) 2 (0.6) 0 (0)
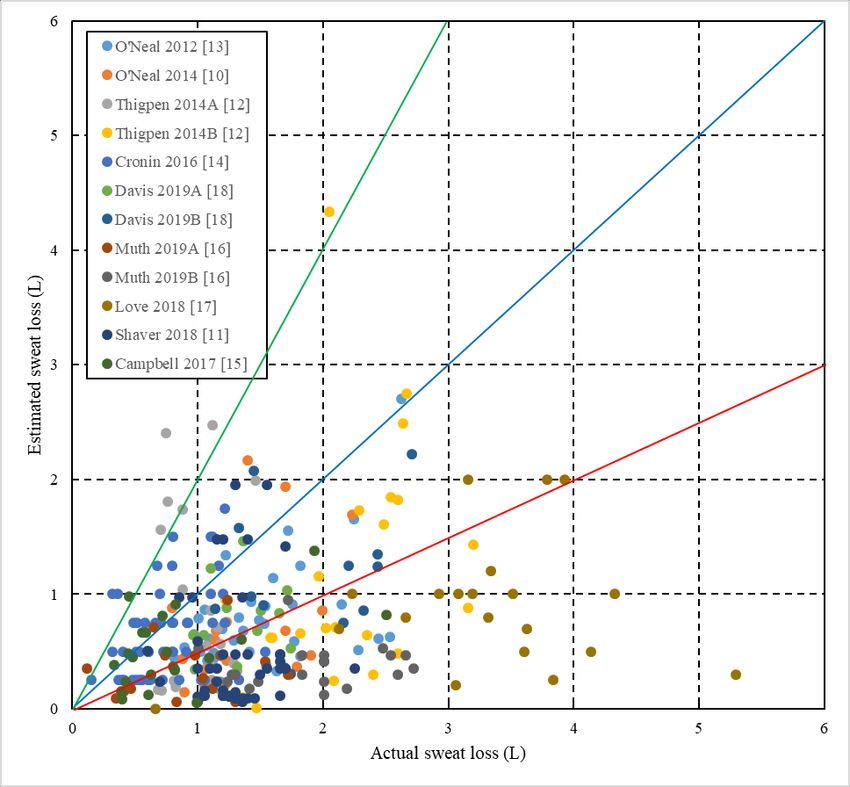
Figure 1. Individual(n(n= =
1. Individual 297) sweat
297) loss
sweat estimations
loss versus
estimations actual
versus sweat
actual losses
sweat across
losses all studies.
across The
all studies.
middle blueblue
The middle lineline
represents 100%
represents 100%accuracy
accuracyininprediction.
prediction.Markers
Markers below the
thered
redline
linerepresent
represent 50%
50% or
or greater
greater underestimation.
underestimation. Markers
Markers above
above the green
the green line represent
line represent 50% or50% or overestimation.
greater greater overestimation.
Dashed,
Dashed, vertical
vertical and and horizontal
horizontal linesabsolute
lines separate separateandabsolute and sweat
estimated estimated sweat loss
loss volumes intovolumes into 1 L
1 L increments.
increments.Sports 2020, 8, 113 6 of 12
Sports 2020, 8, x FOR PEER REVIEW 7 of 13
2. Relationship
Figure 2. Relationship between
between sweat
sweat loss
loss presented
presented as
as aa percentage
percentage of body mass and sweat loss
accuracy (%)
estimation accuracy (%) (n
(n =
= 297)
297) across
across all studies with coded identification by study.
3. Relationship
Figure 3. Relationship between
between sweat
sweat loss
loss presented
presented as
as percentage
percentage ofof body
body mass loss
mass and sweat loss
estimation accuracy (%) (n =
= 297) across
297) across all studies with coded identification by sex.
4. Discussion
The first aim of this paper was to provide a review of the authors’ individual investigations
concerning sweat loss estimation accuracy under a variety of exercise modalities and environments
in a single source (Table 1). The second goal was to determine if sweat loss estimation trends acrossSports 2020, 8, 113 7 of 12
4. Discussion
The first aim of this paper was to provide a review of the authors’ individual investigations
concerning sweat loss estimation accuracy under a variety of exercise modalities and environments
in a single source (Table 1). The second goal was to determine if sweat loss estimation trends across
multiple conditions were consistent when viewed from a more global perspective. Vast efforts have
been made by the scientific community to promote hydration strategies centered on the recognition of
individual sweat rates [1,3,4,7]. However, data from the current study indicate athletes and adults
engaging in exercise underestimate sweat losses by around 40–50%. Long distance runners are
potentially the most likely population of athletes that could benefit from knowing their sweat loss
due to the duration and environmental conditions encountered in competition, but survey literature
has repeatedly confirmed that runners are unlikely to be knowledgeable about or use their actual
sweat rates to determine fluid intake [21–23]. In regards to our second objective, cumulative data
(Tables 2 and 3 and Figures 1–3) provide overwhelming clarity that the vast majority of athletes and
physically active adults underestimate sweat loss in temperate to hot environments regardless of sex
or exercise modality.
It is important to recognize a potential overestimation interpretation bias in individual studies
(Table 1). The nature of estimating sweat loss dictates significant outliers are only possible in the
direction of overestimation which has no ceiling, while underestimation has a floor of 0%. This structure
allows outliers in the smaller samples of individual studies to have greater capacity to pull the mean
in the overestimation direction. Considerable overestimation was also almost exclusively limited to
conditions in which sweat losses were absolutely or relatively low. This trend is exemplified by viewing
Figure 2 where 16 of 183 (8.7%) overestimations exceeding 150% of sweat loss were for individuals that
lost less than 2% of their body mass. Comparatively, only 2 of 114 (1.8%) participants whose sweat
loss exceeded 2% body mass overestimated losses in excess of 150%. The color coding in Figures 1
and 2 identifies that 13 of the 18 overestimations >150% were from conditions in which very high
intensity exercise was undertaken during a short activity bout including a CrossFit™ workout [14] and
a 46 min collegiate men’s basketball team conditioning practice [12]. Combined with less opportunity
for convective induced sweat loss evaporation, these outlier overestimations likely explain why these
two study conditions present the two highest estimation accuracy or overestimation averages (Table 1).
Fluid intake greatly exceeding sweat losses increases chance of developing hyponatremia and
is a critical but possibly overlooked driving force for fluid intake guidelines during exercise being
based on individual sweat rate. Although complicated by relative body mass and other factors such as
longer average finish times during endurance competition, female endurance athletes are more likely
to experience exercise associated hyponatremia [6]. Profiles of women undertaking light to moderate
exercise intensity in hot conditions and consuming fluids greatly exceeding sweat loss [24,25] even to
the point of symptomatic hyponatremia (defined as a serum sodium 150% were
made by women (Figure 3). There is no visual trend supporting that significant overestimation of sweat
loss is greater in physically active women versus men (Figure 3), indicating that overestimation of
sweat loss is not the reason for higher fluid intakes and rates of hyponatremia amongst active females.
Using education to alter hydration behavior has resulted in equivocal outcomes [27–29]. A total
of nine runners in O’Neal et al. [10] reported previously measuring change in body mass to determine
sweat loss volume before study initiation. However, these participants were no better at estimating
their sweat losses after a 1 h run in warm weather than the remaining 30 runners who were unaware
this method could be used to determine sweat losses. Runners’ sweat loss estimates also showed no
difference before or after the run. Only one investigation incorporated a design in which participants
were made aware of sweat losses to determine if they could improve estimation accuracy over time.Sports 2020, 8, 113 8 of 12
Muth et al. [16] reported underestimation accuracy improving from 81 ± 13 (practice 1) to 38 ± 30%
(practice 3) for male, collegiate rugby player. Female athletes in the same study improved from 64 ± 71
to 43 ± 37% underestimation accuracy from practice 1 to practice 2, but fell back to 60 ± 212% on
practice 3. The 3rd highest overestimation presented from any study in Figure 2 came from this female
cohort [16], and as described above, a few very high overestimations skewed the capacity for growth
in estimation accuracy. It is also important to note that regardless of sex or education on sweat losses,
the rugby players still overwhelmingly chose estimations below actual sweat losses. During two
separate 15-km runs in similar environments with no feedback on sweat losses during the initial run
session, Shaver et al. [11] reported no differences in absolute sweat loss or estimation accuracy between
runs. Although not reported in the original paper, the current authors reevaluated the data used in the
current study and found a strong relationship between sweat loss estimations for the first and second
runs (intraclass correlation = 0.89, p < 0.001) further indicating participants’ perceptions of sweat
losses were consistent. In the only other repeated measures design study where exercise modality and
duration were held constant, sweat loss estimation accuracy by percentage was found to not differ
between temperate versus hot environment treadmill runs of 60 min [18].
Despite what is most likely the sample with the greatest resources to nutritional education and the
only study with professional athletes, Love et al. [17] found elite rugby players displayed no distinctive
edge in estimating sweat losses compared to recreational or collegiate athletes (Table 1, Figures 1 and 2).
To the contrary, the average underestimation percentage was higher than all other studies excluding
the group of collegiate, male rugby players (Table 1). Further, the magnitude of the difference between
measured and estimated sweat loss was not different between those who self-reported using hydration
monitoring strategies during and between training sessions and those who did not. No player reported
using change in body mass pre- to post-practice or between practices as a hydration monitoring
technique, likely explaining the lack of differentiation between groups’ sweat loss estimation accuracy.
Urine color was reported to be utilized to determine pre-practice hydration by 78% of players that
used a hydration monitoring technique. Urine color can generally be a reliable indicator of significant
dehydration in real time during prolonged exercise in the heat [30], but provides no quantitative sweat
loss volume information. Urine color and change in body mass from practice to practice are techniques
athletes and coaching or sport medicine staff use to assess hydration status in team sports, but the
authors are unaware of any literature supporting intentional recognition of sweat rate as a method
incorporated for team sport athletes as a common practice.
The final aim of this study was to provide a connection from current findings to real world practice.
The current authors suggest the first consideration is determining if sweat loss assessment practices are
actually warranted. If so, the next step is to determine if the sweat loss estimation information collected
will be used in the context of developing strategies concerned with fluid intake during exercise or
between training bouts. In regards to fluid consumption during exercise, sweat rate information is
mostly irrelevant for the vast majority of physical activity scenarios. Adults engaging in recreational
exercise are highly likely to consume enough fluid during training and experience sweat losses low
enough that they are unlikely to experience a loss in body mass exceeding the 2% threshold that
is commonly proposed to be associated with performance impairment [14,15,31]. When given free
access to beverages, the majority of team sport athletes will also drink ad libitum at a rate sufficient
to prevent severe dehydration ad libitum [12,32,33]. Collectively, ad libitum fluid consumption does
not appear to degrade performance of endurance athletes training or competing for durations of
60–120 min bouts [34]. However, there are likely many individual endurance athletes that could
potentially benefit from adjusting fluid intake strategies based on knowledge of expected sweat losses,
particularly those of longer durations [35,36]. Although only anecdotal, following the O’Neal et al. [10]
study investigators received unsolicited notifications from multiple participants expressing personal
best events in long distance running or triathlon events after altering fluid intake patterns based on
recognition of their actual sweat rates. All of these individuals greatly underestimated their sweat
losses during the 1-h run in warm environmental conditions of the study. While assessing approximateSports 2020, 8, 113 9 of 12
sweat loss does not require great technical skills and the only equipment needed is a calibrated scale,
the current authors contend this process is only necessary for during exercise fluid intake strategy
preparation if (1) exercise conditions will incur sweat losses greatly exceeding 2% body mass (e.g., half
marathon participation in warm environmental conditions) or (2) to prevent overconsumption of fluids
during events that might lead to exercise associated hyponatremia (e.g., a 5 h marathon finish in cool
environmental conditions). It is also paramount that individuals recognize their sweat rate can be
affected by change in environmental conditions, acclimatization and state of training.
Recognizing sweat loss volume to improve between training bout fluid intake has a more universal
appeal. Carrying fluids on oneself and drinking while running can be more difficult than in team sport
settings that include regular pauses in activity. Competitive runners and endurance athletes are also
apt to train more than once in a 24-h period. For these reasons our laboratories have made multiple
efforts to examine ad libitum hydration behavior, fluid dynamics and practical hydration marker
validity for ~12 h following runs that produce significant sweat losses [13,18,37,38]. Change in absolute
body mass from one training session to the next is commonly promoted in field settings as method
to assess hydration status. However, this technique may not be a great indicator of adequate fluid
replacement between training bouts. Davis and colleagues [37] reported that trained runners’ body
masses differed by only ~0.5 kg the following morning after a 75 min evening run in hot conditions
despite metered beverage intake replacing 75% (1637 ± 372 mL) versus 150% (3099 ± 850 mL) of sweat
losses throughout the recovery period. The runners’ next morning performance 10-km time trials
were impaired by 3% during the 75% versus 150% fluid replacement trials, and pre-run urine specific
gravity was 0.012 units higher for 75% fluid replacement [37]. We have recently demonstrated that
runners’ ad libitum rehydration efforts following runs are consistent within runners even between
temperate and hot training conditions [18], and that high urine specific gravity is a strong indicator
of inadequate fluid intake between training sessions separated by ~12 h, particularly if sweat losses
exceed 3% body mass [39]. Sports medicine staff for endurance athlete teams might consider periodic
pre-practice urine specific gravity assessment to identify athletes that consistently fail to adequately
consume fluids between practices. Staff could then move to assess and educate athletes most needing
increased recovery fluid intake strategy modifications based on sweat loss volume during training.
This approach may also help mitigate the stressors of regularly weighing in for endurance athletes that
may suffer from body dysmorphia issues. For the many endurance athletes training without sports
medicine staff supervision, the recognition of sweat loss and self-assessment of fluid intake during
recovery using metered beverage bottles can help confirm the adequacy of individual between training
bout hydration strategies without the need for expensive equipment or technical expertise.
Team sport practice studies described in Table 1 [12,16,17] provide evidence that considerable
sweat losses can be expected during formal collegiate or professional team practices. Further inquiry
into each of these three studies also reveals vast cases of athletes with high urine specific gravity
values associated without inadequate fluid replacement between practices [39]. As also suggested for
endurance sport teams, the authors recommend that multiple sport urine specific gravity evaluations
can used to expediently determine which team athletes may be in most need of further guidance to
improve between training bout fluid intake. Once identified the extra step of determining approximate
sweat losses per practice for those athletes indicating most need for intervention can be initiated.
Team sport athletes can drink significant volumes of fluid during practice [12,16,17] which may make
the sweat loss estimation process a little more complex and highlights the need to selectively incorporate
this approach for time and staff efficiency with large teams. Many team sport athletes have individual
bottles assigned to drink out of during practices. Thigpen and colleagues [12] asked basketball players
in their study to estimate their sweat loss volume by filling the actual model of sport bottles they used
during practice and carry with them throughout their day. The authors followed up their investigation
with a well-received hydration education forum for the team in which the athletes were given their
sweat loss information and the volumes of sweat loss were visually demonstrated using their ownSports 2020, 8, 113 10 of 12
sport bottles. Helping athletes visualize their sweat loss volume may be an effective educational
approach on hydration.
Sweat loss estimation accuracy was a secondary aim for Passe et al. [9] and almost all of the
investigations presented in Table 1. However, together these studies provide significant practical
insight into the mindset of the target populations when designing fluid intake guidelines for athletes
and physically active individuals. Collective analysis of the nine investigations included in this
review provide compelling evidence that physically active adults cannot accurately estimate their
sweat losses in ecologically valid scenarios (e.g., team practices, outdoor runs, fitness classes, etc.)
if environmental conditions are temperate or hot. The overwhelming error direction is skewed toward
underestimation of sweat losses. This tendency is not specific to sex or exercise type. Before sweat
loss evaluation protocols are implemented coaches or athletes should take into consideration if their
training regimen is expected to produce significant sweat loss or if exercise associated hyponatremia is
a practical concern for the event or training session. In large team settings, it may be more feasible
or efficacious to focus efforts on athletes that consistently report to practice with considerable loss
in body mass between practices or repeatedly manifest other markers (e.g., elevated urine specific
gravity values) indicative of chronic pre-exercise hypohydration. There is no empirical evidence that
individuals will alter their fluid intake strategies upon recognition of accurate sweat loss information.
It is also apparent that study participants were not basing their fluid intake during or between training
bouts on the volume of sweat they believe they are losing during training. Current findings should
be interpreted with these considerations in mind, and also recognize that there is a dearth of data
concerning professional athletes. The authors hope these findings will be considered in development
of future hydration guidelines.
Author Contributions: Conceptualization, E.O., T.B., B.D., K.P., R.P., S.N. and K.B.; methodology, E.O., T.B., B.D.,
K.P., R.P., S.N. and K.B.; formal analysis, E.O., T.B., B.D., K.P., R.P., S.N. and K.B.; data curation, E.O., T.B., B.D.,
K.P., R.P., S.N. and K.B.; writing—original draft preparation E.O. and T.B.; writing—review and editing, B.D., K.P.,
R.P., S.N. and K.B. All authors have read and agreed to the published version of the manuscript.
Funding: No funding was contributed to any investigators for the completion of this project.
Conflicts of Interest: The authors declare no conflict of interests with contents of the manuscript.
References
1. Convertino, V.A.; Armstrong, L.E.; Coyle, E.F.; Mack, G.W.; Sawka, M.N.; Senay, L.C., Jr.; Sherman, W.M.
American College of Sports Medicine position stand. Exercise and fluid replacement. Med. Sci. Sports Exerc.
1996, 28, i–vii. [CrossRef] [PubMed]
2. Casa, D.J.; Armstrong, L.E.; Hillman, S.K.; Montain, S.J.; Reiff, R.V.; Rich, B.S.; Roberts, W.O.; Stone, J.A.
National Athletic Trainers’ Association position statement: Fluid replacement for athletes. J. Athl. Train.
2000, 35, 212–224. [PubMed]
3. Sawka, M.N.; Burke, L.M.; Eichner, E.R.; Maughan, R.J.; Montain, S.J.; Stachenfeld, N.S. American College of
Sports Medicine position stand. Exercise and fluid replacement. Med. Sci. Sports Exerc. 2007, 39, 377–390.
[PubMed]
4. McDermott, B.P.; Anderson, S.A.; Armstrong, L.E.; Casa, D.J.; Cheuvront, S.N.; Cooper, L.; Kenney, W.L.;
O’Connor, F.G.; Roberts, W.O. National Athletic Trainers’ Association position statement: Fluid replacement
for the physically active. J. Athl. Train. 2017, 52, 877–895. [CrossRef] [PubMed]
5. Cotter, J.D.; Thornton, S.N.; Lee, J.K.; Laursen, P.B. Are we being drowned in hydration advice? Thirsty for
more? Extrem. Physiol. Med. 2014, 3, 18. [CrossRef] [PubMed]
6. Hew-Butler, T.; Rosner, M.H.; Fowkes-Godek, S.; Dugas, J.P.; Hoffman, M.D.; Lewis, D.P.; Maughan, R.J.;
Miller, K.C.; Montain, S.J.; Rehrer, N.J.; et al. Statement of the 3rd international exercise-associated
hyponatremia consensus development conference, carlsbad, california, 2015. Br. J. Sports Med. 2015, 49,
1432–1446. [CrossRef] [PubMed]Sports 2020, 8, 113 11 of 12
7. McCubbin, A.J.; Allanson, B.A.; Caldwell Odgers, J.N.; Cort, M.M.; Costa, R.J.S.; Cox, G.R.; Crawshay, S.T.;
Desbrow, B.; Freney, E.G.; Gaskell, S.K.; et al. Sports Dietitians Australia position statement: Nutrition for
exercise in hot environments. Int. J. Sport Nutr. Exerc. Metab. 2020, 30, 1–16. [CrossRef]
8. Noakes, T.D.; Speedy, D.B. Time for the american college of sports medicine to acknowledge that humans,
like all other eartly creatures, do not need to be told how much to drink during exercise. Br. J. Sports Med.
2007, 41, 109–111.
9. Passe, D.; Horn, M.; Stofan, J.; Horswill, C.; Murray, R. Voluntary dehydration in runners despite favorable
conditions for fluid intake. Int. J. Sport Nutr. Exerc. Metab. 2007, 17, 284–295. [CrossRef]
10. O’Neal, E.K.; Davis, B.A.; Thigpen, L.K.; Caufield, C.R.; Horton, A.D.; McIntosh, J.R. Runners greatly
underestimate sweat losses before and after a 1-hr summer run. Int. J. Sport Nutr. Exerc. Metab. 2012, 22,
353–362. [CrossRef] [PubMed]
11. Shaver, L.N.; O’Neal, E.K.; Hall, E.E.; Nepocatych, S. No performance or affective advantage of drinking
versus rinsing with water during a 15-km running session in female runners. Int. J. Exerc. Sci. 2018, 11,
910–920. [PubMed]
12. Thigpen, L.K.; Green, J.M.; O’Neal, E.K. Hydration profile and sweat loss perception of male and female
Division II basketball players during practice. J. Strength Cond. Res. 2014, 28, 3425–3431. [CrossRef] [PubMed]
13. O’Neal, E.K.; Caufield, C.R.; Lowe, J.B.; Stevenson, M.C.; Davis, B.A.; Thigpen, L.K. 24-h fluid kinetics
and perception of sweat losses following a 1-h run in a temperate environment. Nutrients 2014, 6, 37–49.
[CrossRef]
14. Cronin, C.C.; O’Neal, E.; Simpson, J.; Miller, B.L.; Green, M.; Helm Allen, J.A.; Boman, S. Natural training
hydration status, sweat rates, and perception of sweat losses during CrossFit training. Int. J. Exerc. Sci. 2016,
9, 4.
15. Campbell, S.; Pritchett, R.C.; Cederburg, K.; Burnham, T.; Pritchett, K.C. Fluid intake and sweat rate during
hot yoga participation. Int. J. Exerc. Sci. 2017, 10, 721–733.
16. Muth, T.; Pitchett, R.; Pritchett, K.; DePaepe, J.; Blank, R. Hydration status and perception of fluid loss in
male and female university rugby union players. Int. J. Exerc. Sci. 2019, 12, 859.
17. Love, T.D.; Baker, D.F.; Healey, P.; Black, K.E. Measured and perceived indices of fluid balance in professional
athletes. The use and impact of hydration assessment strategies. Eur. J. Sport Sci. 2018, 18, 349–356.
[CrossRef]
18. Davis, B.A.; O’Neal, E.; Johnson, S.; Farley, R.S. Hot training conditions inhibit adequate ad libitum recovery
fluid intake of runners. Int. J. Exerc. Sci. 2019, 12, 1322–1333.
19. Baker, L.B. Sweating rate and sweat sodium concentration in athletes: A review of methodology and
intra/interindividual variability. Sports Med. 2017, 47, 111–128. [CrossRef]
20. Cheuvront, S.N.; Montain, S.J. Myths and methodologies: Making sense of exercise mass and water balance.
Exp. Physiol. 2017, 102, 1047–1053. [CrossRef]
21. O’Neal, E.K.; Wingo, J.E.; Richardson, M.T.; Leeper, J.D.; Neggers, Y.H.; Bishop, P.A. Half-marathon and
full-marathon runners’ hydration practices and perceptions. J. Athl. Train. 2011, 46, 581–591. [CrossRef]
[PubMed]
22. Winger, J.M.; Hoffman, M.D.; Hew-Butler, T.D.; Stuempfle, K.J.; Dugas, J.P.; Fogard, K.; Dugas, L.R. Physiology
and hydration beliefs affect race behavior but not post-race sodium in 161-km ultramarathon finishers. Int. J.
Sports Physiol. Perform 2013, 8, 536–541. [CrossRef] [PubMed]
23. Brown, S.; Chiampas, G.; Jaworski, C.; Passe, D. Lack of awareness of fluid needs among participants at a
midwest marathon. Sports Health 2011, 3, 451–454. [CrossRef]
24. O’Neal, E.K.; Poulos, S.P.; Bishop, P.A. Hydration profile and influence of beverage contents on fluid intake
by women during outdoor recreational walking. Eur. J. Appl. Physiol. 2012, 112, 3971–3982. [CrossRef]
[PubMed]
25. Backer, H.D.; Shopes, E.; Collins, S.L.; Barkan, H. Exertional heat illness and hyponatremia in hikers. Am. J.
Emerg. Med. 1999, 17, 532–539. [CrossRef]
26. Baker, L.B.; Munce, T.A.; Kenney, W.L. Sex differences in voluntary fluid intake by older adults during
exercise. Med. Sci. Sports Exerc. 2005, 37, 789–796. [CrossRef]
27. Emerson, D.M.; Torres-McGehee, T.M.; Emerson, C.C.; LaSalle, T.L. Individual fluid plans versus ad libitum
on hydration status in minor professional ice hockey players. J. Int. Soc. Sports Nutr. 2017, 14, 25. [CrossRef]Sports 2020, 8, 113 12 of 12
28. Cleary, M.A.; Hetzler, R.K.; Wasson, D.; Wages, J.J.; Stickley, C.; Kimura, I.F. Hydration behaviors before and
after an educational and prescribed hydration intervention in adolescent athletes. J. Athl. Train. 2012, 47,
273–281. [CrossRef]
29. McDermott, B.P.; Casa, D.J.; Yeargin, S.W.; Ganio, M.S.; Lopez, R.M.; Mooradian, E.A. Hydration status, sweat
rates, and rehydration education of youth football campers. J. Sport Rehabil. 2009, 18, 535–552. [CrossRef]
30. McKenzie, A.L.; Munoz, C.X.; Armstrong, L.E. Accuracy of urine color to detect equal to or greater than 2%
body mass loss in men. J. Athl. Train. 2015, 50, 1306–1309. [CrossRef]
31. Peacock, O.J.; Stokes, K.; Thompson, D. Initial hydration status, fluid balance, and psychological affect during
recreational exercise in adults. J. Sports Sci. 2011, 29, 897–904. [CrossRef] [PubMed]
32. MacLeod, H.; Sunderland, C. Fluid balance and hydration habits of elite female field hockey players during
consecutive international matches. J. Strength Cond. Res. 2009, 23, 1245–1251. [CrossRef] [PubMed]
33. Brandenburg, J.P.; Gaetz, M. Fluid balance of elite female basketball players before and during game play.
Int. J. Sport Nutr. Exerc. Metab. 2012, 22, 347–352. [CrossRef] [PubMed]
34. Goulet, E.D.; Hoffman, M.D. Impact of ad libitum versus programmed drinking on endurance performance:
A systematic review with meta-analysis. Sports Med. 2019, 49, 221–232. [CrossRef] [PubMed]
35. Beis, L.Y.; Wright-Whyte, M.; Fudge, B.; Noakes, T.; Pitsiladis, Y.P. Drinking behaviors of elite male runners
during marathon competition. Clin. J. Sport Med. 2012, 22, 254–261. [CrossRef]
36. Lee, J.K.; Nio, A.Q.; Lim, C.L.; Teo, E.Y.; Byrne, C. Thermoregulation, pacing and fluid balance during mass
participation distance running in a warm and humid environment. Eur. J. Appl. Physiol. 2010, 109, 887–898.
[CrossRef]
37. Davis, B.A.; Thigpen, L.K.; Hornsby, J.H.; Green, J.M.; Coates, T.E.; O’Neal, E.K. Hydration kinetics and
10-km outdoor running performance following 75% versus 150% between bout fluid replacement. Eur. J.
Sport Sci. 2014, 14, 703–710. [CrossRef]
38. Wilcoxson, M.C.; Johnson, S.L.; Pribyslavska, V.; Green, J.M.; O’Neal, E.K. Fluid retention and utility of
practical hydration markers to detect three levels of recovery fluid intake in male runners. Int. J. Sport Nutr.
Exerc. Metab. 2017, 27, 178–185. [CrossRef]
39. O’Neal, E.K.; Johnson, S.L.; Davis, B.A.; Pribyslavska, V.; Stevenson-Wilcoxson, M.C. Urine specific gravity
as a practical marker for identifying sub-optimal fluid intake of runners ~12-h post-exercise. Int. J. Sport
Nutr. Exerc. Metab. 2019, 29, 32–38. [CrossRef]
© 2020 by the authors. Licensee MDPI, Basel, Switzerland. This article is an open access
article distributed under the terms and conditions of the Creative Commons Attribution
(CC BY) license (http://creativecommons.org/licenses/by/4.0/).You can also read