Development of pedotransfer functions for predicting soil bulk density: A case study in Indonesian small island
←
→
Page content transcription
If your browser does not render page correctly, please read the page content below
JOURNAL OF WATER AND LAND DEVELOPMENT
                                                                    e-ISSN 2083-4535

                Polish Academy of Sciences (PAN)              Institute of Technology and Life Sciences – National Research Institute (ITP – PIB)

                                                     JOURNAL OF WATER AND LAND DEVELOPMENT
                                                             DOI: 10.24425/jwld.2021.139029
                                                             2021, No. 51 (X–XII): 181–187

  Development of pedotransfer functions for predicting soil bulk
         density: A case study in Indonesian small island

                    Evi Dwi Yanti1) , Asep Mulyono1)      , Muhamad Rahman Djuwansah1)                                                                      ,
                          Ida Narulita1) , Risandi Dwirama Putra2) , Dewi Surinati3)
           1)
                Research Center for Geotechnology, Indonesian National Research and Innovation Agency, Bandung, Indonesia
                                              2)
                                                   Maritim Raja Ali Haji University, Tanjung Pinang, Indonesia
            3)
                 Research Center for Oceanography, Indonesian National Research and Innovation Agency, Jakarta, Indonesia

        RECEIVED 06.02.2021                                                 REVIEWED 29.04.2021                                        ACCEPTED 28.07.2021

        Abstract: Unlike many other countries, tropical regions such as Indonesia still lack publications on pedotransfer
        functions (PTFs), particularly ones dedicated to the predicting of soil bulk density. Soil bulk density affects soil density,
        porosity, water holding capacity, drainage, and the stock and flux of nutrients in the soil. However, obtaining access to
        a laboratory is difficult, time-consuming, and costly. Therefore, it is necessary to utilise PTFs to estimate soil bulk
        density. This study aims to define soil properties related to soil bulk density, develop new PTFs using multiple linear
        regression (MLR), and evaluate the performance and accuracy of PTFs (new and existing). Seven existing PTFs were
        applied in this study. For the purposes of evaluation, Pearson’s correlation (r), mean error (ME), root mean square
        error (RMSE), and modelling efficiency (EF) were used. The study was conducted in five soil types on Bintan Island,
        Indonesia. Soil depth and organic carbon (SOC) are soil properties potentially relevant for soil bulk density prediction.
        The ME, RMSE, and EF values were lower for the newly developed PTFs than for existing PTFs. In summary, we
        concluded that the newly developed PTFs have higher accuracy than existing PTFs derived from literature. The
        prediction of soil bulk density will be more accurate if PTFs are applied directly in the area that is to be studied.

        Keywords: bulk density, multiple linear regression, pedotransfer function, soil property

                           INTRODUCTION                                                         Multiple linear models are often used to develop PTFs from
                                                                                          soil properties, as they are the simplest and fastest way to do it
Soil bulk density is one of the critical physical variables for                           [SOUZA et al. 2016]. The PTFs developed in China rely on the
evaluating soil. It is important for identifying soil density,                            combination of multiple linear regression (MLR) and artificial
porosity, water holding capacity, and drainage, as well as for                            neural network (ANN) methods [QIAO et al. 2019; XIANGSHENG
assessing the stock and flux of nutrients [MARTIN et al. 2011]. Bulk                      et al. 2016]. The same was done in Tunisia in Northern Africa
density measurement is lacking due to the difficulty involved in                          [BRAHIM et al. 2012]. Over the last decade, a considerable
the collection of samples for laboratory tests, which is a time-                          empirical equations of PTFs has been developed for predicting
consuming, and costly process [BERNOUX et al. 1998; HEUSCHER                              soil bulk density from soil properties. The PTFs were developed
et al. 2005; HOLLIS et al. 2012; MANRIQUE, JONES 1991; MINASNY,                           in tropical areas [MINASNY, HARTEMINK 2011; TRANTER et al. 2007],
HARTEMINK 2011; SOUZA et al. 2016; TOMASELLA, HODNETT 1998;                               Brazilian soils [BERNOUX et al. 1998], Amazon region soils
TRANTER et al. 2007]. Pedotransfer functions (PTFs) are an                                [TOMASELLA, HODNETT 1998], soils in the United States and several
empirical approach to estimating soil bulk density from soil                              countries in Central America [MANRIQUE, JONES 1991], in
properties. They provide an alternative method to overcome these                          European soils [HOLLIS et al. 2012], and on the basis of soil data
difficulties.                                                                             from USDA-NRCS National Soil Survey [HEUSCHER et al. 2005].

           © 2021. The Authors. Published by Polish Academy of Sciences (PAN) and Institute of Technology and Life Sciences – National Research Institute (ITP – PIB).
                               This is an open access article under the CC BY-NC-ND license (https://creativecommons.org/licenses/by-nc-nd/3.0/)
182 Development of pedotransfer functions for predicting soil bulk density: A case study in Indonesian small island
Typically, such PTFs are not transferrable to other regions with monthly rainfall is about 200–390 mm, and in the dry season, the
acceptable accuracy [MCBRATNEY et al. 2002]. monthly rainfall is about 170 mm. Assuming that a dry month is
In Indonesia, there are currently no publications predicting defined as a month in which precipitation falls below 80 mm,
soil bulk density with the application of PTFs. This study is aimed there are no proper dry months in Bintan Island, according to
to (1) define soil properties that are correlated with soil bulk average monthly rain figures.
density, (2) develop new PTFs to predict soil bulk density, and (3)
evaluate the performance and accuracy of PTFs (new and SOIL DATASET
existing) on a small tropical island in Indonesia.
This soil profile sampling was carried out from May to July 2018.
Geo-referenced surface soil samples and field analysis tools
MATERIALS AND METHODS included soil auger, soil ring cylinder, clinometer, pH stick, and
distilled water. Fifteen sampling sites covering different soil-type
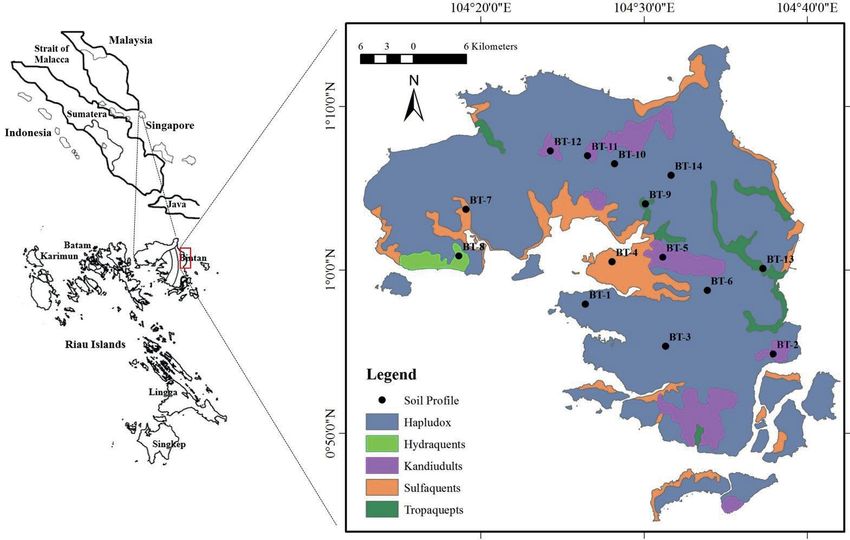
STUDY AREA zones were selected for the purposes of the study (Fig. 1). For
each soil profile, disturbed and undisturbed soil samples were
The study was conducted on a small tropical island called Bintan collected at three different depths (0–30 cm, 30–60 cm, and 60–90
Island, Riau Islands province (Fig. 1). It comprises pre-tertiary cm). A total of 45 soil samples (disturbed and undisturbed) were
and quarter sedimentary formations and igneous rocks, consist- collected at all sites to determine soil properties. Each disturbed
ing of granite and diorite [KUSNAMA et al. 1994]. The soil types soil sample consisted of approximately 1 kg of soil placed in
were Oxisols, Entisols, Ultisols, and Inceptisols [USDA 2014]. a plastic bag. The samples were taken and air-dried at room
The topography is predominantly an undulating hillock, with temperature. Disturbed samples were utilised for determining the
slopes varying from 0–3% in the flat region to more than 40% in soil pH, measured with a pH meter, and soil organic carbon
the hilly areas. The difference in elevation between the sea level (SOC) [WALKLEY, BLACK 1934]. The sieve-hydrometer method was
(0) and the highest peak at Bintan Mountain (345 m a.s.l.) on used to measure particle size distribution [GEE, BAUDER 1986].
Bintan Island is not significant. A soil ring cylinder with an inner diameter of 7.6 cm and a height
The streams flow in the North and South directions, of 4 cm was used for the undisturbed soil sample. The core
forming sub-parallel patterns, while the tributaries form a semi- method was applied for soil bulk density (BD) analysis [GROSS-
radial pattern. The rivers are predominantly short, shallow, and MAN, REINSCH 2002].
not too wide. The largest watershed is the Jago watershed
covering an area of 135.8 km2, followed by the Kawal watershed PEDOTRANSFER FUNCTIONS (PTFs)
covering 93.0 km2. The average temperature ranges from 26.1 to FOR SOIL BULK DENSITY ESTIMATION
26.7°C, while the average air humidity ranges from 70 to 95%.
The rainy season occurs twice a year. May and December Seven existing PTFs for bulk density estimation were applied in
generally bring the highest annual rainfall, while the lowest this study, as presented in Table 1. The soil properties used in
rainfall is recorded in August. During the rainy season, the constructing new PTFs differ from the properties used to develop
Fig. 1. Map of soil profile locations; source: own elaboration
© 2021. The Authors. Published by Polish Academy of Sciences (PAN) and Institute of Technology and Life Sciences – National Research Institute (ITP – PIB).
This is an open access article under the CC BY-NC-ND license (https://creativecommons.org/licenses/by-nc-nd/3.0/)Evi Dwi Yanti, Asep Mulyono, Muhamad Rahman Djuwansah, Ida Narulita, Risandi Dwirama Putra, Dewi Surinati 183
PN PN
the seven existing PTFs. In tropical areas [MINASNY, HARTEMINK 1 ðyi y i Þ2 1 ðybi y i Þ2
2011], PTFs were developed on the basis of organic matter, depth, EF ¼ PN ð3Þ
1 ðyi y i Þ2
and sand fraction properties; clay, sand, organic carbon, and pH
were used to develop PTFs in Brazilian Amazon soils [BERNOUX where: yi is the measured value, ŷi is the predicted value, ỹi is the
et al. 1998]; silt, clay, and organic carbon were used in the mean of the measured values, and N is the total number of
Amazon Region soils [TOMASELLA, HODNETT 1998]; organic carbon observations.
was used in the United States and several countries in Central A perfect match of PTFs predicted models should have the
America [MANRIQUE, JONES 1991]; clay and soil depth were used in lowest ME [PATIL, SINGH 2016; WEYNANTS et al. 2009], an overall
European soils [HOLLIS et al. 2012], sand and soil depth [TRANTER dispersion of RMSE, which is a favoured indicator [MCNEILL et al.
et al. 2007], while clay, organic carbon, and soil depth were used 2018; VEREECKEN et al. 2010]. The EF value should be close to 1
in USDA-NRCS National Soil Survey soil data [HEUSCHER et al. [RUSTANTO et al. 2017].
2005].
Table 1. List of selected PTFs used for bulk density estimation RESULTS AND DISCUSSION
DESCRIPTIVE STATISTICS
PTFs No. Formula
BD = 100/[(OM/0.935 + 0.049 log depth) + (0.0055 sand) The descriptive statistics of the soil dataset used to derive the
1 + (0.000065 (sand – 38.96)2)] + [(100 – OM)/0.224)] PTFs are shown in Table 2. The average bulk density values for
the five profile sampling sites were as follows: 1.32 g∙cm−3
BD = 1.524 – (0.0046 clay) – (0.051 SOC) – (0.0045 pH) +
2 (Hapludox), 1.04 g∙cm−3 (Hydraquents), 1.27 g∙cm−3 (Kandiu-
(0.001 sand)
dults), 1.18 g∙cm−3 (Sulfaquents), and 1.24 g∙cm−3 (Tropaquepts).
3 BD = 1.578 – (0.054 SOC) – (0.006 silt) – (0.004 clay) Our findings conclude that the soil bulk density values come
in the following order: Hapludox > Kandiudults > Tropaquepts >
4 BD = 1.660 – (0.318 SOC1/2) Sulfaquents > Hydraquents. The highest soil bulk density is
BD = 1.3894 – (0.0252 clay) + (0.000372 clay) [2 – recorded for the Hapludox soil type and the lowest is recorded for
5 (0.07897 log depth)] the Hydraquents soil type. Soil bulk density is influenced by the
soil particle size distribution [JONES 1983], especially by sand
BD = 1.35 + (0.0045 sand) + (44.7 − sand) 2(−6∙10−5) + content. Hydraquents soil type has the lowest bulk density, due to
6 (0.06 log depth)
the sand fraction average. The highest soil organic carbon is found
BD = 1.148 – (0.144 SOC1/2) + (1.05∙10−5 clay3) + (0.00181 in Hydraquents, while the lowest is encountered in Hapludox soil
7 depth) type. A decrease in soil organic carbon will increase bulk density
and reduce porosity, thus reducing soil infiltration and water and
Explanations: PTFs = pedotransfer functions; 1 = MINASNY and HARTEMINK air storage capacity [WALL, HEISKANEN 2003].
[2011]; 2 = BERNOUX et al. [1998]; 3 = TOMASELLA and HODNETT [1998]; 4 = The results of Pearson correlation analysis for soil proper-
MANRIQUE and JONES [1991]; 5 = HOLLIS et al. [2012]; 6 = TRANTER et al.
ties, performed with the confidence levels of 95 and 99%, were
[2007]; 7 = HEUSCHER et al. [2005]; BD = bulk density; OM = organic
matter; SOC = soil organic carbon; pH = decimal logarithm of the
presented in Table 3. The obtained soil organic content, depth,
reciprocal of the hydrogen ion activity. and clay data were found to be significantly correlated with bulk
Source: own elaboration based on literature. density at the 0.05 significance level (Tab. 3). Soil organic carbon
and clay have a negative correlation with bulk density. On the
other hand, depth has a positive correlation with it. Soil organic
STATISTICAL ANALYSIS carbon (–0.63) showed higher Pearson correlation coefficients
followed by the depth (0.45) and clay fraction (–0.33). A negative
New PTFs were developed alongside existing PTFs using multiple correlation between clay and soil bulk density [JONES 1983]
linear regression (MLR). The evaluations were required for both existed, while sand and silt fraction positively correlated with soil
existing and new PTFs. Many statistical indices have been used to bulk density [CHAUDHARI et al. 2013]. The negative correlation of
evaluate and validate PTFs [PATIL, SINGH 2016]. A graphical clay is also observed in Entisols, Vertisols, and Aridisols soil type
plotting between measured and predicted values was used to [SAKIN et al. 2011] and Cryrendoll soil, China [LI et al. 2007]. In
evaluate each of the PTFs. Each of the selected PTFs was soil data from the USDA-NRCS National Soil Survey, organic C
evaluated with the coefficient of determination (R2), mean errors content has shown 25% of bulk density variation [HEUSCHER et al.
(ME) (Eq. 1), root mean errors (RMSE) (Eq. 2), and modelling 2005]. The higher the soil organic carbon, the lower the soil bulk
efficiency (EF) (Eq. 3): density [LEIFELD, KÖGEL-KNABNER 2005].
PN
ðybi yi Þ NEW PTFs DEVELOPED USING MLR METHODS
1
ME ¼ ð1Þ
N
Existing PTFs, except for PTFs no. 5 and PTFs no. 6, included
organic content (OM/OC/SOC) as predictor variables. Soil
sffiffiffiffiffiffiffiffiffiffiffiffiffiffiffiffiffiffiffiffiffiffiffiffiffiffiffiffi organic carbon is considered an important factor in bulk density
PN
1 ðy bi yi Þ2 prediction [XIANGSHENG et al. 2016]. The particle size class is used
RMSE ¼ ð2Þ
N as a predictor variable for all existing PTFs, except for PTFs no. 4
© 2021. The Authors. Published by Polish Academy of Sciences (PAN) and Institute of Technology and Life Sciences – National Research Institute (ITP – PIB).
This is an open access article under the CC BY-NC-ND license (https://creativecommons.org/licenses/by-nc-nd/3.0/)184 Development of pedotransfer functions for predicting soil bulk density: A case study in Indonesian small island
Table 2. Summary statistics for the bulk density (BD) and other Table 3. Pearson’s correlation matrix for bulk density (BD) and
soil properties other soil properties
Sampling Variable Depth Sand Silt Clay SOC pH BD
sites Variables Min Max Ave SD
of soil type Depth 1.00
BD (g∙m−3) 1.15 1.35 1.32 0.10 Sand 0.29 1.00
sand (%) 32.00 39.00 35.00 3.61 Silt 0.13 –0.25 1.00
silt (%) 20.00 52.00 35.67 16.01 Clay –0.35 –0.67** –0.55* 1.00
Hapludox
(5 profiles) clay (%) 9.00 46.00 29.33 18.77 OC –0.50 0.01 0.07 –0.07 1.00
SOC (%) 0.30 0.39 0.34 0.05 pH 0.50 0.68** 0.07 –0.64* –0.26 1.00
pH 5.14 5.80 5.45 0.33 BD 0.45* 0.12 0.16 –0.33* –0.63* 0.11 1.00
BD (g∙m−3) 0.95 1.20 1.04 0.14 Explanations: * significant correlation at 0.05 significance level; **
significant correlation at 0.01 significance level; BD = bulk density; SOC
sand (%) 47.00 82.00 68.00 19.92
= soil organic carbon; pH = decimal logarithm of the reciprocal of the
silt (%) 8.00 43.00 25.00 17.52 hydrogen ion activity.
Hydraquents
Source: own study.
(1 profile) clay (%) 9.00 29.00 16.00 11.27
SOC (%) 0.50 2.01 1.08 0.82
pH 5.13 6.45 5.58 0.76 Table 4. Statistical indices for the models developed using MLR
BD (g∙m−3) 1.09 1.42 1.27 0.17
Model Input variables R2 ME RMSE
sand (%) 53.00 56.00 54.00 1.73
1 SOC 0.353 0.120 0.118
Kandiudults silt (%) 11.00 41.00 23.67 15.53
2 depth + SOC 0.425 0.064 0.120
(4 profiles) clay (%) 3.00 36.00 22.33 17.21
3 depth + SOC + clay 0.330 0.048 0.120
SOC (%) 0.36 1.11 0.65 0.41
pH 4.85 5.71 5.15 0.49 Explanations: MLR = multiple linear regression; SOC = soil organic
carbon; R2 = coefficient of determination; ME = mean errors; RMSE =
BD (g∙m−3) 1.17 1.19 1.18 0.01 root means square errors.
sand (%) 30.00 33.00 31.33 1.53 Source: own study.
Sulfaquents silt (%) 7.00 22.00 12.67 8.14
(2 profiles) similar RMSE with model 3 (depth + soil organic carbon + clay
clay (%) 47.00 61.00 56.00 7.81
combinations). The lowest RMSE was obtained from model 1
SOC (%) 0.39 0.53 0.46 0.07 (only soil organic carbon variable) with RMSE 0.118 but had
pH 4.98 5.14 5.09 0.09 a higher ME than was obtained for the other model.
−3 Based on Table 4, a perfect match of new PTFs should have
BD (g∙m ) 1.14 1.46 1.24 0.16
the R2 value close to 1, the lowest ME and RMSE. Therefore, the
sand (%) 58.00 75.00 59.00 8.89 combination of input variables comprises depth and soil organic
Tropaquepts silt (%) 9.00 38.00 18.67 16.74 carbon. Despite this, clay is not a strong predictor of bulk density
(2 profiles) clay (%) 4.00 20.00 13.33 8.33
due to the distribution of bulk density as a clay function. Clay is
characterised by a lower R2 value (0.05) than soil organic carbon
SOC (%) 0.30 0.78 0.49 0.26 and depth, for which the value amounts to 0.399 and 0.207,
pH 5.56 6.07 5.81 0.26 respectively. In Table 4, Model 2 was used to develop new PTFs
by MLR, according to Eq. (4):
Explanation: Min = minimum; Max = maximum; Ave = average; SD =
standard deviation; BD = bulk density; SOC = soil organic carbon; pH =
decimal logarithm of the reciprocal of the hydrogen ion activity. BD ¼ 1:2684 þ ð0:0011 depthÞ ð0:1774 SOCÞ ð4Þ
Source: own study.
[MANRIQUE, JONES 1991]. Further, variables considered as pre- EVALUATION OF EXISTING AND NEW PEDOTRANSFER
dictors included soil thickness (depth), which was used in BD FUNCTIONS (PTFs)
prediction, except for PTFs no. 2, PTFs no. 3, and PTFs no. 4. pH
Figure 2 shows the scatterplot for the new and existing PTFs for
was included respectively at PTFs no. 2, and there may have been measured and predicted soil bulk density. PTFs by TRANTER et al.
indirect relationships between soil pH and bulk density. [2007] showed an extreme estimation and biases along the
The new PTFs were developed based on the three correlated horizontal axis (Fig. 2g) and the best predictive power among the
variables (Tab. 3) with three different combinations (models), seven existing selected PTFs by MANRIQUE and JONES [1991]
using MLR methods (Tab. 4). The combination of depth and soil (Fig. 2e), whereas the most accurate of these predictions was the
organic carbon (model 2) resulted in the highest R2 (0.425) and one proposed by this study.
© 2021. The Authors. Published by Polish Academy of Sciences (PAN) and Institute of Technology and Life Sciences – National Research Institute (ITP – PIB).
This is an open access article under the CC BY-NC-ND license (https://creativecommons.org/licenses/by-nc-nd/3.0/)Evi Dwi Yanti, Asep Mulyono, Muhamad Rahman Djuwansah, Ida Narulita, Risandi Dwirama Putra, Dewi Surinati 185
Fig. 2. Measured and predicted bulk density using new and existing pedotransfer functions (PTFs); source: own elaboration
The existing PTFs, as derived from literature, included between the region in which the PTFs were developed and the
estimated bulk density with R2 ranging from 0.005 to 0.426, ME area in which PTFs are used result in inadequate PTFs
ranging from –0.223 to 0.457, RMSE ranging from 0.117 to 0.480, [MCBRATNEY et al. 2002] and allow the inclusion of soil
and EF ranging from –10.471 to 0.316 (Tab. 5). Among the morphological data [TRANTER et al. 2007].
existing PTFs, PTFs developed by MANRIQUE and JONES [1991]
showed the best performance, with R2 at 0.426, ME at 0.032,
RMSE at 0.117, and EF at 0.316, followed by MINASNY and CONCLUSIONS
HARTEMINK [2011] with ME at 0.038, RMSE at 0.160, and EF at –
0.271. PTFs with poorer performance and larger RMSE (0.480) The average bulk density values for the five soil profile sites in
were proposed by TRANTER et al. [2007]. The performance of PTFs Bintan island were 1.32 g∙cm−3 (Hapludox), 1.04 g∙cm−3
proposed by HOLLIS et al. [2012] and HEUSCHER et al. [2005] is (Hydraquents), 1.27 g∙cm−3 (Kandiudults), 1.18 g∙cm−3 (Sulfa-
underestimated, as reflected by a negative ME value (Tab. 5), quents), and 1.24 g∙cm−3 (Tropaquepts). Pearson correlation
while the other PTFs gave a positive ME value. delivered the negative correlation between bulk density and soil
None of the existing PTFs performed better than the PTFs organic carbon and clay, but a positive correlation with soil depth.
developed in this study (Fig. 2a, Tab. 5). The new PTFs obtained Depth and soil organic contents were the most important input
by us have the lowest ME (0.002) and RMSE (0.108), and higher variables for predicting soil bulk density. Performance evaluations
EF (0.424) compared to the existing PTFs. The application of for the seven existing and newly developed PTFs considered in
PTFs must be adjusted to the geographical domain of the soil this study allow us to draw the following conclusions about using
dataset. The differences of geographical domain characteristics PTFs for predicting soil bulk density. PTFs derived from our
Table 5. Evaluation indices for existing and new pedotransfer functions (PTFs)
PTFs R2 ME RMSE EF
MINASNY and HARTEMINK [2011] 0.111 0.038 0.160 –0.271
BERNOUX et al. [1998] 0.129 0.183 0.231 –1.648
TOMASELLA and HODNETT [1998] 0.048 0.088 0.171 –0.462
MANRIQUE and JONES [1991] 0.426 0.032 0.117 0.316
HOLLIS et al. [2012] 0.005 –0.223 0.286 –3.069
TRANTER et al. [2007] 0.049 0.457 0.480 –10.471
HEUSCHER et al. [2005] 0.106 –0.069 0.230 –1.637
This study 0.425 0.002 0.108 0.424
Explanation: R2 = coefficient of determination; ME = mean errors; RMSE = root means square errors; EF = modelling efficiency.
Source: own study.
© 2021. The Authors. Published by Polish Academy of Sciences (PAN) and Institute of Technology and Life Sciences – National Research Institute (ITP – PIB).
This is an open access article under the CC BY-NC-ND license (https://creativecommons.org/licenses/by-nc-nd/3.0/)186 Development of pedotransfer functions for predicting soil bulk density: A case study in Indonesian small island
study showed higher accuracy than PTFs derived from literature. Plain using pedo-transfer functions. Geoderma. Vol. 138(3–4)
New PTFs are characterised by a lower mean error, root means p. 261–271. DOI 10.1016/j.geoderma.2006.11.018.
square error, and modelling efficiency value than existing PTFs. MANRIQUE L.A., JONES C.A. 1991. Bulk density of soils in relation to soil
These results indicate that soil bulk density prediction will be physical and chemical properties. Soil Science Society of America
more accurate if PTFs developed directly on the basis of the data Journal. Vol. 55(2) p. 476–481. DOI 10.2136/sssaj1991
collected in the study area are used. We developed the first set of .03615995005500020030x.
PTFs for predicting soil bulk density on a small tropical island in MARTIN M.P., WATTENBACH M., SMITH P., MEERSMANS J., JOLIVET C.,
Indonesia, which will be important for further soil research in BOULONNE L., ARROUAYS D. 2011. Spatial distribution of soil
Indonesia in general. organic carbon stocks in France. Biogeosciences. Vol. 8(5)
p. 1053–1065. DOI 10.5194/bg-8-1053-2011.
MCBRATNEY A.B., MINASNY B., CATTLE S.R., VERVOORT R.W. 2002. From
ACKNOWLEDGMENTS pedotransfer functions to soil inference systems. Geoderma.
Vol. 109(1) p. 41–73. DOI 10.1016/S0016-7061(02)00139-8.
This study is supported by the Deputy of Earth Sciences of the MCNEILL S.J., LILBURNE L.R., CARRICK S., WEBB T.H., CUTHILL T. 2018.
Indonesian Institute of Sciences (COREMAP-CTI program 2021– Pedotransfer functions for the soil water characteristics of New
Zealand soils using S-map information. Geoderma. Vol. 326
2022). The author would like to thank our colleagues who
p. 96–110. DOI 10.1016/j.geoderma.2018.04.011.
provided insight and expertise, and helped clarify the ideas. We
MINASNY B., HARTEMINK A.E. 2011. Predicting soil properties in the
would also like to thank technicians for their thoughtful
tropics. Earth Science Reviews. Vol. 106(1) p. 52–62. DOI
assistance during the field study.
10.1016/j.earscirev.2011.01.005.
PATIL N., SINGH S. 2016. Pedotransfer functions for estimating soil
hydraulic properties: A review. Pedosphere. Vol. 26(4) p. 417–
REFERENCES 430. DOI 10.1016/S1002-0160(15)60054-6.
QIAO J., ZHU Y., JIA X., HUANG L., SHAO M. 2019. Development of
BERNOUX M., CERRI C., ARROUAYS D., JOLIVET C., VOLKOFF B. 1998. Bulk
pedotransfer functions for predicting the bulk density in the
densities of Brazilian Amazon soils related to other soil proper-
critical zone on the Loess Plateau, China. Journal of Soils and
ties. Soil Science Society of America Journal. Vol. 62(3) p. 743–
Sediments. Vol. 19(1) p. 366–372. DOI 10.1007/s11368-018-
749. DOI 10.2136/sssaj1998.03615995006200030029x.
2040-1.
BRAHIM N., BERNOUX M., GALLALI T. 2012. Pedotransfer functions to
RUSTANTO A., BOOIJ M.J., WÖSTEN H., HOEKSTRA A.Y. 2017. Application
estimate soil bulk density for Northern Africa: Tunisia case.
and recalibration of soil water retention pedotransfer functions in
Journal of Arid Environments. Vol. 81 p. 77–83. DOI 10.1016/j.
a tropical upstream catchment: Case study in Bengawan Solo,
jaridenv.2012.01.012.
Indonesia. Journal of Hydrology and Hydromechanics. Vol. 65(3)
CHAUDHARI P.R., AHIRE D.V., AHIRE V.D., CHKRAVARTY M., MAITY S.
p. 307–320. DOI 10.1515/johh-2017-0020.
2013. Soil bulk density as related to soil texture, organic matter
SAKIN E., DELIBORAN A., TUTAR E. 2011. Bulk density of Harran plain
content and available total nutrients of Coimbatore soil.
soils in relation to other soil properties. African Journal of
International Journal of Scientific and Research Publications.
Agricultural Research. Vol. 6(7) p. 1750–1757. DOI 10.5897/
Vol. 3(2) p. 1–8.
AJAR10.502.
GEE G.W., BAUDER J.W. 1986. Particle-size analysis. In: Methods of soil
analysis. P. 1. Physical and mineralogical methods. Ed. A. Klute. SOUZA E. DE, FERNANDES FILHO E.I., SCHAEFER C.E.G.R., BATJES N.H.,
Madison, Wis. ASA, SSSA p. 383–411. SANTOS G.R. DOS, PONTES L.M. 2016. Pedotransfer functions to
GROSSMAN R.B., REINSCH T.G. 2002. Bulk density and linear extensibility. estimate bulk density from soil properties and environmental
In: Methods of soil analysis: P. 4. Physical methods. Eds. J.H. covariates: Rio Doce basin. Scientia Agricola. Vol. 73(6) p. 525–
Dane, C.G. Topp. Madison, Wis. SSSA, p. 201–228. 534. DOI 10.1590/0103-9016-2015-0485.
HEUSCHER S.A., BRANDT C.C., JARDINE P.M. 2005. Using soil physical and TOMASELLA J., HODNETT M.G. 1998. Estimating soil water retention
chemical properties to estimate bulk density. Soil Science Society characteristics from limited data in Brazilian Amazonia. Soil
of America Journal. Vol. 69(1) p. 51–56. DOI 10.2136/ Science. Vol. 163(3) p. 190–202.
sssaj2005.0051a. TRANTER G., MINASNY B., MCBRATNEY A.B., MURPHY B., MCKENZIE N.J.
HOLLIS J.M, HANNAM J., BELLAMY P.H. 2012. Empirically-derived GRUNDY M., BROUGH D. 2007. Building and testing conceptual and
pedotransfer functions for predicting bulk density in European empirical models for predicting soil bulk density. Soil Use and
soils. European Journal of Soil Science. Vol. 63(1) p. 96–109. DOI Management. Vol. 23(4) p. 437–443. DOI 10.1111/j.1475-
10.1111/j.1365-2389.2011.01412.x. 2743.2007.00092.x.
JONES C.A. 1983. Effect of soil texture on critical bulk densities for root USDA 2014. Keys to soil taxonomy. Soil Conservation Service. Vol. 12.
growth. Soil Science Society of America Journal. Vol. 47(6) Washington. United States Department of Agriculture. ISBN
p. 1208–1211. DOI 10.2136/sssaj1983.03615995004700060029x. 978-0359573240. pp. 372.
KUSNAMA, SUTISNA, AMIN, KOESOEMADINATA, SUKARDI, HERMANTO. 1994. VEREECKEN H., WEYNANTS M., JAVAUX M., PACHEPSKY Y., SCHAAP M.G.,
Geological map of Tanjungpinang sheet, Sumatera. Geological GENUCHTEN M.T. 2010. Using pedotransfer functions to estimate
Agency. the van Genuchten–Mualem soil hydraulic properties: A review.
LEIFELD J., KÖGEL-KNABNER I. 2005. Soil organic matter fractions as early Vadose Zone Journal. Vol. 9(4) p. 795–820. DOI 10.2136/
indicators for carbon stock changes under different land-use? vzj2010.0045.
Geoderma. Vol. 124(1–2) p. 143–155. DOI 10.1016/j.geoder- WALKLEY A., BLACK I.A. 1934. An examination of Degtjareff method for
ma.2004.04.009. determining soil organic matter and a proposed modification of
LI Y., CHEN D., WHITE R.E., ZHU A., ZHANG J. 2007. Estimating soil the chromic acid in soil analysis. Soil Science. Vol. 79(1) p. 459–
hydraulic properties of Fengqiu County soils in the North China 465.
© 2021. The Authors. Published by Polish Academy of Sciences (PAN) and Institute of Technology and Life Sciences – National Research Institute (ITP – PIB).
This is an open access article under the CC BY-NC-ND license (https://creativecommons.org/licenses/by-nc-nd/3.0/)Evi Dwi Yanti, Asep Mulyono, Muhamad Rahman Djuwansah, Ida Narulita, Risandi Dwirama Putra, Dewi Surinati 187
WALL A., HEISKANEN J. 2003. Water-retention characteristics and related model. Vadose Zone Journal. Vol. 8(1) p. 86–95. DOI 10.2136/
physical properties of soil on afforested agricultural land in vzj2008.0062.
Finland. Forest Ecology and Management. Vol. 186(1–3) p. 21– XIANGSHENG Y.I., GUOSHENG L.I., YANYU Y.I.N. 2016. Pedotransfer functions
32. DOI 10.1016/S0378-1127(03)00239-1. for estimating soil bulk density: A case study in the Three-River
WEYNANTS M., VEREECKEN H., JAVAUX M. 2009. Revisiting Vereecken Headwater region of Qinghai Province, China. Pedosphere. Vol. 26
pedotransfer functions: Introducing a closed-form hydraulic (3) p. 362–373. DOI 10.1016/S1002-0160(15)60049-2.
© 2021. The Authors. Published by Polish Academy of Sciences (PAN) and Institute of Technology and Life Sciences – National Research Institute (ITP – PIB).
This is an open access article under the CC BY-NC-ND license (https://creativecommons.org/licenses/by-nc-nd/3.0/)You can also read


