Differences in Calves' Shape and Circumference Profiles between Chinese Males and Females
←
→
Page content transcription
If your browser does not render page correctly, please read the page content below
AATCC Journal of Research

DOI: 10.14504/ajr.8.S1.2

Differences in Calves’ Shape and Circumference
Profiles between Chinese Males and Females
By Wang Xi, Donghua University, Guo Xia, and Tao Xiaoming, The Hong Kong Polytechnic University, and Li Qiao,
Donghua University

Abstract
Functional garments are required to be closely and properly fitted on diverse human limbs. However, most manufacturers
classify their products based on a number of anthropometric statistical parameters of Caucasian body sizes. This work
focuses on the diversities in the real curved shapes, and their detailed anatomy characteristics, for Chinese people.
Differences in the 3D-scanned human calves’ shapes and circumference profiles between Chinese male and female subjects
were identified through primary component analysis, extracted, and compared. Results show that calves of males were longer
in length, straighter, and had a larger circumference within the belly of gastrocnemius, while females were found to have
shorter overall length, more bent, and had a smaller gastrocnemius. Females had a larger averaged circumference. The focus
of this study was on the size design of compression stockings.

Key Terms
3D scanned shape, Circumference Profile, Compression Stockings, Computer Vision, Human Calf, PCA

Introduction                                                          sizes,14,15 delivering body anthropometric measurements
                                                                      for apparel fitting design,16–18 simulation of wearing,19,20
Fitting functional textile garments, such as compression              and so on. There is still a lack of analysis and indicators of
and supporting garments, on a variety of human limbs, are             the difference in human limb 3D shapes and other relevant
the key issues for the designers and manufacturers. Risks of          profiles between males and females.
improper size of those garments can lead to discomfort, skin
irritation, temporary dents, broken skin, or even local ulcers        Therefore, in this present work, we present an in-detailed
in the skin.1–5 For instance, medical compression stockings           study on 3D human calves’ shapes and circumference
(MCS) of non-compliance or improperly worn are reported               profiles using the principal component analysis, to deliver
as more likely to cause negative effects and aggravated symp-         the most primary variation in Chinese human calves’
toms, such as swelling, blood congestion, or extravasation in         shapes as well as in circumference profiles, and the differ-
the physiotherapy of chronic venous insufficiency (CVI).6–11          ences between Chinese males and females. A set of selected
Since somatotypes of different races are generally recognized         parameters as indicators among subjects were identified,
as different and with unique characteristics, those functional        extracted, and compared, and the difference between male
garments shall be under ideal condition designed and tar-             and female subjects were presented and analyzed. This
geted at a certain race. To date, however, the size designs and       study provides a reference for the size design of compres-
published standards such as RAL-GZ387 and BS:6612 for                 sion stockings, the methodologies of which could inspire the
functional garments are largely regulated by many western             design and manufacturing of other fitted functional gar-
institutions and best for Caucasians.2,12,13 There is a lack of       ments for other limbs and for other races.
fitting studies of garments for Chinese people. Meanwhile,
anthropometry study of limbs and corresponding standards              Methods
currently still contribute a large portion of the designs             Principal Component Analysis on Human
instead of the studies on 3D shapes.
                                                                      Calf Shapes
In recent years, the 3D digital scanning technique has                According to the Laplace Law, the compression exerted by
become one of the most convenient and accessible tools                outfits depends on not only the elongation of the fabrics,
to extract the detailed body shapes defined by surfaces               but also the curved shapes of limbs. Principal components
and anthropometric measurements for ready-to-wear                     analysis (PCA)21,22 was implemented for fast extraction of
apparel in the fashion industry and for healthcare                    most primary differences components (PCs) among subjects’
applications. However, reported studies mainly restrained             3D shapes and circumferential profiles of calves. All to-be-
their focuses on the anthropometry research of human                  analyzed information, i.e., scanned 3D calf shapes as well
limbs via 3D body scanning, such as categorizing body                 as circumference profiles, was vectorized first, through

15 | Vol. 8, No. Special Issue One   Artificial IntelligenceDelivered
                                                            Conference by Ingenta
                                     IP: 192.168.39.151 On: Sat, 30 Oct 2021 04:53:49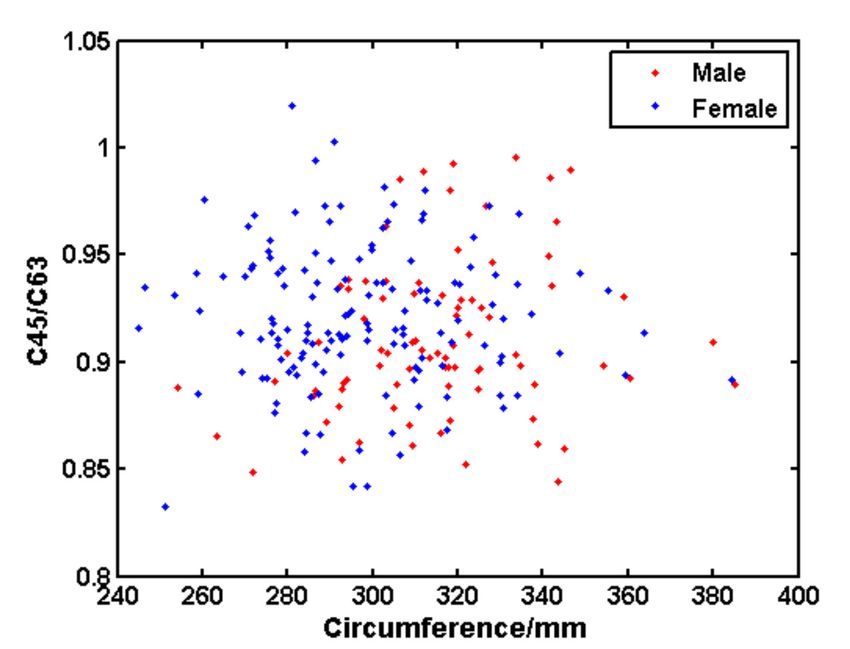
AATCC Journal of Research

re-arranging the vertexes into shape vectors, which form the       and limits of fibula (ankle) of the calves, and retaining the
matrix of observations. Then the most significant varia-           middle section within (part of human calf). Calves were
tions of samples, as well as their weights, can be extracted       stored for further analysis. The reason for choosing left
by determining the eigen vectors and values of the covari-         calves for analysis was that varicose veins start and grow on
ance matrix of the observations. Therefore, in this study,         the human calf. Meanwhile, for the right-handed (majority),
the dimension of each principal component (PC) was three           the left leg is used for long-time weight support, and more
times the number of vertices for calves. The eigen vectors         likely suffer from varicose veins.
describing the most frequent observations of samples can be
                                                                   Before analysis, all isolated calves were standardized by mak-
sorted in an order of their importance in representing varia-
                                                                   ing the whole calf vertical, to exclude the variation of shapes
tions within the original data set.
                                                                   caused by difference in orientation.
The PCA calculations were conducted with Matlab by self-
programed scripts, which yielded the averaged shape, eigen         Results and Discussion
values and eigen vectors of the input sample vectors. Hence the
shapes and visualizations of the PCs can be realized by Eq. 1.
                                                                   PCs of Calves’ Shapes
                                                                   The original 3D vertexes of extracted calves were vectorized,
                                                                   through arranging the x, y, and z coordinates of each vertex
                      				 Eq. 1                                   to form a column shape vector. As aforementioned, PCA was
                                                                   applied to have the primary variations of male and female
    and are the j-th eigen vector (representing the j-th           calves’ shapes. The first four orders of variations indicated
direction of PC) and eigen value (representing the intensity       by top four PCs constituting the major variances (92%) were
of variation in the corresponding j-th direction), respec-         visualized and shown in Fig. 1, while the orders of variance
      v
tively. denotes the average shape of all data. Eq. 1 gives         were compared and summarized in Table I.
the construction of the PC, which can be easily visualized
and compared to the averaged shape. Interpretation of those        It can be seen from the results that for male subjects, the first
comparisons can provide intuitionistic evidence for identify-      four PCs reflected the variance in height of the calf, bend-
ing remarkable differences in characteristics.                     ing of calf forwards/backwards, bending of calf outward/
                                                                   inwards, and overall diameter of calf, respectively. For
Subjects                                                           female subjects, however, PC3 and PC4 were in opposite
A total of 225 subjects (Chinese residents, with 145 females       orders. This result shows that height of calf, bending radius
and 80 males) agreed and participated in this research. 92%        of tibia, and overall circumference were the factors of most
of the subjects were middle-aged (between 40~60), which            diversity. It can also be preliminarily concluded from Table I
were reported as major sufferers of CVI and users of com-          that there was a larger variation in calves’ heights for males,
pression stockings.23 Initial examination showed that 56%          while female subjects revealed a greater diversity in bending
of the 225 subjects recruited had varicose vein symptoms           of the calf bones.
on one or both legs (higher than CEAP-C2)2, although the
severity and location varied. Hence, it’s suggested that the       PCs of Calves’ Circumference Profiles
recruited subjects were appropriate representative targets for     A circumference profile of a limb is a natural vector formed
studying the variation of calf shapes. Subjects were already       by circumferences of cross-sections along normalized length
aware of relative information, the compression therapy of          direction. According to the Laplace Law, circumferences of
CVI using MCSs, procedures of scanning, as well as personal        calves are directly linked to the average pressure exerted due
3D body shapes to be collected prior to test.                      to fabric membrane stretching. For designing fitted func-
                                                                   tional garments fabricated by low-modulus fabrics, it’s more
Devices and Data Collection                                        desirable to observe variation in circumference profiles.
An NX-16 automatic full-body scanner ([TC]2, USA) was used
in this study to observe and produce true and full-scale 3D
human models. To facilitate the computing process while keep-
ing the origin shapes, resolutions of scanning were uniformly       Table I.
sampled as 5 degrees in the circumferential direction and 1 mm      Difference of Variance between Male and Female Subjects’ Calves Shapes
in the height direction. During scanning, subjects wore only                          Variance (Male)               Variance (Female)

underwear, adopted a normal posture and stood still in the          PC1               83.0%                         73.0%
scanning booth until the scanning was accomplished.                 PC2                8.3%                         10.9%
                                                                    PC3                2.9%                          5.8%
The human left calves were isolated from the whole scanned
                                                                    PC4                2.2%                          5.0%
3D body shapes by identifying upper limit of tibia (knee)

                                                              Artificial Intelligence Conference
                                                 Delivered by Ingenta                                   Vol. 8, No. Special Issue One | 16
                                   IP: 192.168.39.151 On: Sat, 30 Oct 2021 04:53:49
AATCC Journal of Research
Table II.
Difference of Variance between Male and Female Subjects’
Circumference Profiles
Variance (Male) Variance (Female)
PC1 88.0% 88.0%
PC2 5.6% 6.3%
PC3 3.4% 2.6%
Fig. 1. First four PCs of male calves (left column) and female calves Fig. 2. First three PCs of male circumference profiles (left column) and
(right column). female circumference profiles (right column).
17 | Vol. 8, No. Special Issue One Artificial IntelligenceDelivered
Conference by Ingenta
IP: 192.168.39.151 On: Sat, 30 Oct 2021 04:53:49AATCC Journal of Research
PCA was applied to show the primary variations of male and Differences in Selected Characteristics of 3D
female calves’ circumference profiles. The top three variations Calves Between Males and Females
were visualized by principal components (PCs) and shown in As indicated by the PCA results on calves’ shapes,
Fig. 2, with the orders of variance compared and summarized indicators of characteristics were defined to further
in Table II. extract the difference between male and female sub-
It can be seen from the results that for both male and female jects. As suggested by the PCs, the length of calf, fitted
subjects, the first two PCs revealed the majority variance diameter of the bending calf (tibia), and calf circum-
(>92%) and reflected the overall circumferences of the calves, ference at the belly of gastrocnemius were specially
as well as the relative size of bulging gastrocnemius. This chosen as indicators. The fitted diameter of the bend-
result shows that overall circumferences as well as relative size ing calf (tibia) was obtained by identifying the edge of
of bulging gastrocnemius were the factors of most diversity. the tibia on skins of the scanned calves and calculat-
Fig. 2 also indicates that female subjects tended to have larger ing the mean radius using a circle curve-fitting. The
averaged circumferences than male subjects. calf circumference at the belly of gastrocnemius was
defined as the maximum circumference in the inner
zone of the calves. For all subjects, the three indicators
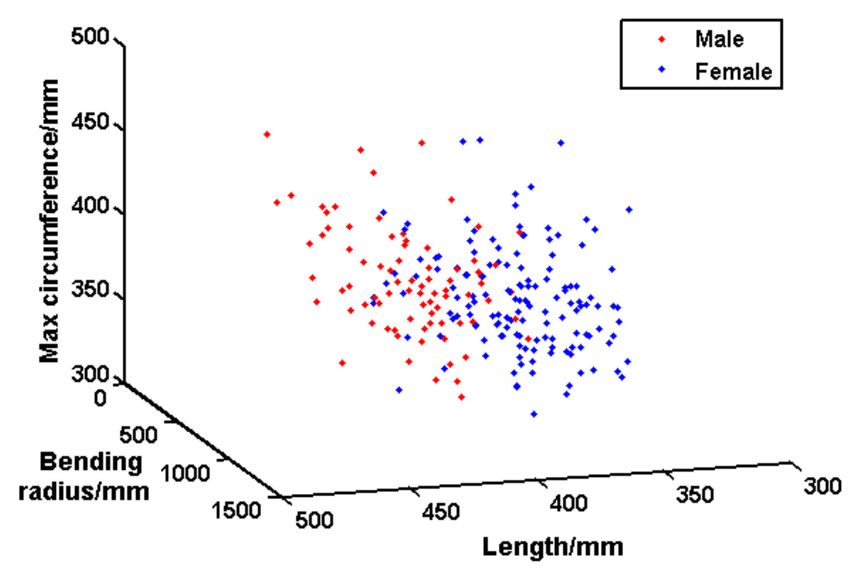
were calculated and plotted in the Fig. 3.
It’s clear from Fig. 3 that calves of male subjects had
longer length, greater radius (which means calves were
more straight), and slightly smaller maximum cir-
cumference, while female subjects had shorter overall
length, more bending, and slightly greater maximum
circumference. The findings were generally in accor-
dance with previous results of PCA and with common
sense that male are taller and less fat in calves.
Differences in Characteristics of Circumfer-
ential Profiles between Males and Females
Similarly, and suggested by the PCs, two indicators of
characteristics were defined and extracted to further
analyze the differences in male and female circumfer-
Fig. 3. Calf length, bending radius, and maximum circumference of male
and female calves.
ential profiles, i.e., the averaged circumference at the
belly of gastrocnemius (within 20%~70% of height),
and the relative dimension of gastrocnemius defined
by c(45%)/c(63%), where c(45%) and c(63%) are the
circumferences of calf at 45% height and 63% height,
respectively. The reason for choosing 63% height as
the base of normalization is that there was nearly no
significant difference in PC2 at 63% height as shown
in Fig. 2. For all subjects, the two indicators were
calculated and plotted in the Fig. 4.
Fig. 4 shows that male subjects had a mean higher
circumference at the belly of the gastrocnemius
than female subjects, showing that the male subjects
had more muscles. For the ratio of c(45%)/c(63%),
however, there was no significant difference between
male subjects (0.91) and female subjects (0.92).
Since the physical information of subjects was not
included in this analysis, this observation needs
further confirmation.
Fig. 4. Circumference and c(45%)/c(63%) at the belly of gastrocnemius of
male and female circumference profiles.
Artificial Intelligence Conference
Delivered by Ingenta Vol. 8, No. Special Issue One | 18
IP: 192.168.39.151 On: Sat, 30 Oct 2021 04:53:49AATCC Journal of Research
Conclusion 9. Morooka, H.; et al. Sen’i Kikai Gakkaishi (Journal of the Textile
Machinery Society of Japan) 2001, 54 (2), 57–62.
PCA was performed on the 3D shape of calves of Chinese 10. Higgins, T.; Naughton, G. A.; Burgess, D. Journal of Science and
Medicine in Sport 2009, 12 (1), 223–226.
subjects, as well as with the circumference profile of calves. 11. Xiong, Y.; Tao, X. M. Polymers 2018, 10 (6), 663.
Primary variations were identified, with parameters compared 12. Ashby, R. L.; et al. Lancet 2014, 383 (9920), 871–879.
between female and male subjects. The results show that 13. Nelson, E. A.; Bell-Syer, S. E. M. Cochrane Database of Systematic Reviews
there was a larger variation in calves’ heights for males, while 2014 (9). DOI: https://doi.org/10.1002/14651858.CD002303.pub3
female subjects revealed a greater diversity in bending of the 14. Song, H. K.; Ashdown, S. P. Textile Research Journal 2011, 81 (9),
914–931.
calf bones. Female subjects tended to have larger averaged 15. Wilson, A. F. Ph.D. Thesis, North Carolina State University, 2016.
circumferences than male subjects, although male subjects had 16. Parker, C. J.; Gill, S.; Hayes, S. 3D Body Scanning has Suitable
a larger size of gastrocnemius. Three indicators for 3D calves’ Reliability: An Anthropometric Investigation for Garment
shapes and two indicators for circumference profiles were Construction. In 8th International Conference and Exhibition on 3D
proposed. Analysis of the indicators show that calves of male Body Scanning and Processing Technologies, Montreal, Canada, 2017.
17. Ashdown, S. P.; et al. Journal of Textile and Apparel, Technology and
subjects had longer length, greater radius (which means calves Management 2004, 4 (1), 1–12.
were more straight), slightly smaller maximum circumference, 18. Liu, R.; et al. Fibers and Polymers 2006, 7 (4), 389–397.
and larger circumference within the belly of the gastrocne- 19. Dubuis, L.; et al. Computer Methods in Biomechanics and Biomedical
mius, while female subjects had shorter overall length, more Engineering 2012, 15 (1), 3–11.
bending, a slightly greater maximum circumference, and 20. Avril, S.; et al. Journal of Biomechanical Engineering-Transactions of the
ASME 2010, 132 (3), 031006.
smaller gastrocnemius. There was no significant difference 21. Abdi, H.; Williams, L. J. Wiley Interdisciplinary Reviews:
between male subjects and female subjects when considering Computational Statistics 2010, 2 (4), 433–459.
the ratio of c(45%)/c(63%) and the degree of bending of the 22. Wold, S.; Esbensen, K.; Geladi, P. Chemometrics and Intelligent
calves. The observed PCs for 3D calves and circumference Laboratory Systems 1987, 2 (1–3), 37–52.
23. Beebe-Dimmer, J. L.; et al. Annals of Epidemiology 2005, 15 (3),
profiles would help manufacturers to pilot reasonable size
175–184.
distribution of garments for male and female potential users.
The results of analysis would contribute to the size design of
functional garments for Chinese people and inspire the study Author
of shape variation for other human limbs. Qiao Li, College of Textiles, Donghua University, Shanghai,
China; phone +86.21.6779.2704; qiaoli@dhu.edu.cn.
Acknowledgements
This research was funded by the National Science Foundation
of China (Grant No. 51603039), the Fundamental Research
Funds for the Central Universities, the Key Laboratory of
Textile Science and Technology (Donghua University),
Ministry of Education, the Initial Research Funds for Young
Teachers of Donghua University, and also sponsored by
Shanghai Pujiang Program.
Technical support and trial assistance by group mates and
colleagues are sincerely appreciated by the authors.
References
1. Murad, M. H., et al. Journal of Vascular Surgery 2011, 53, 49s–65s.
2. Liu, R., et al. Textile Research Journal 2017, 87 (9), 1121–1141.
3. Wade, R.; Paton, F.; Woolacott, N. Journal of Advanced Nursing 2017,
73 (2), 336–348.
4. Alisauskiene, D.; Mikucioniene, D.; Milasiute, L. Fibres & Textiles in
Eastern Europe 2013, 21 (6), 74–78.
5. Mikucioniene, D.; Milasiute, L. Journal of Industrial Textiles 2017, 47
(4), 551–566.
6. Raju, S.; Hollis, K.; Neglen, P. Annals of Vascular Surgery 2007, 21 (6),
790–795.
7. Rivas, E.; Smith, J. D.; Sherman, N. W. Respiratory Physiology &
Neurobiology 2017, 237, 1–6.
8. Fu, W. J.; Liu, Y.; Fang, Y. International Journal of Advanced Robotic
Systems, 2013, 10 (1), 66.
19 | Vol. 8, No. Special Issue One Artificial IntelligenceDelivered
Conference by Ingenta
IP: 192.168.39.151 On: Sat, 30 Oct 2021 04:53:49You can also read