DIFFERENT SKILLS, DIFFERENT GAPS - MEASURING & CLOSING THE SKILLS GAP BURNING GLASS TECHNOLOGIES
←
→
Page content transcription
If your browser does not render page correctly, please read the page content below

DIFFERENT SKILLS, DIFFERENT GAPS
       MEASURING & CLOSING THE SKILLS GAP

              BURNING GLASS TECHNOLOGIES
                     MARCH 2018

              © 2018 Burning Glass Technologies
Author credits:
    By Dan Restuccia with, Bledi Taska, and Scott Bittle

    We gratefully acknowledge the insight and support of the U.S. Chamber of Commerce
    Foundation and the U.S. Chamber of Commerce Foundation Center for Education
    and Workforce.

2
EXECUTIVE SUMMARY
                                                            Different Skills, Different Gaps

DIFFERENT
                                            The U.S. labor market is as tight as it has been
                                            since the Great Recession, with unemployment
                                            at 4.1% in December 2017.1 Yet employers
                                            continue to struggle to find the skilled labor

   SKILLS,
                                            they need. If job creation in the aggregate isn’t
                                            solving the problem, how can we identify and
                                            address the specific places where supply isn’t
                                            meeting demand?

DIFFERENT
                                            In Different Skills, Different Gaps: Measuring
                                            and Closing the Skills Gap, prepared for the
                                            U.S. Chamber of Commerce Foundation, we
                                            examine the skills gap on an occupation-by-
                                            occupation basis. This is the best way to both

     GAPS
                                            understand the gap, and to close it. An overall
                                            surplus of workers doesn’t offer much insight
                                            into the challenges of a specific industry looking
                                            to fill specific roles requiring specific skills.

 MEASURING &                                In the aggregate, across all the occupations
                                            studied, we found there were 5% more job
                                            openings than workers. But in 12 specific

 CLOSING THE                                career areas, we found that demand for
                                            workers exceeded available supply, adding up
                                            to a total skills gap of 4.4 million openings. The

  SKILLS GAP                                categories with the largest shortages include:

                                                 • Health Care: 1,153,617 openings
                                                 • B
                                                    usiness and Financial Operations:
                                                   985,214 openings
              BURNING GLASS                      • O
                                                     ffice and Administrative Support:
                     March 2018                     461,263 openings
                                                 • Sales: 388,857 openings
                                                 • C
                                                    omputers and Mathematics:
                                                   356,527 openings

                                            1. Bureau of Labor Statistics. “Employment Situation
                                                – December 2017.” January 2018. https://www.bls.
                                                gov/news.release/archives/empsit_01052018.htm

     “Different Skills, Different Gaps: Measuring & Closing the Skills,” © 2018 Burning Glass Technologies, BurningGlass.com   3
Different industries are suffering skills gaps for different reasons including too few workers in
    the training pipeline or changing role requirements that lead to misalignment. Some fields, such
    as health care practitioners, computer and information scientists, and information security
    analysts suffer from a shortage of workers and long lead times in training new ones. In other
    areas of the job market, such as office and administrative jobs, hiring and training systems seem
    to be misaligned as employers raise the bar for hiring. High- and middle-skill occupations tend
    to have shortages, while low-skill occupations have a surplus of workers.

    The solutions to the gap, therefore, need to be tailored to specific industries. Key implications
    include:

       1. A need for improved alignment between education and workforce systems and
            a rapidly changing labor market. Well-aligned programs are closely linked to labor
           market demand and deliver good outcomes in terms of jobs and wages for graduates.
       2. A need for an expanded employer leadership role in those systems. Employers
            must not serve merely as advisors, but also play a more significant role as customers of
            the education and training systems to ensure their demand for a skilled and competitive
            workforce is met.
       3.
           A need for improved employer signaling, particularly around the changing
           competency and credentialing requirements for the fastest growing and hardest
           to fill jobs. In a rapidly evolving job market clear and effective signaling is critical for
           training providers to assess and address the specific skill needs of employers.

    A crucial lesson of this research is that the skills gap is not singular; it is cumulative—the result
    of different gaps across different kinds of occupations. That is part of why addressing the skills
    gap has proven so elusive: it defies easy categorization.

4
Introduction
The term “skills gap” conjures up the image of one giant chasm, a sort of Grand Canyon between
what employers need and what workers can provide. But that suggests that the skills gap is a
single problem with a single cause and a single solution. In fact, the gaps around specific skills
vary in their characteristics and, as a result, affect different corners of the job market in very
different ways. Rather than one canyon, the gap is much more akin to a series of potholes,
damaging some industries and avoided by others.
In this report for the U.S. Chamber of Commerce Foundation, Burning Glass Technologies
approached the problem using an innovative new model to map both supply (using federal
workforce statistics) and demand (based on job postings). With this approach, we are able to
assess the worker shortfall at an occupational level, role by role. This provides a picture of
which roles, industry by industry, have robust talent supply chains and which face gaps. A role-
based approach to understanding the skill gap is important as it allows training providers and
policy makers to direct resources into developing the specific skills industries need to build a
successful workforce.
Our report finds a lack of alignment between the skills employers need and the available talent
in the workforce. In 12 of the career areas we studied, we found that demand for workers
exceeded available supply by a total of 4.4 million openings. These job categories and associated
shortages include:
   • Health Care: 1,153,617
   • Business and Financial Operations: 985,214
   • Office and Administrative Support: 461,263
   • Sales: 388,857
   • Computers and Mathematics: 356,527
In our research, we found that these different industries are suffering skills gaps for different
reasons. In some fields, such as health care, the challenge seems to be a straightforward problem
of demand exceeding supply. In other areas of the job market, hiring and training systems seem
to be misaligned with what employers demand.
Another area of interest was a comparison to trends during and after the Great Recession. In
2016, there were 5% more openings than available workers, compared to 2012, in the midst
of the recession, when there were 5% more available workers than openings. When looking at
more detailed trends over the course of recovery from the recession, we find that many skilled
occupations such as computer roles, engineers, and health care professionals had skill gaps
consistently throughout this period. Middle skill occupations such as administrative roles and
maintenance/repair roles had a surplus of workers during the period of high unemployment, but
now face shortages in the number of available workers relative to openings.
This paper concludes with recommendations for how to improve education and workforce
system alignment, employer leadership, and employer signaling.

                         “Different Skills, Different Gaps: Measuring & Closing the Skills,” © 2018 Burning Glass Technologies, BurningGlass.com   5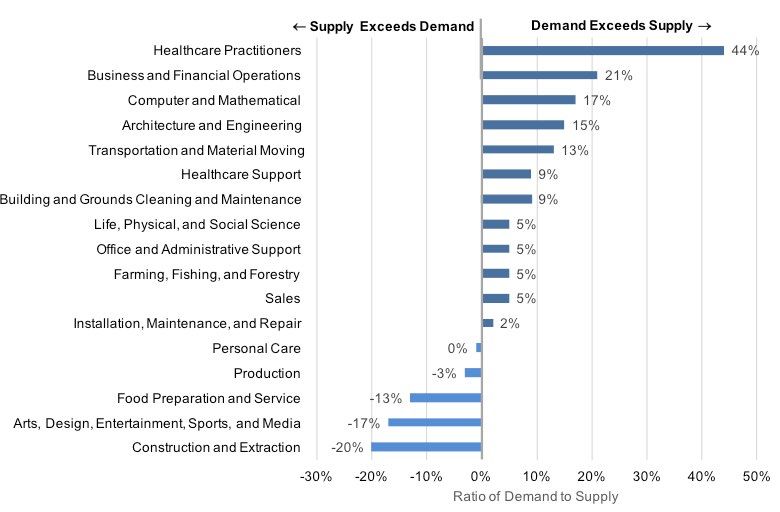
Part I:
                        A New view of
                        the skills gap

     There are many who still challenge the existence of a skills gap. Surveys of employers routinely
     find that companies have difficulty finding skilled workers.2 Some economists argue that, if that
     were true, wages would be rising and employers would be investing more in training.3

     In our research, we developed a supply/demand model that compares the number of open
     positions to the number of available workers in the field for each occupation. In this way, we can
     see which roles have skill gaps—demand exceeds supply, which are in equilibrium—demand
     matches supply, and which have a surplus of available talent—supply exceeds demand.

     To measure demand, we use an econometric model which starts with total postings collected
     by Burning Glass by occupation, and normalizes those to equal the total number of national
     openings reported by the Bureau of Labor Statistics’ Job Openings and Labor Turnover Survey
     (JOLTS). Supply is measured based on the total number of workers separating from their job in
     JOLTS. We then estimate a turnover rate for each occupation based on data from the Census’s
     Current Population Survey (CPS). We determine the available number of workers by multiplying
     the churn rate by the total employment in each industry and occupation. Demand and supply are
     then compared to determine the ratio used as a summary statistic for each occupation.

     With this approach, we can identify whether the supply of currently employed workers is greater,
     less, or roughly equal to the number of job openings posted, which sheds light on whether there
     is a skills gap for a particular occupation, and what the nature of the gap might be.

     Of course, having more openings than workers is not always a negative, and can yield certain
     advantages. Workers are able to change jobs and advance in their careers, unemployed workers

         “Surveys of employers routinely find
              that companies have difficulty
                      finding skilled workers.”

    2. S
        ee for example Manpower Group. “2016-2017 Talent Shortage Survey”. 2017. http://manpowergroup.com/talent-
       shortage-2016 and US Chamber of Commerce Foundation. “Managing the Talent Pipeline: A New Approach to Closing the
       Skills Gap.” 2014. https://www.uschamberfoundation.org/sites/default/files/media-uploads/Managing%20the%20Talent%20
       Pipeline_0.pdf
    3. B
        urtles, Gary. “Unemployment and the ‘Skills Mismatch’ Story: Overblown and Unpersuasive.” The Brookings Institution, July
       29, 2014. https://www.brookings.edu/opinions/unemployment-and-the-skills-mismatch-story-overblown-and-unpersuasive/

6
Chart 1: Demand/Supply Ratio by Occupation y Occupation
can be rehired relatively quickly, and it is an indication that the economy is growing. Too many
openings in relation to available labor supply, however, is a sign that employers are having trouble
filling positions, and that the pipeline for workers is falling behind demand.
Our research shows that roles requiring highly skilled workers – such as health care practitioners,
business and financial operations, computer and mathematics professionals, and architecture
and engineering roles – are the most undersupplied roles. In each case, there are at least 15%
more openings than available workers in the market. For health care practitioners, the gap is
even more severe, with 44% more openings than available workers.
At the other end of the spectrum, the occupation groups with the largest supply of workers
include Construction and Extraction, Arts and Design, and Food Preparation. Each of these have
at least 13% fewer openings than available workers.
From an education and training perspective, high-skill occupations, defined as those where at
least 80% of online job postings for that position request a bachelor’s degree or higher, have 25%
more openings than available workers. Middle-skill occupations, such as welders, administrative
assistants, and computer support specialists, have 13% more openings than workers.4 Low-skill
occupations have the opposite problem: 7% fewer openings than available workers.
4 W
e define middle-skill roles here as those positions where the median wage is greater than $15.00, a living wage based
on MIT’s living wage calculator and where at least 20% of positions are available to job seekers with a sub-baccalaureate
credential. Low skills occupations are defined that those which pay less than $15.00 per hour and high skill occupations
are defined as those where at least 80% of job postings specifically request a bachelor’s degree qualification.
“Different Skills, Different Gaps: Measuring & Closing the Skills,” © 2018 Burning Glass Technologies, BurningGlass.com 7Part 2:
Evolution of
the Skills Gap
The skills gap is neither new nor static. In some cases, gaps exist but are closing, which is good
news for employers. In others, the gap is widening. To measure these gaps, we constructed a
skills gap model by occupation family, a group of related roles, for each of the last five years, 2012
through 2016.
Not surprisingly, the number of openings per worker has increased as the economy has improved.
In fact, the ratio of supply and demand has flipped. In 2012, there were 5% fewer openings
than available workers, whereas our model finds that in 2016 there were 5% more openings
that workers. In nearly every occupational family, we have seen the market tightening, with an
increase in the ratio between demand and supply.
The two occupation families where the demand/supply ratio has decreased are Computer and
Mathematics and Architecture and Engineering, which each had sizeable gaps both during and
following the recession, declining slightly over the course of the recovery. This is largely a function
of supply starting to catch up with demand. Supply in Computer and Mathematics roles has risen
33% over the period, while demand has increased by 25%. For Architecture and Engineering
roles, supply has risen by 22% compared to a 17% increase in demand.
How individual firms and industries have fared depends significantly on what kinds of occupations
comprise their hiring. To understand better differences in impact of supply and demand dynamics,
we will examine the trend in the supply/demand ratios for groups of similar occupation families:
• A cross-cutting set of business occupations hired by nearly every type of firm;
• Engineering and manufacturing roles; and
• Health care roles.
Cross-Cutting Business occupations
Four occupation families represent business-critical functions in nearly all companies—Business
and Financial Operations, Sales and Related, Office and Administrative Support, and Computer
and Mathematics. In these families, we find that the supply/demand dynamics form two clusters:
• Specialized roles with large gaps that have held steady over time; and
• More general roles, which have seen markets tighten during the recovery.
The specialized role cluster includes Business and Financial Operations and Computer and
Mathematics (i.e. Information Technology). These two occupation families have the second- and
third-largest gaps between available supply and demand on a percentage basis. In addition, their
8demand/supply ratio hasn’t shifted during the recovery. The ratio for Computer and Mathematics
roles was down slightly during the recovery, and the others have been flat.
This is likely in part because these, and other highly skilled roles, were less affected by the
downturn and so the dynamics of employers looking for additional skilled labor have remained
fairly steady. While demand has increased, available supply has increased as well.
Employers have seen the market for Office and Administrative Support workers and Sales
workers tighten as the economy has improved. In 2012, each of these occupation groups was
oversupplied, with roughly 5% fewer openings than workers. In 2016, each group had 5% more
openings than workers. These roles show a tightening market for employers seeking middle-
skill workers.
Chart 4: Demand and Supply of Business Occupations Over Time
“The number of openings per worker
has increased as the economy
has improved. In fact, the ratio of
supply and demand has flipped.”
“Different Skills, Different Gaps: Measuring & Closing the Skills,” © 2018 Burning Glass Technologies, BurningGlass.com 9Engineering and Manufacturing Occupations
In engineering, manufacturing and other skilled trade occupations, we see that occupations
requiring more advanced training have gaps that have endured the recession, while markets for
middle-skill jobs have tightened. Engineers show 15% more openings than available workers. As
with information technology workers, that gap has slightly declined since 2012 (by 4%).
Installation and Repair workers have seen a notable shift. In 2012, there was a 14% surplus of
openings in this field, which has been absorbed and become a 2% opening shortage.
Though our data suggests otherwise, manufacturing employers consistently cite a deep
shortage of production workers with the skills and qualifications they need.5 A likely explanation
for the discrepancy between our model, which shows a modest shortage, and the experience of
employers is that the skills requirements in the industry are changing, making many available
workers underqualified for currently available jobs. This indicates a genuine skills gap, a
misalignment between the skills possessed by workers and the skills needed by employers.
5. A
ccenture and the Manufacturing Institute. “Out of Inventory: Skills shortage threatens growth for U.S. manufacturing,
Accenture Manufacturing Skills and Training Study”, Accenture, 2014. https://newsroom.accenture.com/news/skills-
shortage-threatens-future-earnings-and-growth-prospects-of-us-manufacturers-according-to-a-new-report-from-
accenture-and-the-manufacturing-institute.htm
10Chart 5: Demand and Supply of Engineering, Manufacturing Over Time
“Occupations requiring more advanced
training have gaps that have endured
the recession, while markets for
middle-skill jobs have tightened.”
“Different Skills, Different Gaps: Measuring & Closing the Skills,” © 2018 Burning Glass Technologies, BurningGlass.com 11Health Care Occupations
Health care occupations show large and growing gaps between employer needs and available
workers. The Bureau of Labor Statistics divides the Health Care category into practitioner roles
(such as doctors, nurses, and technicians) and support professionals (such as medical assistants
and home health aides). In both cases, we see skills gaps where employers do not have enough
available workers to address their needs. This is particularly true among higher-skill practitioner
roles where openings exceed available workers by more than 40%. This is by far the most
dramatically expanding skills gap in our research.
Chart 6: Demand and Supply of Health Care Occupations Over Time
“The most dramatically expanding
skills gap in our research is in
health care occupations.”
12Part 3:
The Causes of
the Skills Gap
There are several possible causes of the skills gaps that we see across different occupations:
• S
upply Shortage: There are not enough workers with the appropriate background to fill
positions in a given field or occupation.
• M
isalignment of Hiring and Training Systems: Employers may not have configured their
hiring and training systems in a way that acquires and develops the talent they need.
Supply Shortages
A skills gap usually presumes a lack of higher-order skills. Shortages of workers, however, can
strike high, middle, or low-skill occupations. The reasons for those shortages may be quite
different. In high-skill occupations, a skills gap can be caused by training programs that don’t
produce enough qualified workers. Essentially, this is a problem with the supply pipeline, and
would need to be addressed by training programs.
In low- and middle-skill occupations, by contrast, a worker shortage may be caused by a lack of
workers willing to choose these roles. Workers commonly cite reasons such as relatively low pay
and benefits.
Occupations facing supply shortages include:
Health Care Practitioners
This is one of the most severe shortages we identified, with nearly 1.5 openings for
every available worker across this occupational family. Importantly, the shortages are
particularly high among rapidly growing, advanced practice clinical care roles, such
as nurse practitioners, physician’s assistants, physical therapists, and occupational
therapists. Each of these roles has more than 1.7 openings for every potential worker.
Put another way, the 1.5 ratio means there are 1.04 million health care jobs going unfilled
because of a lack of qualified workers. In the fields with the highest ratios of openings
to workers, that means the field is short by more than 52,000 physical therapists, more
than 43,000 nurse practitioners, 24,000 occupational therapists, and 23,000 physician
assistants.
Also troubling is the fact that clinical health care roles require long training periods—
often graduate study—and that demand is projected to increase. The Bureau of Labor
Statistics projects that need for nurse practitioners, physician’s assistants, and physical
6. U.S. Bureau of Labor Statistics, Employment Projections Program. Projections are for 2016-2026. https://www.bls.gov/emp/
“Different Skills, Different Gaps: Measuring & Closing the Skills,” © 2018 Burning Glass Technologies, BurningGlass.com 13therapists is projected to grow by at least 25% over the next 10 years.6 Growth in these
fields is projected to rise three to five times faster than the job market overall, placing
these occupations in the top 3% of all jobs in terms of projected growth.
Licensure requirements for workers, accreditation rules, and new program approval
processes for training providers impact the rate at which universities are able to expand
programs for advanced health care roles.
7. M
arkow, Will, et al., The Quant Crunch: How the Demand for Data Science Skills is Disrupting the Job Market.
Burning Glass Technologies, IBM, Business Higher Education Forum, 2017. http://burningglass.com/research/
quant-crunch-data-science-job-market/
8. B
urning Glass Technologies, Job Market Intelligence: Cybersecurity Jobs, 2015. 2015. http://burningglass.com/research/
cybersecurity/
14Computer and Information Scientist
As recently as 2012, computer scientists showed no gap at all as an occupation, but now
we see a gap of 1.2 openings for every worker. That’s the largest change of any technology
occupation over time.
The reason for the shift is the explosion in big data analysis and the growing demand
for data scientists (which the Bureau of Labor Statistics includes under the Computer
Scientist occupation).
In 2012, there were just 1,061 postings for Data Scientists. By 2016, that number grew
14-fold, to 14,653. The supply of data scientists hasn’t been able to keep up. In other
research, we identified data analytics as a “disruptive skill” that shakes up job markets
because of its crucial nature to business success, sourcing challenges, and the lack of an
established training system.7
Hybrid Occupations, Including Information Security Analysts
Security breaches have left business sectors from retail to finance scrambling for
cybersecurity talent over the last few years.8 The ratio between openings and workers is
1.5, comparable to the health care industry gap. Also like health care, more specialized
roles within the industry have larger gaps.
Interestingly, the skills gap for an information security analyst is much more severe than
for a network administrator (1.1 openings/worker), even though the latter requires many
similar skills. Employers who are able to train network administrators with cybersecurity
skills can take advantage of the overlap between the two roles and address talent
shortages more easily.
One additional factor in the information security field is the growth of “hybrid jobs,”
roles that blend skills from different domains.9 Information security roles often blend
skills from a range of disciplines including information technology, risk management,
business, and business analysis. Training designed for a hybrid job may be hard to come
by because, by their very nature, hybrid jobs don’t tend to align with existing training
programs—computer science programs don’t teach business skills, and vice versa.
For example, operations research analysts need both information technology skills and
business analysis skills. Because of this overlap requiring multiple training paths, the
skills gap for this role is larger (1.5 workers/job) than for the similar roles which blend to
create the position: computer systems analysts have a ratio of 1.2 workers per job, and
management analysts a ratio of 1.3 workers/job.
Customer Service Representatives, Personal Care Aides, Truck Drivers
A supply shortage also exists for many important and growing low- and middle-skill
occupations. Truck drivers, personal care aides, and customer service representatives all
have high ratios of openings to available workers.
There are certainly opportunities in these fields. Demand for both personal care aides
and customer service representatives is projected to grow rapidly over the next 10 years
(24% and 10%, respectively). The problem is that these jobs aren’t that attractive, with
relatively low pay and often challenging working conditions.
9. G
eneral Assembly and Burning Glass Technologies, Blurring Lines: How Business and Technology Skills Are Merging to
Create High Opportunity Hybrid Jobs. 2015. http://burningglass.com/research/hybrid-jobs/
“Different Skills, Different Gaps: Measuring & Closing the Skills,” © 2018 Burning Glass Technologies, BurningGlass.com 15Misaligned Hiring and Training
Hiring is still more art than science, and as a result many employers miss the mark in terms of
finding the employees and skills they need. Often, employers have difficulty articulating their needs
to training providers, with the consequent risk that the program will not properly prepare workers.
Occupations in this category include:
Office and Administrative Support
One example is in office and administrative support roles, which have gone from having
too many workers per opening to too few over the last five years. The ratio has swung
from 0.95 openings per worker in 2012 to 1.05 in 2016. Or, put another way, in 2012 there
were 375,933 more Office and Administrative Support workers than there were posted
openings, compared to 427,736 more openings than workers in 2016.
Partly this is because of the Great Recession and its impact on hiring. Another factor,
however, is that employers have been raising the bar for these roles. Formerly middle-
skill positions, these roles now require a bachelor’s degree. In some cases this is driven by
increasing skills requirements for a role, whereas in others it may be that hiring managers
are raising standards to bring on more credentialed candidates during a slack labor
market.
In addition, employers may also be using the bachelor’s degree as a proxy for soft skills.
These skills—communication, collaboration, time management, and so on—are crucial in
administrative roles, and employers often complain about how difficult they are to find
among high school graduates.
By requiring a bachelor’s degree, the available talent pool for these roles decreases. For
example, 37% of job postings for bookkeepers ask for a bachelor’s degree, compared to
19% of current bookkeepers who have one. In our analysis, there are 1.05 openings per
worker, or 29,748 unfilled openings. For human resources assistants, there’s an 8% gap
(37%/29%) and an imbalance of 1.12 workers per opening, or 6,629 unfilled openings.
Research also suggests that increasing credential requirements for hiring are a “sticky”
decision: once raised, the bar tends to stay raised.10
Management
Overall, management roles have larger skills gaps than those of the people they manage.
Management and supervisory roles have 1.3 openings per worker versus 1.02 for all
roles. This is true across nearly all occupation families, with the exceptions of Information
Technology and Transportation. Information technology workers, for example, are often
highly specialized, so technical skills gaps are more likely to be a problem than skills gaps
for cross-cutting management experience. By contrast, as noted above, there are supply
shortages for truck drivers because of the nature of the work.
In making this calculation, we assume that employers want to hire managers with prior
experience in the field. While there are particular skills unique to management, managers
are not infinitely transferrable. You cannot turn an information technology manager into
a nursing supervisor.
10. D
eming, David, and Lisa B. Kahn. “Skill Requirements across Firms and Labor Markets: Evidence from Job Postings for
Professionals.” Journal of Labor Economics 36, no. S1 (2018): S337-S369.
16Part 4:
Recommendations
This analysis highlights skills shortages facing employers amidst a tightening labor market. These
gaps are especially pronounced in many business-critical and high-skill roles.
But addressing skills gaps at a national scale is neither a small, nor simple problem. Resolving
skills gaps requires systemic effort from three primary actors in the workforce system: training
providers, employers, and policy makers
Improved Access to and Outcomes from Post-Secondary Education
and Training Providers
The data included in this report help to reinforce the case that there is a need for improved
access to postsecondary education, training, and credentialing opportunities. We do not suggest
that everyone needs a four-year degree, but it is clear that the most in-demand jobs require some
form of postsecondary education or training. In occupations which typically require a bachelor’s
degree, there are 25% more openings than available workers. In our new economy, fewer jobs
providing family-sustaining wages will be going to those with a high school diploma or less, and
employers are expressing the need for more high skilled workers today.
We need better alignment between the changing workforce needs of the economy and our
education and workforce systems. There are opportunities to build and reinforce alignment in
the higher education and K-12 systems with the reauthorization of the Higher Education Act and
the Carl D. Perkins Career and Technical Education Act. Alignment should include a focus on
supporting those programs that are closely linked to labor market demand as well as programs
that deliver good outcomes in terms of jobs and wages.
“The most in-demand jobs require
some form of postsecondary
education or training.”
“Different Skills, Different Gaps: Measuring & Closing the Skills,” © 2018 Burning Glass Technologies, BurningGlass.com 17Increased Connection between Employers and Higher Education
Employers too will need to play an expanded leadership role in education and workforce training
systems to ensure alignment between what people learn and the career opportunities available
in the new economy. This means that employers must not serve merely as advisors, but must
play a more significant role as customers of the education and training systems to ensure their
demand for a skilled and competitive workforce is met.
For example, this report finds that employers struggle to hire workers with the requisite
management skills. This problem will get worse in the coming years as the baby boom generation
retires. Management skills are often best developed through a combination of on-the-job
training, which employers can best provide, along with more structured training through formal
providers in higher education. Indeed, employers are in the best position to identify potential
managers who can benefit from formal training. Deepening the connection between employers
and higher education will allow both employers and higher education to play to their strengths
in building a talent supply chain for managers.
The U.S. Chamber of Commerce Foundation’s (USCCF) Talent Pipeline Management (TPM)
initiative is an example of how employers are changing the way they partner with education
and training providers to close the skills gap for their most critical positions.11 As part of the
TPM strategy, employers play an expanded leadership role as “end-customers” of flexible and
responsive talent supply chain partnerships with preferred education and training providers.
Through the newly launched TPM Academy, USCCF is training business associations and
employers on how to implement performance-based, talent supply chain solutions in
communities across America.
Improved Signaling by Employers about Labor Market Needs
If supply is going to keep up with demand in a rapidly changing labor market, employers need to
more effectively signal the competencies, skills, and credentialing requirements for their most
critical positions. In this economy, job descriptions will continue to undergo change, and the
change will be more frequent, requiring clearer and more granular signals about employer hiring
requirements that connect to their talent acquisition and hiring process.
As the job market changes and skill requirements evolve, employers can play a proactive role
in signaling their needs to workers and the training providers who support them. For example,
this report highlights skill gaps in hybrid jobs, roles which combine disparate skills and for which
few degree programs exist. Employers are likely to see hybrid trends emerging before other
stakeholders, and are best positioned to flag these needs. Data scientists and cybersecurity
analysts are two examples of hybrid roles highlighted in this report. As the workforce continues
to evolve and specialize, the need for strong signaling about emerging jobs and skills becomes
ever more critical.
More than an employer engagement challenge, better employer signaling around changing job
needs will require a technology solution. USCCF is organizing a pilot demonstration of a new job
11 To learn more about the TPM movement visit www.TheTalentSupplyChain.org.
18registry service that will help employers send faster, clearer, more dynamic signals about their
changing job requirements.12 This will be done through leveraging advances made in linked data
and open human resource data standards for describing competencies, skills, and credentialing
requirements. With employers providing structured, linked data around their hiring needs,
education and training systems will have more granular, real-time, and actionable data to align
their curriculum and credentials to improve workforce transitions.
With 4.4 million jobs unfilled because of unavailable talent, even as workforce participation
remains stubbornly low, the skills gap is increasingly costly for employers and workers alike. Yet
a crucial lesson of this research is that the skills gap is not singular; it is cumulative—the result of
different gaps across different kinds of occupations. That is part of why addressing the skills gap
has proven so elusive: it defies easy categorization. As we have shown, these mismatches affect
different corners of the market in different ways based on a range of root causes. By charting
the landscape of supply-demand imbalances more comprehensively, we hope that this report
will contribute to efforts to build a more effective labor market, highlighting both where and how
solutions can be deployed.
As the job market changes and skill requirements evolve, employers can play a proactive role in
signaling their needs to workers and the training providers who support them.
Yet a crucial lesson of this research is that the skills gap is not singular; it is cumulative—the result
of different gaps across different kinds of occupations. That is part of why addressing the skills
gap has proven so elusive: it defies easy categorization.
12 T
o learn more about the Clearer Signals project visit https://www.uschamberfoundation.org/blog/post/
reinventing-employer-signaling-rapidly-changing-talent-marketplace.
“Different Skills, Different Gaps: Measuring & Closing the Skills,” © 2018 Burning Glass Technologies, BurningGlass.com 19Appendix:
Table 1: Demand and Supply Ratio and Surplus Job Openings by Occupation
Demand/
Occupation Family Surplus Job Openings
Supply Ratio
Health Care Practitioners 1.44 1,153,617
Business and Financial Operations 1.21 985,214
Computer and Mathematics 1.17 356,527
Architecture and Engineering 1.15 151,976
Transportation and Material Moving 1.13 558,339
Health Care Support 1.09 133,217
Building and Grounds Cleaning and Maintenance 1.09 176,978
Sales 1.05 388,857
Farming, Fishing, and Forestry 1.05 3,541
Office and Administrative Support 1.05 461,263
Life, Physical, and Social Science 1.05 22,229
Installation, Maintenance, and Repair 1.02 34,063
Personal Care 1.00 -1,249
Production 0.97 -108,282
Food Preparation and Service 0.87 -1,238,927
Arts, Design, Entertainment, Sports, and Media 0.83 -181,036
Construction and Extraction 0.80 -630,576
“The skills gap is not singular;
it is cumulative—the result of
different gaps across different
kinds of occupations.”
20Table 2: Demand/Supply Ratio by Occupation Family and Year
Demand/Supply Ratio
Occupation Family
2012 2013 2014 2015 2016
Health Care Practitioners 1.23 1.19 1.27 1.42 1.44
Business and Financial Operations 1.19 1.18 1.20 1.23 1.21
Computer and Mathematics 1.25 1.21 1.21 1.21 1.17
Architecture and Engineering 1.19 1.13 1.16 1.19 1.15
Transportation and Material Moving 0.98 1.02 1.09 1.12 1.13
Health Care Support 1.04 0.97 1.06 1.10 1.09
Building and Grounds Cleaning and Maintenance 0.97 0.97 1.07 1.10 1.09
Sales 0.95 1.00 0.97 0.99 1.05
Farming, Fishing, and Forestry 1.07 1.08 1.11 1.02 1.05
Office and Administrative Support 0.96 0.97 1.01 1.04 1.05
Life, Physical, and Social Science 0.98 0.94 1.03 1.01 1.05
Installation, Maintenance, and Repair 0.86 0.91 0.95 0.97 1.02
Personal Care 0.93 0.94 0.97 0.94 1.00
Production 0.93 0.92 0.97 0.94 0.97
Food Preparation and Service 0.79 0.82 0.89 0.89 0.87
Arts, Design, Entertainment, Sports, and Media 0.79 0.81 0.83 0.84 0.83
Construction and Extraction 0.54 0.66 0.74 0.73 0.80
Overall Job Market 0.95 0.97 1.01 1.03 1.05
“Mismatches affect different corners
of the market in different ways
based on a range of root causes.”
“Different Skills, Different Gaps: Measuring & Closing the Skills,” © 2018 Burning Glass Technologies, BurningGlass.com 21About Burning glass technologies
Burning Glass Technologies delivers job market analytics that empower employers, workers,
and educators to make data-driven decisions. The company’s artificial intelligence technology
analyzes hundreds of millions of job postings and real-life career transitions to provide insight
into labor market patterns. This real-time strategic intelligence offers crucial insights, such as
which jobs are most in demand, the specific skills employers need, and the career directions that
offer the highest potential for workers. For more information, visit BurningGlass.com.
About the U.S. Chamber of Commerce Foundation
The U.S. Chamber of Commerce Foundation is dedicated to strengthening America’s long-
term competitiveness. We educate the public on the conditions necessary for business and
communities to thrive, how business positively impacts communities, and emerging issues and
creative solutions that will shape the future..
22BURNING GLASS TECHNOLOGIES
One Lewis Wharf, Boston, MA 02110
+1 (617) 227-4800
BurningGlass.com
© 2018
“Different Skills, Burning
Different Glass &Technologies
Gaps: Measuring Closing the Skills,” © 2018 Burning Glass Technologies, BurningGlass.com 24You can also read