DISCUSSION PAPER SERIES - 'Bachelors' and Babies: The Effect of Tertiary Education Expansion on Fertility - IZA ...
←
→
Page content transcription
If your browser does not render page correctly, please read the page content below

DISCUSSION PAPER SERIES

IZA DP No. 14672

‘Bachelors’ and Babies: The Effect of
Tertiary Education Expansion on Fertility

Tushar Bharati
Simon Chang
Qing Li

AUGUST 2021
DISCUSSION PAPER SERIES

IZA DP No. 14672

‘Bachelors’ and Babies: The Effect of
Tertiary Education Expansion on Fertility

Tushar Bharati                                                 Qing Li
University of Western Australia Business                       Shanghai University
School
Simon Chang
University of Western Australia Business
School and IZA

AUGUST 2021

Any opinions expressed in this paper are those of the author(s) and not those of IZA. Research published in this series may
include views on policy, but IZA takes no institutional policy positions. The IZA research network is committed to the IZA
Guiding Principles of Research Integrity.
The IZA Institute of Labor Economics is an independent economic research institute that conducts research in labor economics
and offers evidence-based policy advice on labor market issues. Supported by the Deutsche Post Foundation, IZA runs the
world’s largest network of economists, whose research aims to provide answers to the global labor market challenges of our
time. Our key objective is to build bridges between academic research, policymakers and society.
IZA Discussion Papers often represent preliminary work and are circulated to encourage discussion. Citation of such a paper
should account for its provisional character. A revised version may be available directly from the author.

                                                     ISSN: 2365-9793

                                           IZA – Institute of Labor Economics
Schaumburg-Lippe-Straße 5–9                      Phone: +49-228-3894-0
53113 Bonn, Germany                             Email: publications@iza.org                                    www.iza.org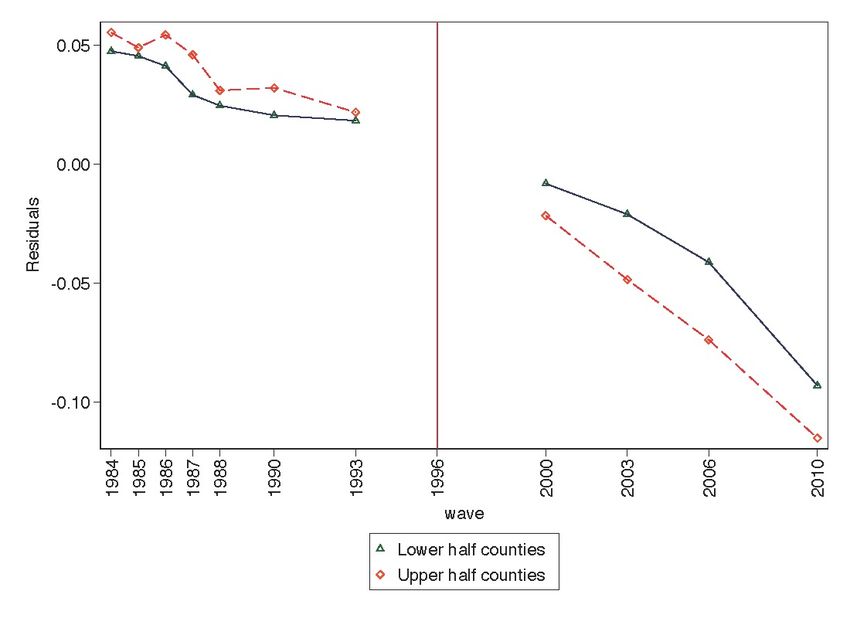
IZA DP No. 14672                                                                                         AUGUST 2021

            ABSTRACT
            ‘Bachelors’ and Babies: The Effect of
            Tertiary Education Expansion on Fertility
            We draw attention to two identification issues with previous studies that utilized tertiary
            education expansion to estimate the causal effect of education on fertility: (i) the mis-
            categorization of women past the usual college-entry age as “unexposed” to the
            expansion, and (ii) a possible violation of the exclusion restriction when using the expansion
            as an instrument for female education. We exploit the tertiary education expansion in
            Taiwan starting in 1996, with a novel focus on women past college-entry age, to document
            significant negative effects on the fertility of women as old as 30 at the onset of the
            expansion. We also show that the expansion lowered the fertility of women both with and
            without tertiary education, suggesting that the effect did not operate through education
            alone.

            JEL Classification:        I23, J13
            Keywords:                  college expansion, marriage market, fertility, Taiwan

            Corresponding author:
            Simon Chang
            University of Western Australia
            35 Stirling Highway
            Crawley, WA 6009
            Australia
            E-mail: simon.chang@uwa.edu.au
1 Introduction
With the rapid decline in fertility coinciding with the global massification of higher education, researchers
have become increasingly interested in the relationship between tertiary education and fertility (Figure 1).1
Currie and Moretti (2003) use the expansion in the number of two-year and four-year colleges in the United
States between 1940 and 1996 to document a plausible causal negative effect of the education of women
on fertility. Tequame and Tirivayi (2015) show that women with tertiary education in Ethiopia were 25%
less likely to ever give birth than those without. Choi (2018) argues that the expansion of tertiary education
had a negative effect on the fertility of college-educated women in South Korea. James and Vujić (2019)
show that post-compulsory education expansion in England and Wales delayed childbearing because of a
combination of human capital and signalling effects. Kamhöfer and Westphal (2019) use the increase in
the number of colleges in Germany between the 1960s and the 1980s to show that while college education
reduced the likelihood of becoming a mother, college-educated mothers had more children than mothers
without a college education. They claim that the family-friendliness of jobs for graduate women was an im-
portant driver. Kountouris (2020) finds that an increase in the supply of higher education and a concurrent
schooling reform in Greece jointly had a large negative effect on fertility by age 30, driven by the increasing
opportunity cost of children.2 Table 1 lists these studies with the samples and methods they use as well as
the outcomes they examine.
In this article, we draw attention to two identification issues of these previous studies that might bias
the estimates they report. First, these studies typically use some exogenous variation in access to tertiary
education around college-entry age, comparing college-aged cohorts with older cohorts, to instrument for
tertiary educational attainment. For example, Currie and Moretti (2003) use the number of four-year and
two-year colleges in a woman’s county in her 17th year. Tequame and Tirivayi (2015) compare women aged
1
Vollset et al. (2020), who predict that 183 out of the 195 countries in their data will have below-replacement total fertility rate
by 2100, suggest the continued rise in female educational attainment and contraceptive use, which is partly influenced by education,
could accelerate the global fertility decline further.
2
In comparison to school education, returns to a tertiary degree are higher, increasing the opportunity cost of bearing children
(Autor, 2014). University education may also decrease search costs and increase the quality of the spouse, speeding up or delaying
marriage and fertility (Lavy and Zablotsky, 2015). Women in universities may be better able to process the knowledge about family
planning and contraception they learn (Thomas et al., 1991). Since university education also overlaps with the major child-bearing
years of a woman’s life, it might also have a larger incapacitation effect: reduced time for child bearing and rearing (James and Vujić,
2019). Moreover, the sub-population most affected by compulsory schooling laws are typically women from low socioeconomic
groups at the risk of dropping out, while women most affected by the expansion of tertiary education are likely to be better off.
Therefore, predicting the effect of college education on fertility on the basis of the evidence on the effect of high school education
on fertility is unwise.
118 to 19 at the time of tertiary education expansion in Ethiopia in 2000 to those aged 20 to 21. Choi (2018)
examines the effect of the increased supply of tertiary education for South Korean high school graduates at
age 19. James and Vujić (2019) examine the change in fertility of English and Welsh women exposed to
the increased supply of tertiary education at age 18. Kamhöfer and Westphal (2019) study the change in
the fertility of German women exposed to an increased supply of tertiary education institutions at age 19.
Kountouris (2020) uses the tertiary education expansion in Greece that affected women at age 17. However,
tertiary education institutions rarely have entry age limits. It is not uncommon for women of college-entry
age to delay enrollment or for those past the college-entry age to return to college. As we describe below,
women past the usual college-entry age may also be affected through channels other than a return to col-
lege. Categorizing older women who might still respond to such tertiary education expansions as unaffected
individuals (control group) is likely to bias the estimates reported in these studies.
Second, the above-mentioned studies use the instrumental variable technique to estimate the effect of
tertiary educational attainment of women on fertility.3 Their instrument for tertiary educational attainment
is a woman’s exposure to the tertiary education expansion during the “college-age” years. The validity of
the causal estimates depends crucially on the assumption that the expansion in tertiary education in these
countries affected fertility through no other channels except tertiary educational attainment. The assump-
tion is unlikely to hold for a variety of reasons. For example, tertiary education expansions, at least the ones
considered in these studies, were not gender-specific. They affected men too. The expansions, as a result,
are likely to have affected the marriage market for all marriage-age women, exposed or otherwise, changing
the pool of potential husbands a woman chooses from, in terms of both quantity and quality. Men who
went back for tertiary education might have been unavailable. While any changes in the fertility preference
of women who went back to colleges as a result of the expansions is a pathway accounted for by the in-
strument variable approach, such expansions could have also affected the marriage and fertility preferences
of exposed males. Since realized fertility is a function of the fertility preferences of both partners, women
whose decisions to obtain tertiary education were unaffected by the expansion could have also changed their
fertility if they matched with men with preferences different from those of the men they would have other-
wise matched with in the absence of the expansion. Similarly, there might have been labor market effects.
If a significant number of men and women went back to colleges because of the expansion, it could have
3
Admittedly, this alleviates the bias in the reduced-form estimates.
2affected the labor supply and wages for even those who did not go back to college. This could have changed
the opportunity cost of bearing and rearing children, affecting realized fertility.
We elucidate these concerns with empirical evidence from Taiwan. We use a 1996 law that allowed
junior colleges to upgrade to bachelor’s granting institutions (BGIs) to examine the effect of the increase
in tertiary education supply on fertility. The number of junior colleges that were eligible to apply for this
upgrade differed across counties and years, allowing us to use a difference-in-differences strategy.4 In Tai-
wan, the usual college entry age is 18. If we were to follow the method in the studies cited above, we would
compare women who were 18 to 21 years old at the onset of the expansion with women who were 22 or
older. Instead, we compare women aged 21 to 30 at the onset of the expansion with women aged 36 to 50 in
regions with varying level of upgraded BGIs. We purposely examine the effect of the expansion on the fer-
tility (and marriage) outcomes at ages 30 to 35. In contrast to the existing studies, since the control cohorts
in our study were already past these ages in 1996, their outcomes cannot be affected by the expansion.
We show that the increase in BGIs positively affected the educational attainment of 21- to 30-year-old
women. Exposed women were also less likely to be married or have children by ages 30 to 35. Four more
BGIs, the sample average, in a county results in six fewer children by age 35 per 100 women. In other
words, women who are usually considered to be unaffected by such expansions saw a large, significant
reduction in fertility and marriages. The expansion had larger short-run effects on women aged 21 to 25
compared to women aged 26 to 30 in 1996. This is expected as younger women had a greater scope for
intertemporal reallocation of fertility. Consistent with this, the effects on the fertility of women aged 21
to 25 and 26 to 30 in 1996 were comparable by the time they reached 35 years of age. The short-term
decline in the fertility of younger women was, to some extent, compensated with increased fertility in later
years. This observation indicates no guarantee that women closer to the usual college-entry age during the
expansion will be affected more by such an expansion than women who are slightly older. We also show
that the expansion had no effect on teenage fertility (ages 15 to 20), indicating that such tertiary education
expansion might affect fertility through mechanisms other a than reduction in teenage fertility as a result
of the “incapacitation” effect (Currie and Moretti, 2003; Black et al., 2008; Silles, 2011; Cygan-Rehm and
4
As we explain in detail ahead, whether a junior college qualified to be upgraded depended on a host of pre-determined
variables.
3Maeder, 2013; Fort et al., 2016).
Next, to demonstrate the validity of our second concern, we show that the expansion had comparable
effects on the fertility of women with and without bachelor’s or higher degrees. This is direct evidence that
the expansion affected fertility through channels others than educational attainment. Using such tertiary
education expansions as instruments, therefore, might violate the exclusion restriction/unconfoundedness
assumption biasing the estimates in previous studies. We show that women exposed to the expansion who
did not get tertiary degrees were also less likely to be married by ages 30 to 35, suggesting that changes in
the demand and supply factors in the marriage market could be one such alternative pathway through which
the expansion affected fertility. It is therefore wise to approach the predictions and claims about the large
negative effect of female education on fertility with a grain of salt (Vollset et al., 2020) and to reconsider our
identification strategy when examining the question.
More broadly, we make some additional observations about the effect of the tertiary education expansion
in Taiwan. The fertility effect we find is driven by changes at the extensive margin, i.e. the probability of
having any child. This is not surprising since the total fertility rate in Taiwan was already below the replace-
ment rate at the time. While the impact of the tertiary education expansion on fertility we find is consistent
with findings from other countries, the effects for Taiwan operate mainly through a reduction in marriages
and not teenage pregnancies or assortative mating. We also find significant heterogeneity in the effect of
the BGI expansion. Public and older BGIs, which were more reputed and able to attract more students,
have larger impacts than private and newer ones. A higher increase in BGIs closer to county administrative
centres has a stronger effect than those farther away. The fact that the effect varies by the BGI characteristics
adds further evidence that the estimates capture the causal effect of the expansion but not necessarily that of
educational attainment.
The rest of this paper is organized as follows. Section 2 provides the institutional background and
documents the fertility trend in Taiwan. Section 3 describes our data sources. We describe our identification
strategy and the empirical model in Section 4 and report the results in Section 5. Section 6 concludes.
42 Institutional Background and Fertility Trends in Taiwan
2.1 Educational System in Taiwan
After completing nine years of compulsory education, students in Taiwan must choose a track if they wish
to continue their education (Appendix Table A1). Students can go for three years of senior high school or
five years of junior college after junior high. The first three years in a five-year junior college are equivalent
to senior high school, and the last two years are equivalent to the first two years in a university. Five-year
junior college tracks award students diplomas if they graduated before 2004 or associate bachelor (AB) de-
grees if they graduated afterwards. Regardless of the track chosen, students finishing compulsory education
generally have to pass an entrance exam to advance to the next level of education.
Graduates from senior high can pursue bachelor’s degrees by attending a university or an institute of
technology, which typically takes four years.5 If they attend a two-year junior college, they earn AB degrees
(diplomas, if graduated before 2004), unless they continue on to a two-year track institute of technology,
which award them bachelor’s degrees at graduation. After bachelor’s degrees, students can pursue higher
degrees at the graduate school level. The major distinctions between junior college and other tertiary ed-
ucation institutions such as universities and institutes of technology are the academic degrees they award
and the time required to complete the education. The AB degree (or a diploma if graduating before 2004),
which takes only two more years after senior high, is one level below the bachelor’s degree, which takes
four years to complete. Even the five-year junior college track is equivalent to three years of senior high
plus two years of junior college. Therefore, students typically earn their AB at age 20 and bachelor at age 22.
One salient feature of the higher education expansion in the mid-1990s is that a large number of ju-
nior colleges were upgraded to bachelor’s degree-granting institutions (BGIs). The following subsection
describes the tertiary expansion policy in more details.
2.2 The Higher Education Expansion Policy in 1996
Taiwan is a Confucian society that puts a high value on education. However, the establishment of higher
education institutions had been strictly controlled by the government until the early 1990s (Lin and Lin,
5
Some majors, like law and medicine, take longer.
52012). On April 10, 1994, thousands of parents, education advocates, and non governmental organizations
took the street in the capital city, Taipei, demanding more universities to be set up. In response, the gov-
ernment introduced a new policy in 1996 that allowed junior colleges, mostly private institutions, to apply
to be upgraded to BGIs if they met certain requirements.6 Specifically, to be upgraded to a BGI, a junior
college needed to meet various requirements around the number of staff, infrastructural facilities, number of
buildings, and land size. The policy also required the junior college to have had outstanding records in the
five years prior to their application, actively engaged in practical research, collaborated with the industry,
and possessed sound management and administration. The Ministry of Education (MOE) was responsible
for reviewing the applications. The review took place once a year and consisted of two stages. The first
stage reviewed the paperwork, and the second stage involved an on-site visit and interviews.
A vast majority of junior colleges that existed before 1996 were upgraded to BGIs within a decade. As
shown in Figure 2a, the number of junior colleges had remained stable until 1996, after which it plummeted
sharply. Meanwhile, the slow upward trend of BGIs accelerated after 1996. Specifically, 70 junior colleges
were upgraded to BGIs between 1996 and 2010, while another 15 new junior colleges were established over
this period. The number of BGIs increased by 91 (from 66 to 157), of which 70 were upgraded from junior
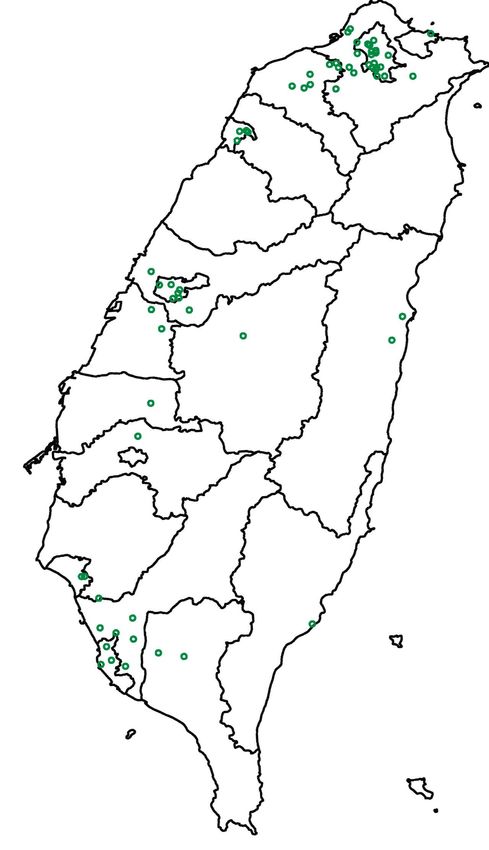
colleges and 21 were newly established.7 Figure 3 shows the geographic distribution of the BGIs in 1995
and 2010. The increase in BGIs was along the western plains and, to a lesser extent, along the eastern coastal
line. The area between the western plains and the eastern coastal line is the Central Mountain Range with
few inhabitants. The major distinction between junior colleges and BGIs, as mentioned before, is that BGIs
can confer bachelor’s degrees or higher, but junior colleges cannot.
The share of population enrolled in BGIs increased significantly. Figure 2b shows the share of men
and women of ages 17 to 22 who enrolled in BGIs increased from about 10% in 1995 to nearly 50% in
2010. Strikingly, there was also a substantial increase in students of more mature ages. The share of men
aged 23 to 29 who were enrolled in BGIs increased from 4% to 9%, while the enrollment of women of the
same age increased from 2% to nearly 7%. This indicates that the BGI expansion affected not only those of
college-entry age but also those of more mature age. The composition of graduates from higher education
6
BGIs include both universities or institutes of technology.
7
Appendix Table A6 lists all BGIs in Taiwan.
6institutions also changed accordingly, albeit with a predictable lag of the numbers of years required to
complete the degree. As reported in Figure 2c, graduates with AB degrees dropped precipitously, while
graduates with bachelor’s degrees increased. Since BGIs also granted postgraduate degrees, we see a rise in
master’s and PhD degrees.
2.3 Fertility Trend in Taiwan
Taiwan was one of the first countries outside the OECD to experience a sharp and sustained decline in
fertility (Schultz, 1997). This was a result of a combination of factors, including one of the first and im-
mensely effective national family planning programs in the world (Hermalin et al., 1968; Freedman et al.,
1972; Schultz, 1973, 1974) and rapid economic growth that increased female labor force participation and
the opportunity cost of children (Lin and Yang, 2009). Figure 4 reports two fertility indicators, the crude
birth rate (CBR) and the total fertility rate (TFR), from 1974 to 2018. The two indicators, by and large,
move in tandem.
Fertility fell throughout the 1970s and the first half of the 1980s, before stabilizing for a decade. Noting
that its objective of controlling the rapid increase in population was achieved, the government terminated
the family planning program in 1990 (Lin and Yang, 2009). By this time, the TFR had already dropped
below replacement level. After remaining stable for about a decade, the TFR started to drop again around
the time when the higher education expansion started in 1996. By 2010, it had fallen below 1.8 We examine
the extent to which the 1996 education expansion policy contributed to this decline.
3 Data
3.1 Bachelor-Granting Institutions Data
We obtained the information on all higher education institutions, including AB-granting institutions (junior
college) and BGIs (university or institute of technology), from the official registers of Taiwan’s Ministry
of Education. The registers provide detailed information about each institution, including their names,
addresses, phone numbers, website addresses, and institution types. From each institution’s website, we
8
Both the CBR and the TFR are period fertility rates, while our estimations focus on the effect on the cohort fertility rate up to
age 35. Unfortunately, official cohort fertility data are not available.
7then found out whether and when it had been upgraded from an AB-granting institution to a BGI. This
allows us to calculate the annual change in the number of BGIs in each county from 1996 to 2010.
3.2 Woman’s Marriage, Fertility and Employment Survey
The fertility data comes from the Woman’s Marriage, Fertility, and Employment Survey (WMFES), a sup-
plementary survey to the Manpower Survey (MS), conducted by the Directorate-General of Budget, Ac-
counting, and Statistics, Executive Yuan of Taiwan. The MS started in 1963 as a quarterly employment
survey and has been conducted monthly since 1978. Each year, the MS draws a nationally representa-
tive sample, via a stratified two-stage sampling method, of the Taiwanese population aged 15 and older to
produce official statistics such as unemployment and labor force participation rates. Started in 1979, the
WMFES interviews all women in the MS sample. It was conducted every year in June alongside the MS
until 1988 and in 1990, 1993, 2000, 2003, 2006, 2010, 2013, and 2016. In addition to the basic demographic
information, the WMFES collects detailed information on the participants’ fertility, such as the sex and the
birth month and year of the first three children and the latest child. Based on the birth years of the mothers
and their children, we calculate the age-specific fertility for each woman up to the point of the survey. A
caveat is that fertility information is only available for women under 65.9 The WMFES also allows us to
link the respondents to their partners’ information if the respondents are married and live with their partners
in the same household.
Women eventually exposed to the expansion are relatively too young to be married and bearing children
in waves before 2003. Further, a re-delimitation of administrative boundaries at the end of 2010 render the
2013 and 2016 waves incomparable with the previous waves. As a result, we use the 2003, 2006, and 2010
waves of the survey. These waves best fit the study period. We pool the three waves for our analysis. The
two main age-specific fertility outcomes of interest are the probability that a woman had any children and
the total number of children born to her by that age.10 To understand the potential mechanisms through
which the tertiary education expansion affected fertility, we also examine the educational attainment and
marriage status of the women in the sample.
9
The 1979-1983 survey waves do not contain information about the year of birth of a woman’s children. Waves in 1984 to
1990 did not survey women aged 50 and above.
10
Since the survey collects birth year information for the first three children and the last child born to women, we cannot
construct retrospective age-specific fertility for women with more than four children. As a result, we exclude them from our
sample. They form 3% of the 35,731 observations in the pooled sample.
8Women born between 1966 and 1975, 21 to 30 years old in 1996, form the exposed group. These women
were young enough to benefit from the BGI expansion that started in 1996. To verify that our findings are
not sensitive to this definition of the exposed cohorts, we run robustness tests with different ages in 1996 as
cut-offs. The control group consists of women born between 1946 and 1960, 36 to 50 years old in 1996. We
compare the age-specific fertility and marriage outcomes at ages 30 to 35 for exposed and control groups in
regions with differing levels of change in BGIs. The outcome for women aged 30 to 35 at the time the ex-
pansion started could still be partially affected by the expansion. To keep the comparison clear, we exclude
these cohorts from the analysis.11 Since the control group population is already past the age thresholds we
measure the outcomes at, the control group mean is unaffected by the expansion. The Enrolment data from
the MOE shows only 3% of college students were of ages 30 or older in 1995.
Table 2 summarizes the outcomes of interest. Overall, about 10% of the women in our sample have
bachelor’s or higher degrees: 17% in the exposed group and 6% in the control group. The average education
gap between the women’s education and their husbands’ education, if they are married, is much smaller for
the exposed cohorts. In terms of fertility, 93% of the women in the control cohorts and 78% of the women in
the exposed cohorts had at least one child by age 35. On average, women in the control and exposed groups
had 2.4 and 1.7 children by age 35, respectively. We observe a similar pattern for marital status. About 95%
of the women in the control cohort had married by age 35, while only 84% of the women in the exposed
cohort had done so.
4 Empirical Strategy
4.1 Identification
Our identification strategy uses the variation in the number of BGIs across counties and time generated by
the 1996 expansion policy that allowed junior colleges to be upgraded to BGIs. The change in the number of
BGIs through upgrades in different counties was driven neither by county fertility trends nor by the fertility
decision of women residing in the counties. Women born in different years and living in different counties
11
This is similar to Duflo (2001), who excludes from the analysis children partially exposed to the primary school construction
program in Indonesia.
9witnessed different levels of BGI expansion depending on the number of junior colleges in their counties
that fulfilled the requirements for an upgrade. Their fertility outcomes would be affected down the road. Our
identification strategy, therefore, is a difference-in-differences method that compares women young enough
to benefit from the expansion with older women across counties with different levels of BGI expansion. The
strategy is similar to the method used, for example, by Duflo (2001) to study the effect of primary school
constructions in Indonesia and in numerous education studies since then.
We estimate the following equation:
a a a a a a
Mijcy = 0 + 1 BGIcy ⇥ T reatj + j + c + c ⇥ time + waveay + "ijcy (1)
where Mijcy
a is the fertility, marriage, or education outcome of a woman i born in year j in county c
measured in survey wave y when she was a years of age. BGIcy is the change in the number of BGIs in
county c between 1996 and year y. T reatj is an indicator variable that takes the value ‘1’ for women born
between 1966 and 1975, ‘0’ otherwise. Birth cohort fixed effects, j,
a capture time-invariant differences
across women born in different years that could affect the outcomes of interest independently. County fixed
effects, c,
a account for time-invariant differences across counties. We also include county-specific linear
time trends, timec , to allow for differential trends in the outcomes in different counties. This is to capture
the unobserved county-specific trend (e.g. economic growth) that could drive fertility and BGI expansion
simultaneously. Survey wave fixed effects, waveay , account for aggregate changes in the variables of interest
across time. Note that the waves we use are not equally spaced in time. Throughout our analysis, unless
otherwise noted, we report robust standard errors clustered at the county-cohort level. a
1 captures the effect
of the BGI expansion. More specifically, the estimate coefficient measures the effect of one additional
upgraded BGI on the outcomes for women exposed to the expansion relative to women not exposed after
controlling for birth cohort, county, and survey wave fixed effects as well as county-specific linear time
trends.
4.2 Trend Analysis
We begin by investigating the trend in the fertility of women in counties with different levels of BGIs.
For visual clarity, we group the counties in Taiwan into two: high- BGIs counties with higher than me-
10dian BGI, and the others as low- BGIs counties. We pool waves from 1979 to 1988, 1990, 1993, 1996,
2000, 2003, 2006, and 2010 to maximize the time span.12 Figure 5 reports the fertility trend for women in
high- and low- BGIs counties before and after the expansion.
For the trend figures, we first filter out any time-invariant county-level differences by regressing the
outcome on a full set of county dummies. We then plot the average of residuals from the previous regression
for the two groups for each year in Figure 5. Sub-figures 5a and 5b report the trends in women having any
children by ages 30 and 35, respectively. For the figure, we limit our sample to women aged 30 to 50 because
(i) the outcomes of interest are available for women 30 or older (ii) survey waves in before 1990 did not
have fertility information for women aged 50 and older. The fertility of women in high- and low- BGIs
counties moved in tandem before 1996. If anything, the fertility of women in high- BGIs counties was
slightly higher than the fertility of women in low- BGIs counties. The trends clearly diverged after 1996.
The probability of having any child for high- BGIs counties was significantly lower than in the low-
BGIs counties once the expansion started. The trends suggest the divergence in the outcomes is less
likely to be driven by unobserved factors that are common across regions.
5 Results
5.1 Main Results
Table 3 reports the estimated impact of the expansion on the age-specific probability of having any children
between ages 30 and 35. The estimates reported in Panel A suggest the BGI expansion was associated with
a significantly lower probability of exposed women having any children by the relevant ages. The coef-
ficient hovers around 0.009, implying that one more BGI in the county lowered a woman’s probability of
having any child by these ages by nearly one percentage points. Given that the sample average of BGIs
is about four, the expansion reduced the probability of having any children nearly four percentage points
(0.009 ⇥ 4 = 0.036). This translates to almost 4% fewer women having any children. As Appendix Table
A2 shows, the estimated effect is not sensitive to the age cutoff we choose to define the exposed and control
cohorts. The estimated effect on the probability of having any children by the younger ages of 26 to 30 are
similar to the main estimates in Table 3 (see Appendix Table A4). The effect on the number of children,
12
Recall, we only use waves 2003, 2006, and 2010 in our main analysis.
11since many of them have still not started having children, is predictably muted. In comparison, the expan-
sion did not affect teenage fertility, which was already quite low in Taiwan (Appendix Table A3).
The effect of the expansion is unlikely to be the same for all women exposed to it. Women exposed
to the expansion in their late twenties faced a tougher trade-off than younger women who had more time
to plan. Students in Taiwan typically start their tertiary education at 17 years of age. The probability that
someone who did not start tertiary education at the end of high school will enrol for a tertiary degree later
is likely to decline with age. Older women exposed to the expansion are less likely to have enrolled for a
bachelor’s degree as a result of the expansion than younger women exposed to the expansion. The average
age of women at marriage in Taiwan around the time was 26 years. As a result, the possibility of adjusting
the timing of marriage and fertility to accommodate tertiary education was also smaller for older women.
To examine these dynamics, we divide the treatment group into two groups: those born between 1971 and
1975 (Treat 1, ages 21-25 in 1996) and those born between 1966 and1970 (Treat 2, ages 26-30 in 1996).
The control group remains the same.
The results in Panel B confirm our conjecture. While the effect of the expansion on the probability
of women having any children by the age of 30 is higher for the younger cohorts, the effect size fell con-
siderably as they grew older. That is, younger women recovered from their fertility slump over time. In
comparison, even though the effect of the expansion starts out as small for the older women, they do not
recover from the decline in fertility the expansion generates.13 The older and younger women who enrolled
for tertiary degrees received the same kind of education. Any effect that education might have had on their
fertility preference is likely to be comparable. The difference in the estimated effects suggests that a part of
the effect of the expansion operated through tightening the time constraint for women rather than changing
their preferences around fertility. Although most of these women are not past their reproductive ages, bear-
ing the first child after 35 is extremely rare in Taiwan.14 The impact of the expansion in tertiary education
appears to have had a permanent effect on the fertility of the exposed women.
Note that women in both the younger and the older exposed cohorts are past the usual “college-entry
13
Later, when we examine the mechanisms, we show that the smaller reduced-form effect of the expansion on older women is
because a smaller number of them enrolled for a tertiary degree as a result of the program.
14
Out of 29,193 women in our sample, only 374 had their first child after 35.
12age” of 18 but there are strong effects on their fertility. This is not surprising. As mentioned before, tertiary
education institutes rarely have any entry-age requirements. Although the effect of such an expansion is
likely to be smaller for older women, it might still be substantial. Using these older cohorts as the control
group, as done in most prior studies examining the impact of tertiary education on fertility, is likely to bias
estimates.
From a methodological viewpoint, a graver problem is the possibility that educational attainment might
not be the only channel through which such tertiary education expansions may affect women’s fertility. As
discussed before, the studies listed in Table 1 use tertiary education expansions as instruments for female
educational attainment. The validity of their causal estimates of tertiary educational attainment on fertil-
ity depends crucially on the fulfilment of the exclusion restriction/unconfoundedness requirement. In other
words, the tertiary education expansion should affect fertility only via tertiary educational attainment of
women. To test whether the requirement is satisfied, we estimate the reduced-form effect of the BGI ex-
pansion in Taiwan on the fertility of women with and without tertiary education (Table 4). The estimates
suggest the effect of expansion on the fertility of women who did not complete their degrees in response
to the expansion (Panel B) was almost as large as for women who completed tertiary degrees (Panel A). If
educational attainment had been the only channel through which the expansion affected fertility, this would
have not been the case. The findings raise the possibility that tertiary education expansions as instruments
for female educational attainment might not satisfy the exclusion restriction/unconfoundedness requirement
in the studies listed in Table 1, biasing their reported estimates.
We also estimate the effect of the expansion on the number of total children at these ages. We report
the results in Panels C and D of Table 3. The sample includes women with no children. In Panel C, the
coefficients range from 0.0122 to 0.0145, implying that four more additional BGIs reduced the number
of children by about 0.06 for an average woman or about six children per 100 women. Comparing these
with the estimates in Panel A, it appears that most of the effect was at the extensive margin: the probability
of having any child. The results in Panel D confirm the findings in Panel B. The effect started out larger for
the younger cohorts (Treat 1) but declined as they aged. For the older cohorts, the negative impact of the
expansion on the number of children increased with age.
13Different BGIs varied in their student intake. An upgraded BGI with a higher enrolment is likely to
have a larger impact in comparison to another BGI with a smaller capacity. Unfortunately, we do not have
information on the exact capacity of the BGIs in each year. To consider the size effect, we replace BGIs
with the change in enrolment in the first year of undergraduate studies at the BGIs in each county since
1996. The results, reported in Appendix Table A5, are qualitatively consistent. However, since enrolment is
jointly determined by both supply and demand for tertiary education, we prefer using BGIs for our main
analysis.
Finally, it is useful to benchmark our estimates against those reported in these previous studies. While
the above-mentioned studies typically focus on local average treatment effect, many also report the reduced-
form effects of the expansion. Unfortunately, since each expansion differs from others, the estimates are not
directly comparable. Nonetheless, the comparison may still be useful in providing a sense of the likelihood
of bias in the estimated coefficients. Compared to our estimates of a close to 1% decrease in fertility due to
the expansion, Currie and Moretti (2003) report an 8 to 9% reduction in fertility caused by the expansion.
Tequame and Tirivayi (2015) also find an 8% reduction in fertility as a result of the education expansion in
Ethiopia. Choi (2018) reports an extraordinary 45% reduction in fertility caused by the college expansion
in South Korea. Closest to our estimates are those reported by Kountouris (2020): a 2.2 percentage point
decrease in fertility as a result of the education reforms in Greece.15 The effect of the expansion in Taiwan
may have been smaller because fertility was already below replacement, leaving little room for adjustment.
However, as we discussed above, a bias in the estimated fertility effect of education in these studies is also
a possibility.
5.2 Mechanisms
The expansion of BGIs could have affected women’s fertility through education, marriage, or labor market
participation and income. Next, we investigate the effect of the expansion on women’s highest educational
attainment, their marital status, and their husbands’ highest educational attainment if they were married.
We do not have information on when the surveyed women completed their highest educational attain-
15
Kamhöfer and Westphal (2019) do not report reduced-form estimates. James and Vujić (2019)’s outcomes are not comparable.
They find exposure to the tertiary education expansion in England and Wales increased the probability of first birth aged 30 or above
for exposed women by 13.3%.
14ment. Since the youngest cohort in our sample was 28 years old or older at the time of the first survey wave,
the women’s highest educational attainment could still provide us with useful information on the mechanism
through which expansion affected fertility. Panel A of Table 5 reports the estimated effects of the expansion
on women’s probability of completing a bachelor’s (column (1)) and a master’s degree or above (column
(2)). Relative to the control group, four more BGIs increase the probability of having a bachelor’s degree by
about 1.2 percentage points (0.0033 ⇥ 4.2041). Considering that only 15% of the women in the sample have
ever obtain a bachelor’s degree, the effect of the BGI expansion on education was predictably substantial.
It also increased the women’s likelihood of obtaining a master’s or a higher degree by about 0.7 percentage
points (0.0017 ⇥ 4.2041). With only 3% of women ever obtaining a master’s or higher degree, the BGI
effect on postgraduate degrees was even greater. Panel B shows the expansion affected female education,
and therefore fertility through this channel, only for women who were relatively young at the time of the
expansion. For older women, there was no significant change in educational attainment as a result of the
expansion. The results suggest that, as expected, the expansion affected women’s propensity to get tertiary
degrees, which is bound to have reduced the time available to bear and rear children. But this was true only
for relatively younger women. For older women, the expansion affected fertility through channels other than
educational attainment.
Another possibility is that women with higher degrees married men with similar or higher education.
These men with higher education might have had a preference for lower fertility (James and Vujić, 2019).
However, the results in Panel C and D show that the education levels of the husbands of exposed women
were no different than the education levels of the husbands in the control group. This is true for both younger
and older exposed women. Mechanisms related to the husbands’ characteristics did not drive the fertility
effect.
In terms of the marital outcome, the BGI expansion reduced marriages. Table 6 reports the estimated
effect of the BGI expansion on the probability of being married by ages 30 to 35. The estimates in Panel A
stay at about -0.007. This implies that four more BGIs lowered the probability of women getting married
by these ages by nearly three percentage points (0.007 ⇥ 4.1687). Consistent with Table 4, in Panel C, we
find exposed women without tertiary degrees were also significantly less likely to be married. In light of
these findings, using tertiary education expansions as instruments for the tertiary educational attainment of
15women, as stated before, violates the exclusion restriction/unconfoundedness requirement. In each panel,
we also report the heterogeneity in the effect for younger and older exposed women.
General equilibrium effects, such as the labor market changes resulting from a sudden increase in col-
lege enrollments, are potential mechanisms through which the expansion might have affected the marriage
propensity of women without tertiary degrees. Labor market effects could have also affected fertility directly
regardless of marital status by changing the opportunity cost of children. Unfortunately, we do not have in-
formation on the labor force participation of the exposed women. The information we use was collected at a
time when many women might not have entered the labor market yet. Since labor market outcomes evolve
continuously, our empirical model is unsuitable for examining employment outcomes.
5.3 Heterogeneity
BGIs differ in their attributes, and that affects their ability to attract students. It is possible that upgraded
BGIs that did not have the same reputation, legacy, or accessibility as others affected fertility to a lower
extent. We study three attributes of the upgraded BGIs: ownership, tenure, and travel time. We define own-
ership based on whether a BGI is a public or private institution. Tenure is the years since the establishment
of the institution. All the institutions in our sample were established before 1996. Travel time is measured
in terms of the time it takes to travel from a county administrative center to a BGI in a car under normal
traffic conditions. We present the results in Table 7.
Public BGIs in Taiwan are generally better ranked than private ones. Older institutions are better known
than relatively newer ones. We expect public and older BGIs would have had larger effects on fertility than
private and newer ones. Panels A and B of Table 7 confirm this. The effect of an upgraded public BGI on
fertility was one and a half to three times larger than that of a private BGI. This was despite the fact that the
number of private BGIs was almost five times larger. We group the BGIs into new and old based on whether
they have a tenure greater than the average tenure of upgraded BGIs in the sample. We find the effect of
upgrading older BGIs was about three to six times larger that that of newer BGIs.
In principle, students from anywhere in Taiwan could have applied to any of the upgraded BGIs but po-
tential students are likely to have factored in travel time when choosing BGIs. To investigate this possibility,
16we calculate the travel time by car from a county administrative center to each BGI. Then we group the BGIs
into within or outside the half-hour zone. The BGIs outside each zone include all BGIs in Taiwan other than
those inside the travel zone of each county administrative center. The zone may not perfectly overlap with
the country. Panel C reports the effect of an extra upgraded BGI within the half-hour travel zone on fertility
relative to BGIs outside the travel zone. A higher number of BGIs within a shorter travel distance tends to
have larger effect than those farther away.
The fact that the heterogeneous effect of BGI expansion on fertility is in line with the expected hetero-
geneity of BGI expansion on enrolment and graduation further suggests that the decline in fertility was due
to the tertiary education expansion. However, as we pointed out before, it might not all have been due to the
increase in tertiary educational attainment of women.
6 Conclusion
The threat of depopulation in most advanced economies has experts rattled and governments seeking ways
to boost fertility. Planning the right policy response to this crisis requires an understanding of the factors
driving this decline in fertility. Previous studies from across multiple countries show that tertiary education
of women have large negative effects on their fertility. Yet, we draw attention to two identification issues
that may have biased the previous estimates.
First, we argue that treating women past the usual college-entry age as unexposed to the tertiary ed-
ucation expansions might be problematic. Unlike lower levels of education, tertiary education rarely has
entry-age restrictions. Some women past the college-entry age might return to college in response to ex-
pansions in tertiary education. Similarly, some college-entry age women may choose to delay their college
education. Second, large expansions in the tertiary education sector are likely to affect fertility of women
through channels other than their increased enrollment in colleges. For example, such expansions may
change the quality and quantity of potential partners in the marriage market. This, in turn, may affect the
prospects of marriage and fertility for women. Therefore, using tertiary education expansions as an instru-
ment for educational attainment possibly violates the exclusion restriction.
17To illustrate these concerns, we study the case of Taiwan with a focus on women past the usual college-
entry age. We find significant negative effects on the fertility of women as old as 30 at the onset of the
expansion. In addition, we find that the expansion lowered the fertility of women both with and without
tertiary education, suggesting that the effect did not operate through education alone. Taken together, our
findings point out that the relationship between tertiary education expansion and fertility is more compli-
cated than what it might appear to be at first glance. Future research is required to examine the potential
biases in the results from previous studies because of the two identification issues.
18References
Autor, D. H. (2014). Skills, education, and the rise of earnings inequality among the “Other 99 percent”.
Science 344(6186), 843–851.
Black, S. E., P. J. Devereux, and K. G. Salvanes (2008). Staying in the classroom and out of the maternity
ward? The effect of compulsory schooling laws on teenage births. The Economic Journal 118(530),
1025–1054.
Choi, S. (2018). Fewer mothers with more colleges? The impacts of expansion in higher education on first
marriage and first childbirth. Demographic Research 39, 593–634.
Currie, J. and E. Moretti (2003). Mother’s education and the intergenerational transmission of human capital:
Evidence from college openings. Quarterly Journal of Economics 118(4), 1495–1532.
Cygan-Rehm, K. and M. Maeder (2013). The effect of education on fertility: Evidence from a compulsory
schooling reform. Labour Economics 25, 35–48.
Duflo, E. (2001). Schooling and labor market consequences of school construction in Indonesia: Evidence
from an unusual policy experiment. American Economic Review 91(4), 795–813.
Fort, M., N. Schneeweis, and R. Winter-Ebmer (2016). Is education always reducing fertility? Evidence
from compulsory schooling reforms. The Economic Journal 126(595), 1823–1855.
Freedman, R., L. C. Coombs, and M.-C. Chang (1972). Trends in family size preferences and practice of
family planning: Taiwan, 1965-1970. Studies in Family Planning 3(12), 281–296.
Hermalin, A. I., R. Freedman, and J. Y. Takeshita (1968). Taiwan: An area analysis of the effect of accep-
tances on fertility. Studies in Family Planning 1(33), 7–11.
James, J. and S. Vujić (2019). From high school to the high chair: Education and fertility timing. Economics
of Education Review 69, 1–24.
Kamhöfer, D. A. and M. Westphal (2019). Fertility effects of college education: Evidence from the German
educational expansion. DICE Discussion Paper. URL: https://www.econstor.eu/bitstream/10419/201868/
1/1671787935.pdf. [date accessed: 2021-07-04].
19Kountouris, Y. (2020). Higher education and fertility: Evidence from reforms in Greece. Economics of
Education Review 79, 102059.
Lavy, V. and A. Zablotsky (2015). Women’s schooling and fertility under low female labor force participa-
tion: Evidence from mobility restrictions in Israel. Journal of Public Economics 124, 105–121.
Lin, C.-Y. and C.-H. A. Lin (2012). Does higher education expansion reduce credentialism and gender
discrimination in education? Social Indicators Research 109(2), 279–293.
Lin, W.-I. and S.-Y. Yang (2009). From successful family planning to the lowest of low fertility levels:
Taiwan’s dilemma. Asian Social Work and Policy Review 3(2), 95–112.
Schultz, T. P. (1973). Explanation of birth rate changes over space and time: A study of Taiwan. Journal of
Political Economy 81(2, Part 2), S238–S274.
Schultz, T. P. (1974). Birth rate changes over space and time: A study of Taiwan. In T. W. Schultz (Ed.),
Economics of the Family: Marriage, Children, and Human Capital, pp. 255–296. University of Chicago
Press.
Schultz, T. P. (1997). Income inequality in Taiwan 1976-1995: Changing family composition, aging, and
female labor force participation. Yale University Discussion Paper. 786. URL: https://elischolar.library.
yale.edu/egcenter-discussion-paper-series/786. [date accessed: 2021-07-04].
Silles, M. A. (2011). The effect of schooling on teenage childbearing: Evidence using changes in compul-
sory education laws. Journal of Population Economics 24(2), 761–777.
Tequame, M. and N. Tirivayi (2015). Higher education and fertility: Evidence from a natural experiment in
ethiopia. UNU-MERIT Working Paper Series. URL: http://citeseerx.ist.psu.edu/viewdoc/download?doi=
10.1.1.907.979&rep=rep1&type=pdf. [date accessed: 2021-07-01].
Thomas, D., J. Strauss, and M.-H. Henriques (1991). How does mother’s education affect child height?
Journal of Human Resources 26(2), 183–211.
Vollset, S. E., E. Goren, C.-W. Yuan, J. Cao, A. E. Smith, T. Hsiao, C. Bisignano, G. S. Azhar, E. Cas-
tro, J. Chalek, et al. (2020). Fertility, mortality, migration, and population scenarios for 195 countries
20and territories from 2017 to 2100: A forecasting analysis for the global burden of disease study. The
Lancet 396(10258), 1285–1306.
21Figure 1: Worldwide total fertility rate and gross tertiary enrollment rate
40
5
4.5
Gross Tertiary Enrolment Rate
30
Total Fertility Rate
3.5 4
20
3 2.5
10
1970 1980 1990 2000 2010 2020
Year
Total Fertility Rate Gross Tertiary Enrolment Rate
Source: World Development Indicators, 2019.
22Figure 2: Trends in higher education in Taiwan.
(a) BGIs and Junior Colleges
(b) BGI Enrollment Share by Age and Sex
(c) Graduates by Degrees
Sources: Higher education data from the Ministry of Education, Taiwan. Population data from the
Department of Household Registration, Ministry of Interior, Taiwan.
Notes: Enrollment in Figure 2b includes both undergraduate and postgraduate students. The share is
defined as the share of population in each age group enrolled in universities.Figure 3: BGI distribution in 1995 versus 2010
Sources: Authors’ own mapping based on BGI data from the Ministry of Education.
Notes: The green circles indicate 66 BGIs that already existed in 1995 before the expansion. The red
squares indicate 136 upgraded BGIs, and the blue triangles indicate 21 newly set-up BGIs. Institutions
in two small islands, Penghu and Quemoy, are excluded.
Figure 4: Fertility trend in Taiwan.
Source: Department of Household Registration, Ministry of Interior, Taiwan.
24Figure 5: Pre-trends in fertility outcomes
0.10
Residuals 0.00
-0.10
-0.20
1984
1985
1986
1987
1988
1990
1993
1996
2000
2003
2006
2010
wave
Lower half counties
Upper half counties
(a) Any Children by Age 30
(b) Having Any Child by Age 35
Sources: Woman’s Marriage, Fertility and Employment Survey 1979-1988, 1990, 1993, 2000, 2003,
2006, and 2010, Directorate-General of Budget, Accounting and Statistics, Executive Yuan, Taiwan.
Notes: The outcome is a dummy variable indicating whether a woman had any child at ages 30 (Sub-
figure 5a) and 35 (Sub-figure 5a). The sample consists of women aged 30-50 from surveys in 1979-
1988, 1990, 1993, 1996, 2000, 2003, 2006, and 2010. The pooled sample is used to regress the outcome
variables on a full set of county dummies and then predict the residuals from the regressions that filter
out the county fixed effect. The next step calculates the average of the residuals for individual women in
each survey year from high- and low-increase counties defined by changes in BGIs above or below the
median change during 1996-2010.
25Table 1: The Effect of Tertiary Education on Fertility
Age at
Study Country Method Sample Treatment treatment Surveyed in Outcomes Conclusions Mechanism
IV effects:
#parity
by 10-12%
White mothers # of 2- and 4-year Reduced-form:
with first birth colleges in the county parity # parity
Currie and Moretti (2003) US 2SLS b/w ages 24-45 when women was 17 17 1970-1999 by age 45 by 8-9% NA
Exposed: IV:
born 1981-1982 # parity by 0.21(8%),
(aged 18-19 in 2000) #desired # by 0.43 (9%)
Unexposed: Abrupt " Reduced-form: " assortative mating,
born 1979-1980 in supply parity, # parity by 0.26 (8%), postponed marriage
Tequame and Tirivayi (2015) Ethiopia RDD (aged 20-21 in 2000) in 2000 19 2005, 2011 preferred # of children # desired # by 0.55 (9%) and motherhood
Exposed:
born 1976-1982
South Unexposed: Expansion ever married, # first marriage " returns
Choi (2018) Korea DID born 1965-1971 in the 1990’s 19 2012 child by ages 30-36 # child by 45% from education
IV:
" prob. of births
after ages 24, 27, and 30
by5.3%, 9.4%, and 13.3%,
26
respectively
Exposed: Reduced-form:
born 1972-1979 age at " prob. of a birth Human capital
(below 18) Expansion in first pregnancy, after ages 24 effects,
England Unexposed: the late 1980’s teenage motherhood, by 2.4 p.p " labor market
James and Vujić (2019) & Wales 2SLS born 1962-1971 to early 1990’s 18 1975-2013 delayed motherhood for those born in 1975 opportunities
IV:
0.3 # children
per woman
with college degree,
25% # prob.
of children,
College-educated
All cohorts had 0.268 " children
born 1956-1986 than peers career-oriented &
excluding Expansion any child, without family-friendly
Kamhöfer and Westphal (2019) Germany 2SLS teenage pregnancies during 1958-1990 19 2007-2015 # children by age 40 college education occupations .
IV: # prob.
Exposed: of any births
born in by 20 p.p.
(April 1982+30 mnths) "supply of Reduced form: " labor market
Unexposed: higher education, # prob. opportunities
2SLS, born in schooling reform of any births " opportunity cost
Kountouris (2020) Greece RDD (April 1982-30 mnths) in 2000 17 2011 any children by 2.7 p.p. of children
Notes: OLS = Ordinary Least Squares; 2SLS = Two-Stage Least Squared; RDD = Regression Discontinuity Design; DID = Difference-in-Differences. NE = No effectYou can also read