Disinformation, 'Fake News' - and Influence Campaigns on Twitter - Amazon AWS
←
→
Page content transcription
If your browser does not render page correctly, please read the page content below
Disinformation,
            ‘Fake News’
  and Influence Campaigns
               on Twitter

              OCTOBER 2018

              Matthew Hindman                Vlad Barash
              George Washington University   Graphika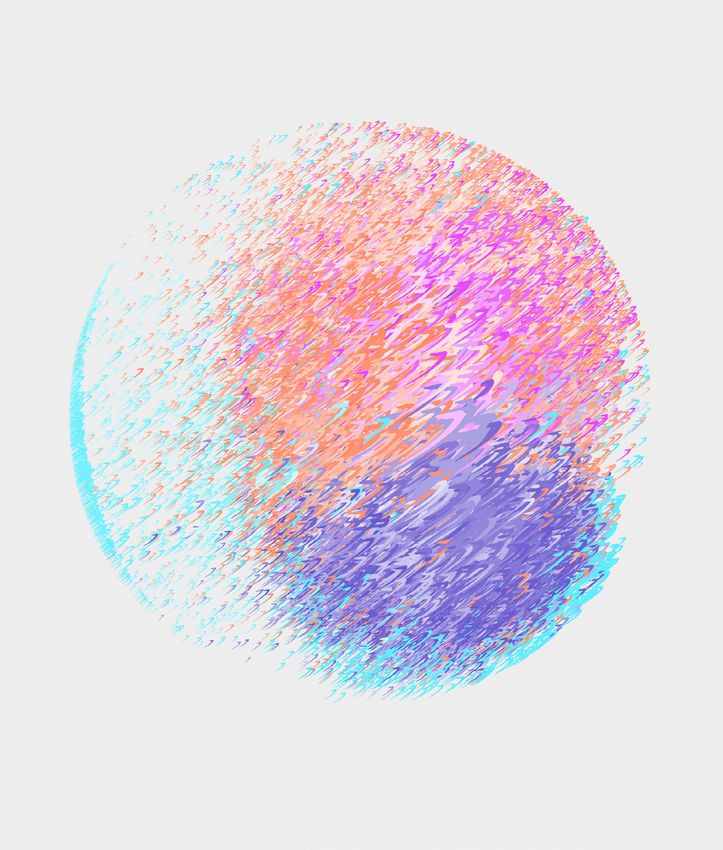
Contents

       Executive Summary  .  .  .  .  .  .  .  .  .  .  .  .  .  .  .  .  .  .  .  .  .  .  .  .  .  .  .  .  .  .  .  .  .  .  .  .  .  .  .  .  .  .  .                                   3

       Introduction .  .  .  .  .  .  .  .  .  .  .  .  .  .  .  .  .  .  .  .  .  .  .  .  .  .  .  .  .  .  .  .  .  .  .  .  .  .  .  .  .  .  .  .  .  .  .  .  .  .  .  .              7

       A Problem Both Old and New . . . . . . . . . . . . . . . . . . . . . . . . . . . . . . . . . . 9

       Defining Fake News Outlets .  .  .  .  .  .  .  .  .  .  .  .  .  .  .  .  .  .  .  .  .  .  .  .  .  .  .  .  .  .  .  .  .  .  .  . 13

       Bots, Trolls and ‘Cyborgs’ on Twitter .  .  .  .  .  .  .  .  .  .  .  .  .  .  .  .  .  .  .  .  .  .  .  .  .  .  . 16

       Map Methodology .  .  .  .  .  .  .  .  .  .  .  .  .  .  .  .  .  .  .  .  .  .  .  .  .  .  .  .  .  .  .  .  .  .  .  .  .  .  .  .  .  .  .  .  .  . 19

       Election Data and Maps  .  .  .  .  .  .  .  .  .  .  .  .  .  .  .  .  .  .  .  .  .  .  .  .  .  .  .  .  .  .  .  .  .  .  .  .  .  .  . 22
         Election Core Map
         Election Periphery Map
         Postelection Map

       Fake Accounts From Russia’s Most Prominent Troll Farm .  .  .  . 33

       Disinformation Campaigns on Twitter: Chronotopes .  .  .  .  .  .  .  .  . 34
         #NoDAPL
         #WikiLeaks
         #SpiritCooking
         #SyriaHoax
         #SethRich

       Conclusion  .  .  .  .  .  .  .  .  .  .  .  .  .  .  .  .  .  .  .  .  .  .  .  .  .  .  .  .  .  .  .  .  .  .  .  .  .  .  .  .  .  .  .  .  .  .  .  .  .  .  .  .  . 43

       Bibliography  .  .  .  .  .  .  .  .  .  .  .  .  .  .  .  .  .  .  .  .  .  .  .  .  .  .  .  .  .  .  .  .  .  .  .  .  .  .  .  .  .  .  .  .  .  .  .  .  .  .  .  . 45
       Notes  .  .  .  .  .  .  .  .  .  .  .  .  .  .  .  .  .  .  .  .  .  .  .  .  .  .  .  .  .  .  .  .  .  .  .  .  .  .  .  .  .  .  .  .  .  .  .  .  .  .  .  .  .  .  .  .  .  .  . 55

                                                                                                                                                                                                   2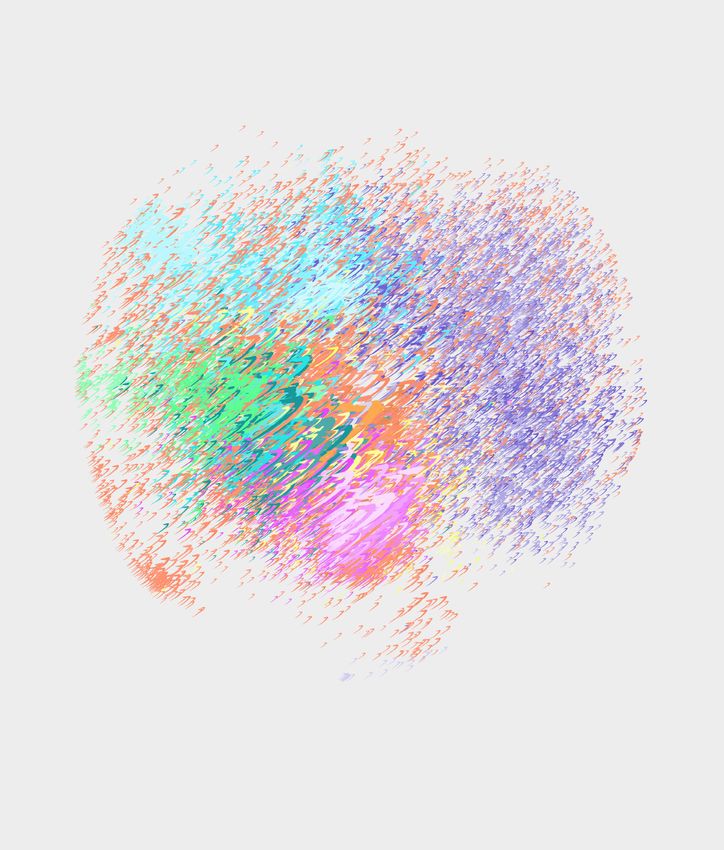
EXECUTIVE
SUMMARY

                    This study is one of the largest analyses to date on how
                    fake news spread on Twitter both during and after the
                    2016 election campaign.
                    Using tools and mapping methods from Graphika, a social media intelligence firm,
                    we study more than 10 million tweets from 700,000 Twitter accounts that linked to
                    more than 600 fake and conspiracy news outlets. Crucially, we study fake and con-
                    spiracy news both before and after the election, allowing us to measure how the fake
                    news ecosystem has evolved since November 2016.

                    Much fake news and disinformation is still being
                    spread on Twitter.
                    Consistent with other research, we find more than 6.6 million tweets linking to
                    fake and conspiracy news publishers in the month before the 2016 election. Yet
                    disinformation continues to be a substantial problem postelection, with 4.0 million
                    tweets linking to fake and conspiracy news publishers found in a 30-day period
                    from mid-March to mid-April 2017. Contrary to claims that fake news is a game
                    of “whack-a-mole,” more than 80 percent of the disinformation accounts in our
                    election maps are still active as this report goes to press. These accounts continue
                    to publish more than a million tweets in a typical day.

                    Just a few fake and conspiracy outlets dominated
                    during the election—and nearly all of them continue
                    to dominate today.
                    Sixty-five percent of fake and conspiracy news links during the election period went
                    to just the 10 largest sites, a statistic unchanged six months later. The top 50 fake
                    news sites received 89 percent of links during the election and (coincidentally)
                    89 percent in the 30-day period five months later. Critically—and contrary to some
                    previous reports—these top fake and conspiracy news outlets on Twitter are largely
                    stable. Nine of the top 10 fake news sites during the month before the election were
                    still in or near the top 10 six months later.

DISINFORMATION, ‘FAKE NEWS’ AND INFLUENCE CAMPAIGNS ON TWITTER                                              3
EXECUTIVE SUMMARY

                    Our methods find much more fake and conspiracy news
                    activity on Twitter than several recent high-profile
                    studies—though fake news still receives significantly
                    fewer links than mainstream media sources.
                    Our study finds much more fake news activity than several recent studies,
                    largely because it examines a larger corpus of fake and conspiracy news sites.
                    Fake and conspiracy news sites received about 13 percent as many Twitter links
                    as a comparison set of national news outlets did, and 37 percent as many as a
                    set of regional newspapers.

                    Most accounts spreading fake or conspiracy
                    news in our maps are estimated to be bots or
                    semi-automated accounts.
                    Machine learning models estimate that 33 percent of the 100 most-followed accounts
                    in our postelection map—and 63 percent of a random sample of all accounts—
                    are “bots,” or automated accounts. Because roughly 15 percent of accounts in the
                    postelection map have since been suspended, the true proportion of automated
                    accounts may have exceeded 70 percent.

                    Our maps show that accounts that spread fake news
                    are extremely densely connected.
                    In both the election-eve and postelection maps, our methods identify an ultra-dense
                    core of heavily followed accounts that repeatedly link to fake or conspiracy news sites.
                    Sites in the core are typically not the highest-volume tweeters of fake news. However,
                    the popularity of these accounts, and heavy co-followership among top accounts,
                    means that fake news stories that reach the core (or start there) are likely to spread
                    widely. The pre-election fake news network is one of the densest Graphika has ever
                    analyzed, necessitating unusual map drawing procedures.

                    Fake news during the election did not just adopt
                    conservative or Republican-leaning frames—though
                    it has become more ostensibly Republican since.
                    While a large majority of fake news came from supposedly pro-Republican and
                    pro-Donald Trump accounts in the month before the election, smaller but still
                    substantial amounts of fake news were passed on by liberal or Democratic-identified
                    accounts. After the election period, though, left-leaning fake news decreased much
                    more than right-leaning fake news.

DISINFORMATION, ‘FAKE NEWS’ AND INFLUENCE CAMPAIGNS ON TWITTER                                                 4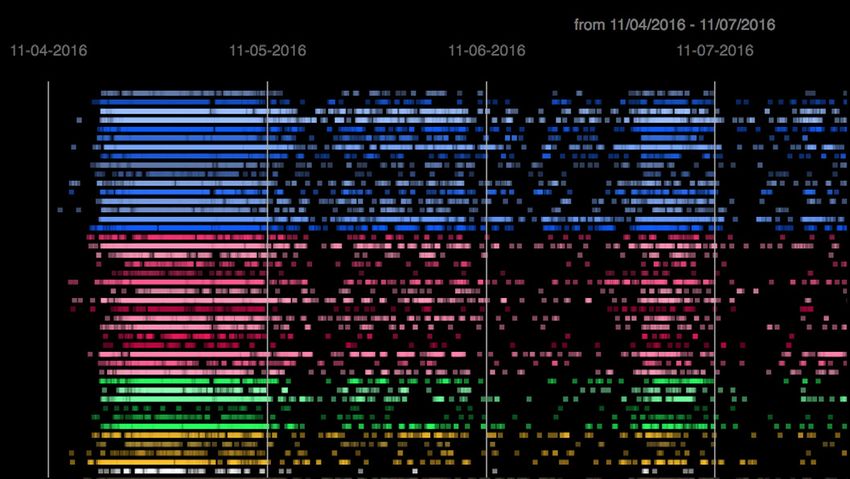
EXECUTIVE SUMMARY

                    There are structural changes in the role of
                    Russian-aligned clusters of accounts postelection.
                    In the pre-election map, clusters of accounts affiliated with Russia serve a broker-
                    age role, serving as a cultural and political bridge between liberal U.S. accounts and
                    European far-right accounts. Postelection, however, accounts in the Russia cluster
                    have become more peripheral, while the International Conspiracy | Activist cluster
                    (which similarly spreads pro-Russia content) is spread broadly through the map.
                    This structure suggests that international conspiracy-focused accounts have become
                    more important as brokers of fake news postelection.

                    Most of the accounts that linked repeatedly to fake and
                    conspiracy news during the election are still active.
                    Twitter has claimed repeatedly that it has cracked down on automated accounts that
                    spread fake news and engage in “spammy behavior.” Yet of the 100 accounts that
                    were most active in spreading fake news in the months before the election—the
                    large majority clearly engaged in “spammy behavior” that violates Twitter’s rules—
                    more than 90 were still active as of spring 2018. Overall, 89 percent of accounts in
                    our fake and conspiracy news map remained active as of mid-April 2018. The per-
                    sistence of so many easily identified abusive accounts is difficult to square with any
                    effective crackdown.

                    A few dozen accounts controlled by Russia’s Internet
                    Research Agency appear in our maps—but hundreds of
                    other accounts were likely more important in spreading
                    fake news.
                    Of the more than 2,700 IRA accounts named publicly as of this writing, 65 are
                    included in at least one of our maps. The IRA accounts in our maps include several
                    accounts that were widely quoted in U.S. media, such as @WarfareWW, @TEN_GOP
                    and @Jenn_Abrams. Most of the publicly known IRA accounts are filtered from our
                    map because of relatively few followers and little measurable influence. Plenty of
                    other accounts, though, do tweet in lockstep with the Kremlin’s message, including
                    hundreds of accounts with more followers than top IRA trolls.

DISINFORMATION, ‘FAKE NEWS’ AND INFLUENCE CAMPAIGNS ON TWITTER                                               5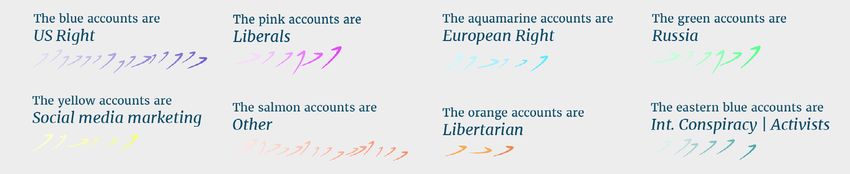
EXECUTIVE SUMMARY

                    There is evidence of coordinated campaigns to push fake
                    news stories and other types of disinformation.
                    Most news stories on Twitter follow a statistically regular pattern: The rate of new
                    links ramps up quickly (but not instantly), peaks in an hour or two, and then decays
                    in an exponential, statistically regular fashion. But many fake news stories do not
                    follow this nearly universal pattern. Organized blocks of accounts appear to coordi-
                    nate to extend the life cycle of selected news stories and hashtags. Segments of our
                    maps associated with Russian propaganda are key participants in these campaigns,
                    and many of these efforts align strongly with Russian goals and interests.

                    Coordinated campaigns seem to opportunistically
                    amplify content they did not create.
                    Public discussion has often vacillated between portraying fake news as an organic,
                    small-scale phenomenon driven by ad dollars, and characterizing it as the product of
                    massive coordinated efforts by state actors. Our data tell a more complicated story,
                    in which some narratives are carefully crafted, but others are amplified because they
                    fit with the agenda of those running these campaigns. This is the information war-
                    fare equivalent of giving air cover to a rebel group, using outside technology and
                    resources to augment otherwise-weak organic efforts.

                    One case study suggests that concerted action
                    against noncredible outlets can drastically reduce
                    their audience.
                    The Real Strategy was referenced by more than 700,000 tweets in our election
                    sample, the second-most linked fake or conspiracy news outlet overall. After being
                    tied to a large-scale harassment campaign and the “Pizzagate” falsehood, though,
                    The Real Strategy’s Twitter account was deleted, it was blacklisted on online forums
                    such as Reddit, and a network of supportive bot accounts was partially disrupted.
                    The postelection sample showed only 1,534 tweets to The Real Strategy, a drop of
                    99.8 percent. This example suggests that aggressive action against fake news outlets
                    can be effective at containing the spread of fake news.

DISINFORMATION, ‘FAKE NEWS’ AND INFLUENCE CAMPAIGNS ON TWITTER                                              6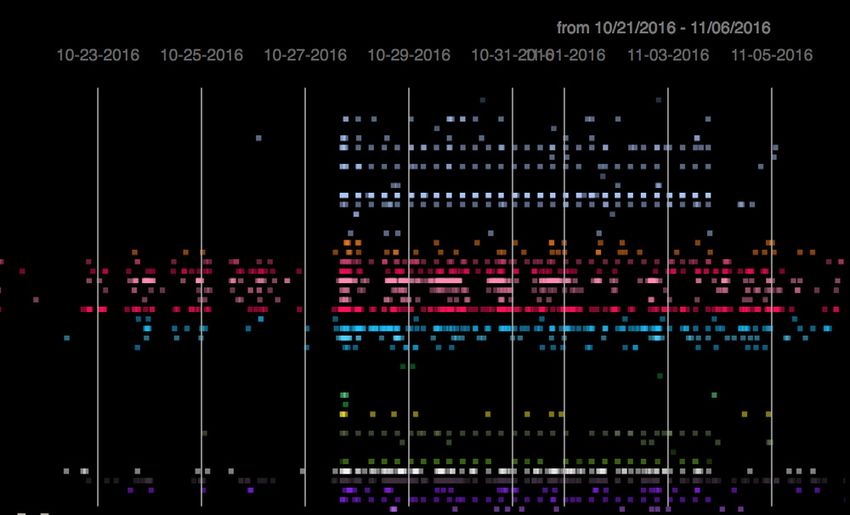
INTRODUCTION
                                 One of the most remarkable outcomes of the 2016 presidential
                                 election cycle in the United States was the rise of so-called fake
                                 news. Before 2016, the term fake news referred mostly to satir-
                                 ical media such as “The Daily Show” or The Onion.1 During the
                                 2016 campaign, though, the label was repurposed to describe a
                                 rapidly growing category of digital content: fabricated articles
                                 spreading falsehoods that nonetheless appeared to be credible
                                 news stories. Hundreds of websites that publish such content
                                 have sprung up in recent years, and false stories have spread
                                 quickly and widely through social media. False news stories
                                 claiming that Hillary Clinton ordered the murder of an FBI agent,
                                 or participated in a satanic child abuse ring in a Washington
                                 pizza parlor, were shared hundreds of thousands of times on
                                 social media on the eve of the 2016 election.2
                                 Fake news is now an important part of the political ecosystem—though
                                 the term itself has become hotly contested. Understanding the fake
                                 news phenomenon both during and after the election is a critically
                                 important task for journalists, policymakers, national security profes-
                                 sionals, and citizens of all political stripes. Despite the importance of
                                 this question, though, public debates and journalistic accounts have
                                 often been clouded by conflicting claims and narratives.

                                 Early journalistic accounts of fake news emphasized the role of ama-
                                 teurs and small-scale entrepreneurs motivated by ad dollars. In an
                                 indelible early story about fake news, BuzzFeed reporters Craig Silver-
                                 man and Lawrence Alexander tracked down groups of teenagers in the
                                 Macedonian town of Veles who had created dozens of ad-supported
                                 fake news sites to earn spending money.3 Numerous similar reports
                                 followed, tracing specific fake news stories to an entrepreneur in the
                                 California suburbs,4 a college-age intern for a Maryland state legislator,5
                                 computer science students in the country of Georgia,6 and other ragtag
                                 groups of digital creators motivated by politics or cash. Recent reports
                                 have suggested that at least one of the Macedonian sites was actually
                                 run by the Israeli private intelligence firm Psy-Group as part of a con-
                                 certed pro-Trump effort.7 Yet much public discussion still assumes that
                                 most fake news is small-scale and money-oriented.

DISINFORMATION, ‘FAKE NEWS’ AND INFLUENCE CAMPAIGNS ON TWITTER                                                 7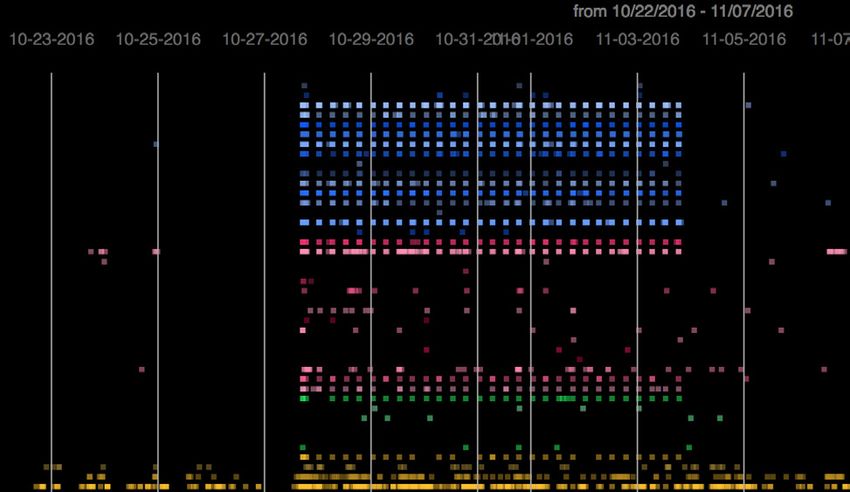
INTRODUCTION

                                 Focusing on a few fake and conspiracy news outlets and a few widely
                                 shared stories, though, runs the risk of distorting our understanding of
                                 fake news overall. More systematic studies of fake news have painted a
                                 very different picture from most early news reports. Rather than a pro-
                                 fusion of small, independent news sites, large-scale empirical studies
                                 have found that the fake news “ecosystem” is highly concentrated.
                                 In a research paper produced by a Harvard and Northeastern university
                                 conference, David Lazer and collaborators conclude that most fake news
                                 on social media could be traced to a “relatively small, but constantly
                                 changing, number of sources.”8 Other large-scale reports looking at
                                 fake news as one element in the broader digital media environment
                                 have similarly found strong concentration.9

                                 Even more ominously, we now know that the Russian government
                                 engaged in a large-scale, multipronged effort to influence the 2016
                                 U.S. election. Many important details of this effort are still unknown
                                 to the public as of this writing. We do know, though, that these efforts
                                 included crafting and promoting fake news stories with tens of thou-
                                 sands of social media accounts,10 more than 1,000 trained professional
                                 “trolls,”11 and hundreds of thousands of dollars of digital ads seen by
                                 millions of Americans.12 Social media accounts that spread fake news
                                 also promoted real-world meetups and demonstrations in U.S. cities—
                                 sometimes on both sides of hot-button issues.13 Understanding the
                                 details of these state-sponsored tactics, and their likely effectiveness, is
                                 key to mitigating the influence of anti-democratic efforts in the future.

       THIS REPORT SHEDS LIGHT ON A NUMBER OF KEY QUESTIONS ABOUT FAKE NEWS:
                                 First, it attempts to benchmark the scale of the phenomenon at the
                                 national level. How much fake news content can be found on Twitter?
                                 From how many outlets? How does the volume of fake news content
                                 compare with that of more credible news sources?

                                 Second, this report seeks to understand how the phenomenon has
                                 evolved since the 2016 election. Elections are unusually high-profile
                                 times for political activity, and previous work has suggested that the
                                 list of prominent fake news sites changes frequently.14 How much has
                                 the fake news landscape changed since the end of the 2016 election?
                                 Has the volume of fake news dropped? Do we see the emergence of
                                 important new players?

                                 Third, we look at the role of coordinated propaganda and automated
                                 accounts in the spread of fake news. How big a part have automated
                                 accounts played in pushing fake news—and how has this changed
                                 since the election? Can we find evidence of coordinated campaigns
                                 (automated or not) pushing particular stories or agendas in ways
                                 unlikely to be organic?

DISINFORMATION, ‘FAKE NEWS’ AND INFLUENCE CAMPAIGNS ON TWITTER                                                  8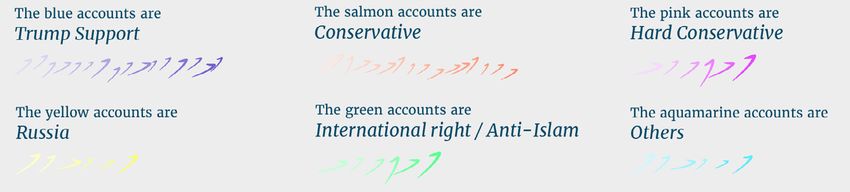
A PROBLEM
BOTH OLD AND NEW

                                  To set the stage for the study, it is worth reviewing several
                                  areas of research that provide context for the study of disinfor-
                                  mation in general and fake news in particular. One key piece of
                                  context is historical. Media and scholarly accounts have often
                                  emphasized the ways in which the fake news phenomenon is
                                  unprecedented. Yet the 2016 election is hardly the first time that
                                  false news stories, motivated by money or national ideology,
                                  have been aimed at the American public.
                                  False news stories spread by The Associated Press helped lead to the
                                  inauguration of Rutherford B. Hayes as president and the end of post-
                                  Civil War Reconstruction. Most Americans are familiar with “yellow
                                  journalism,” sensational coverage that sold newspapers at the expense
                                  of factual accuracy at the turn of the 20th century. Yellow journalism
                                  strongly contributed to the start of the Spanish-American War and
                                  (arguably) the U.S. entry into World War I.15

                                  Perhaps the most remarkable incident of fake news in American
                                  history—and far less known—was the massive, covert British
                                  propaganda effort to draw the U.S. into World War II. Run out of an
                                  office in Rockefeller Center in New York City, so-called British Security
                                  Coordination (BSC) involved as many as 3,000 British agents who
                                  manipulated U.S. news coverage on a massive scale.16 The effort paid
                                  friendly columnists and laundered (sometimes fake) British news
                                  stories through apparently unconnected outlets. The BSC campaign even
                                  developed the “game of Vik,” a large-scale campaign to anonymously
                                  harass Nazi sympathizers in the United States through tactics such
                                  as popping tires and putting rats in water tanks. Today we would call
                                  these types of acts trolling.

                                  During the Cold War, of course, the Soviet Union often targeted Ameri-
                                  can audiences with false news stories. Declassified Russian documents
                                  show that by the early 1980s, the Soviets were spending more than
                                  $3 billion on external propaganda and influence campaigns, more than
                                  the U.S. was then spending on the National Security Agency.17 Soviet

 DISINFORMATION, ‘FAKE NEWS’ AND INFLUENCE CAMPAIGNS ON TWITTER                                               9
A PROBLEM BOTH OLD AND NEW
efforts routinely involved publishing fake news, including recruiting
journalists as agents and publishing fabricated documents (often in
troves of “leaked” genuine material).
Fake news, then, is not unprecedented. Yet as the media environment
and the political landscape have shifted, possibilities for fake news
have mutated and metastasized. Aggregators and “content farms” have
sprung up to produce low-quality, sensational, often misleading news
stories framed to maximize clicks. New audience metrics and tools
such as A/B testing may have encouraged a shift to sensational content.
Changes in the media landscape coincided with broader polarization
in the American public, with partisans showing increasing disdain for
members of the other party.18
Social media is now the most important conduit of digital news,
especially for many low-information voters.19 A substantial and con-
troversial literature has worried about online “echo chambers” or
“filter bubbles,” in which individuals receive few political messages
that contradict their prejudices, because of news self-selection, social
homophily, or algorithms on big platforms such as Facebook.20 While
several lines of empirical studies have complicated or directly chal-
lenged claims about strong filter bubbles, some research suggests that
one-sided information flows produce bigger shifts in public opinion
than balanced information flows.21 These lines of research have poten-
tially important implications for our understanding of the impact of
fake news on political attitudes and behavior.
Partly in response to the digitization of the information landscape, there
has been a wave of scholarship on how to correct misinformation. Much
of this literature, unfortunately, has argued that false beliefs are often
resistant to correction. Repeating false stories, even to debunk them
immediately, might reinforce misperceptions (though scholarship on
this point is conflicted).22 Even when members of the public do accept
corrections, the initial false story can continue to affect attitudes.23
Research on misinformation has also emphasized the power of “social
proof” in persuading the public to accept false information. People may
be more apt to accept news stories as true when they come from friends
and acquaintances and supposedly credible sources, and when these
stories are more popular overall.24 Recent work has also found that rep-
etition alone can make false news stories more believable.25 People are
more accepting of the story the third or fourth time they are exposed to
it, with familiarity increasing credibility.
DISINFORMATION, ‘FAKE NEWS’ AND INFLUENCE CAMPAIGNS ON TWITTER 10A PROBLEM BOTH OLD AND NEW
NATION-STATES, INFORMATION WARFARE AND ‘CYBER TROOPS’
The arrival of social media has inaugurated a new era of news
manipulation for profit and political advantage, and many nations
routinely try to influence news and discussion on social media
platforms. Many observers have especially noted the evolution of
Russian information warfare doctrine, along with its “deep roots in
long-standing Soviet practice.”26
Many articles discuss this—somewhat inaccurately27—as a so-called
Gerasimov Doctrine, with reference to the writings of Russian General
of the Armies Valery Gerasimov. Though it is not systematic enough to
count as a bona fide doctrine, it is true that Russian military thinking
emphasizes hybrid warfare as a new persistent reality, with the
“information sphere” and information warfare a critical battlespace.28
There is evidence that the Russian government’s redoubled efforts
have been strategically important: For example, areas of Ukraine that
receive Kremlin-supported broadcasts have shown sharp pro-Russian
shifts in attitude.29
Russia promotes false and
contradictory stories from outlets
across the political spectrum, with
the aim of creating confusion and
widening political and social divides.
Even before the 2016 election, observers in Europe and the United States
alleged that Russian efforts produced a “firehose of falsehood,” defined
by “high numbers of channels and messages and a shameless willing-
ness to disseminate partial truths or outright fictions.”30 According to
these accounts, Russia promotes false and contradictory stories from
outlets across the political spectrum, with the aim of creating confusion
and widening political and social divides. Consistent with these claims,
many of the political ads bought by the Russian-government-linked
Internet Research Agency focused on amplifying U.S. social tensions
on topics such as race, guns and homosexuality.31 Indeed, research
by Stewart, Arif and Starbird found that IRA accounts were active on
both sides of pre-election debates about race and guns, in an apparent
attempt to inflame opinion.32 Another large-scale analysis of IRA tweets
found several different types of accounts playing consistent roles,
including trolls on both the political left and right, and IRA accounts
pretending to be local news outlets.33
DISINFORMATION, ‘FAKE NEWS’ AND INFLUENCE CAMPAIGNS ON TWITTER 11A PROBLEM BOTH OLD AND NEW
While much attention has focused on the role of Russia, many other
nations and organizations now attempt to shape digital news and social
media in favorable directions. Recent work by Bradshaw and How-
ard at the Oxford Internet Institute has noted the emergence of “cyber
troops”—organized teams trying to shape public opinion on social
media—in more than two dozen countries.34 Recent media reports have
also raised questions about pro-Trump campaigns run by other foreign
groups, including the Israeli private intelligence firm Psy-Group.35 Ira-
nian fake accounts and sites, along with new Russian sites, have been
removed in the runup to the 2018 election.36
While much attention has focused
on the role of Russia, many other
nations and organizations now
attempt to shape digital news and
social media in favorable directions.
If such tactics are being used on Twitter, by state actors or others, they
should be visible in our study. First, we should see stories on favored
topics being shared unusually widely, even across ideological groups
and geographic units that rarely share news. Second, the chronological
pattern of sharing should show evidence of coordination. Most news
stories spike quickly and then decay rapidly in a roughly exponential
fashion. Strong deviation from that pattern is prima facie evidence of
coordinated behavior.37
DISINFORMATION, ‘FAKE NEWS’ AND INFLUENCE CAMPAIGNS ON TWITTER 12DEFINING FAKE
NEWS OUTLETS
Discussing fake news, of course, requires a clear definition of
the kind of content we are studying. Following previous scholar-
ship,38 we define fake news as content that has the appearance
of credible news stories, but without going through the process
of verification that makes real news valuable. Fake news is
fraudulent not just because it is factually false (though of course
it usually is), but because it skips the procedures that make real
news trustworthy.
Nearly all fake news content also counts as disinformation—a broader
category that includes content (news content or otherwise) created or spread
with intent to deceive. For the outlets that create it, and the automated
accounts that often coordinate to spread it, the intent to deceive is
clear. But from the perspective of citizens, fake news may also count as
misinformation: false content spread by those who may mistakenly believe it
to be true.
Many political partisans, up to and including heads of state, now rou-
tinely use the “fake news” label to disparage articles they disagree
with. Some scholars and journalists have recently argued that the term
has been so abused that it should be retired.39 Yet this report contin-
ues to use it for several reasons. Disinformation takes far more forms
than just fake news—and this important genre of disinformation has
no other widely accepted label. Moreover, as other scholars have noted,
relabeling fake news is likely to just provoke similar abuse of whatever
new term is chosen.40
This report goes beyond individual fake news stories to focus on fake
news outlets—sites that regularly publish content that appears to have been
rigorously verified, but in fact was not. In the most clear-cut cases, fake
news outlets are designed to look like (nonexistent) traditional media
outlets, but any sites that regularly publish content without a genuine
verification process count as fake news under our definition.
DISINFORMATION, ‘FAKE NEWS’ AND INFLUENCE CAMPAIGNS ON TWITTER 13DEFINING FAKE NEWS OUTLETS
In the context of state-sponsored disinformation campaigns, con-
spiracy-focused outlets have long been both more common and more
effective than sites that publish only false content (see previous discus-
sion). Conspiracy sites count as fake news outlets under our definition
and that of most (though not all) other scholars. For clarity, though,
this report often uses the term fake and conspiracy news to better align
with common usage. Some recent scholarly discussions of fake news
have excluded outlets such as Sputnik News, Infowars and Zero Hedge
from their analysis, to focus on sites that overwhelmingly publish false
articles. Our strong view is that such ultra-narrow definitions of fake
news outlets are a mistake, overlooking the most important vectors
for damaging disinformation. This is doubly true with respect to ques-
tions about state-sponsored disinformation, which for decades has been
laundered through conspiracy outlets of various kinds.
At the same time, our focus on fake and conspiracy news is narrower
than that used in some other recent scholarship.41 Outlets that are just
politically biased or ideologically extreme do not qualify as fake news
by our measure, even if those sites incline toward sensationalism. We
are concerned with factual accuracy, not with issues of framing or tone.
And while hypothetical hard cases are easy to construct, they are largely
absent from the real data (more on this below). The core findings of this
report are thus likely to hold no matter which scholarly definition of
fake news one prefers.42
In the 2016 election period, our
sampled data include 381,369
unique news story URLs on
fake and conspiracy news sites.
There are several reasons, contrary to many previous studies of fake
news, that we focus on the outlet rather than individual articles. One
issue is the sheer scope of the fake news phenomenon. In the 2016
election period, our sampled data include 381,369 unique news story
URLs on fake and conspiracy news sites. This report, or any similar
report, cannot evaluate the truthfulness of every single story in such a
massive corpus.
DISINFORMATION, ‘FAKE NEWS’ AND INFLUENCE CAMPAIGNS ON TWITTER 14DEFINING FAKE NEWS OUTLETS
In addition to practical limitations, there are other compelling reasons to
look at outlets rather than individual stories.43 On its own, a single story
is a poor guide to the overall credibility of an outlet. Diligent news-
rooms occasionally have to correct articles after getting facts wrong,
of course. But even propaganda outlets explicitly designed to deceive
often publish more true stories than fabrications. For example, Russian
doctrine on disinformation has long emphasized that disinformation
should be accompanied by reams of truthful information to make the
deception more convincing.44 We see plenty of outlets in our data that
follow this model, filling out their newsfeeds with both a steady stream
of fake stories and even more straight news articles (though usually
with a sensational headline). Fake Twitter accounts reportedly linked to
Russian government efforts, such as the @TEN_GOP account discussed
above, have pursued a similar strategy: lots of unremarkable pro-Trump
and pro-GOP content with a regular drip of fake news and curiously
pro-Kremlin stories. Internet Research Agency accounts that cast them-
selves (falsely) as local news sites followed the same pattern, with only a
small fraction of their content patently false.45
Even propaganda outlets
explicitly designed to deceive
often publish more true
stories than fabrications.
Focusing on fake news at the outlet level is especially important, too,
for understanding a key question of interest: how fake news sites grow
and maintain audience over time. Factually true stories can build trust
in otherwise questionable brands and make subsequent mis- or dis-
information more likely to be accepted. Just like fake stories, factually
true stories on noncredible outlets are an important part of understand-
ing the character of the fake news problem.
DISINFORMATION, ‘FAKE NEWS’ AND INFLUENCE CAMPAIGNS ON TWITTER 15BOTS, TROLLS AND
‘CYBORGS’ ON TWITTER
So-called bots—automated accounts—are believed to play a key
role in the spread of fake news and disinformation. These worries
have been especially prominent in investigations into Russian
attempts to influence the 2016 election. Bots are distinct from
professional trolls, which are human-run accounts that usually
seek to provoke or to spread disinformation. “Cyborg” accounts
combine human-generated content with automated posting.46
An explosion of academic research has documented large networks of
false accounts that seek to spread disinformation on social media.47
Social media companies, too, have confirmed that fake accounts and
networks of bots played a central role in promoting fake news. Face-
book implicitly confirmed the main conclusions of the U.S. intelligence
community about both automated accounts and coordinated fake news
campaigns by state actors in a public April 2017 report, but cut infor-
mation on Russia’s role from the report after an internal debate.48 In
October 2017, Facebook disclosed that content from accounts linked to
Russia had reached more than 126 million users.49
In October 2017, Facebook disclosed
that content from accounts linked
to Russia had reached more than
126 million users.
Twitter reported that it had identified 36,746 accounts—a figure later
upped to more than 50,000—that “generated automated, election-
related content and had at least one of the characteristics we used to
associate an account with Russia.”50 In addition to automated accounts,
Twitter ultimately identified 3,817 accounts linked to the Internet
Research Agency, the so-called troll farm with links to the Kremlin.
Twitter was criticized, however, for focusing its efforts to find auto-
mated accounts just on the profiles Facebook had already identified,
rather than on its own platform-specific signals.51
DISINFORMATION, ‘FAKE NEWS’ AND INFLUENCE CAMPAIGNS ON TWITTER 16BOTS, TROLLS AND ‘CYBORGS’ ON TWITTER
Automated accounts are explicitly allowed according to Twitter’s terms
of use, and the platform’s open API makes creating them relatively
simple. Many Twitter bots or automated accounts are clearly labeled
as such, and many serve useful functions. Some sophisticated bots,
though, can convincingly mirror human behavior, especially when com-
bined with occasional human intervention.
Still, given the potential importance of automated accounts in the
spread of fake news, it is important to note patterns that suggest
automated behavior. None of these signs “prove” that a given account
is really a bot. But there are many different predictors that, in combi-
nation, provide strong evidence that an account is automated. Common
signs include—but are not limited to—the following:
• Very high posting rate, round-the-clock posts with no time for
sleep, or posts at highly regular intervals.
• Accounts that overwhelmingly just retweet or “like” content, or
which have very high retweet-to-original-tweet ratios. This is
especially suspicious if only a few sources or accounts are retweeted.
• Multiple tweets of the same link, something human accounts
rarely do.
• Accounts with little or no verifiable biographical information.
• Accounts using fake profile pictures.52
• Accounts with many thousands of tweets yet few followers.
Human users rarely continue to use Twitter heavily if they are
mostly ignored.
• High but nearly equal following/follower ratios. This often results
from exploiting automatic re-follow behavior to pad numbers of
followers, or from accounts in a botnet following each other.
• Very short replies when accounts are engaged by others, or replies
with grammatical errors unlikely to have been made by native
speakers. Shorter replies can hide lack of English language skills,
and they can be easier to automate without raising suspicion.
No single feature is a perfect predictor, and bot prediction is proba-
bilistic rather than exact. Detecting fake accounts has also become an
arms race, as bot creators devise increasingly sophisticated bots as older
versions are discovered. New research, though, has been much more
successful at identifying newer types of “social bots” that can often fool
human observers.53
DISINFORMATION, ‘FAKE NEWS’ AND INFLUENCE CAMPAIGNS ON TWITTER 17BOTS, TROLLS AND ‘CYBORGS’ ON TWITTER
In addition to qualitative indicators of automated activity, we also used
the Tweetbotornot package, developed by University of Missouri pro-
fessor Mike Kearney.54 The core package uses gradient boosted machine
learning models to provide a probabilistic guess of the likelihood that
a given user is a bot: “The default [gradient boosted] model uses both
users-level (bio, location, number of followers and friends, etc.) and
tweets-level (number of hashtags, mentions, capital letters, etc. in a
user’s most recent 100 tweets) data.” Kearney reports 93 percent accu-
racy in validation tests.
We can also look for evidence of coordinated activity across seemingly
disconnected accounts.55 Automated accounts are not strictly necessary
for coordinated campaigns, especially for well-resourced actors (espe-
cially governments) who can hire hundreds or thousands of real people.
In practice, though, automated accounts are widely used to achieve the
scale necessary for success. Coordinated campaigns attempt to push a
single story or hashtag, often across groups of accounts with little in
common. As we shall see, similar patterns emerge in specific cases in
our data.
A recent Pew Research Center
report estimated that bots
created two-thirds of Twitter
links to popular sites.
Recent public research using similar bot classification methods has
found that bots are responsible for a large portion of link sharing on
Twitter. A recent Pew Research Center report estimated that bots cre-
ated two-thirds of Twitter links to popular sites.56 Similarly, in looking
at Twitter misinformation during the election period, Shao et al. find
that the dense core of misinformation accounts is dominated by social
bots.57 We therefore expect bots and heavily automated accounts to play
a key role in our maps of disinformation accounts.
DISINFORMATION, ‘FAKE NEWS’ AND INFLUENCE CAMPAIGNS ON TWITTER 18MAP
METHODOLOGY
Graphika’s key unit of analysis is a map, which catalogs a collec-
tion of key social media accounts around a particular topic. A
map shows how social media accounts are connected to each
other through social relationships embedded in the platform—
in the case of Twitter, through patterns of followership. This
section walks through the process by which these maps are
constructed and the insights they can provide on a given topic.
SEED SET
To find a community of sites that tweet or retweet links to fake news
articles, we need to start with a “seed set”—defined in this case by a
group of sites that publish fake news. These sites will be the start of
our analysis, and we will look for Twitter accounts that link to those
fake news outlets. Seed sets need to be representative but not necessar-
ily comprehensive: Additional fake news outlets can be discovered even
if not included in the initial seed set, so long as they are linked to by
similar user accounts.
Our goal in constructing the seed set is twofold. First, we strive to be
conservative in what counts as “fake news,” focusing just on sites
that regularly publish unverified stories or flat-out falsehoods.
Second, despite these constraints, we wanted to cast as wide a
net as possible, collecting data on a broader set of fake news outlets
than previous studies.
After discussions with other researchers and a review of previous
work, we decided to use a list of news sites maintained by OpenSources
(opensources.co). OpenSources describes itself as “a curated resource
for assessing online information sources” and includes a large-scale,
open-source, human-coded list of both credible and noncredible
sources. Our seed set includes outlets that OpenSources lists as “fake”
or “conspiracy.” Conspiracy sites include many outlets associated with
false news stories, such as prominent category member Infowars. Sites
may be included in more than one category in the OpenSources data set.
DISINFORMATION, ‘FAKE NEWS’ AND INFLUENCE CAMPAIGNS ON TWITTER 19MAP METHODOLOGY
In practice, outlets that OpenSources labels as fake or conspiracy sites
are a superset of other public listings of fake news sites. A site listed
as fake or conspiracy news in the OpenSources database is nearly
always categorized that way in other public lists. Moreover, when
comparing various lists of sites judged to be fake news by reputable
organizations, there was little disagreement on the sites that multiple
entities had investigated.
Sites included in at least one of those two categories (fake news or con-
spiracy news) produced a seed set of more than 600 outlets. Although
the researchers did not classify these outlets themselves, they did
undertake efforts to check that the OpenSources list was consistent with
the stated claims. As a verification check, 1,000 URLs linking to our seed
set of fake news sites were sampled at random from the Twitter data-
base. Sites were considered correctly classified if (1) the story linked
was substantially false or (2) the front page of the website when viewed
in mid-April 2017 contained at least one false story. This initial check
found one site incorrectly classified, a conservative-leaning but credible
D.C.-based print publication that was wrongly placed in the conspiracy
category. Upon rechecking the OpenSources listing, we found this appar-
ent mistake had already been corrected. A second, 2,000-URL random
sample of links to the seed set was conducted with the slightly revised
OpenSources list. In this case, no misclassified outlets were discovered.
MAP LAYOUT AND COLORING
Graphika’s map-drawing process is roughly 95 percent automated.
After data are collected and the least-connected accounts are filtered
out, maps are drawn using the Fruchterman-Reingold visualization
algorithm.58 Accounts are placed on the map according to a tug of war
between competing forces. All accounts have a centrifugal force trying
to push them to the edge of the map. In addition, accounts that fol-
low similar sets of sites are attracted to each other, and they resist the
force pushing them toward the edge. This algorithm means that closely
interlinked groups with many co-followers end up forming clusters.
The closer two sites are on the map, the more “friends” they share on
average. Note that the visual clusters produced by the layout algorithm
and the segments generated by Graphika’s clustering engine are not
identical: Though the two frequently overlap, some segments (such as
the International Conspiracy | Activist cluster in the postelection map) are
spread throughout the map.
Algorithms also determine the size and color of the shapes used to rep-
resent each Twitter account. The size of each shape is proportional to
the logarithm of the number of followers each account has.
DISINFORMATION, ‘FAKE NEWS’ AND INFLUENCE CAMPAIGNS ON TWITTER 20MAP METHODOLOGY
GROUPS AND SEGMENTS
Accounts only loosely connected to the network are filtered out using
K-core decomposition, leaving just those with multiple links to other
accounts.59 Remaining accounts are then divided first into groups and
then into segments, which are subgroups of sites under the umbrella
of the larger group. Segments are collections of accounts that share
particular interests, which means that they follow overlapping sets of
accounts. The group and segment classification method is a variant of
hierarchical agglomerative clustering.60 HAC is a “bottom-up” method
that starts by considering each account as a singleton, and then pro-
gressively grouping sites into bigger and bigger clusters based on the
similarity of the accounts they follow.
Once groups and segments are generated, supervised machine learn-
ing techniques label each set of accounts based on human-categorized
examples. After the automated process is finished, a human subject
matter expert performs a quality assurance check on the segment and
group labels.
In Graphika Twitter maps, accounts are colored based on the group and
segment they cluster with. Accounts in each segment are assigned the
same color, with different segments in the same overarching group
sharing a color palette—for example, different shades of pink.
MEASURING INFLUENTIAL ACCOUNTS
AND SUBJECTS OF INTEREST
Categorizing sites into groups and segments also allows for deeper
analysis, allowing us to find words, phrases, websites and accounts
especially favored by each subgroup compared with other subgroups.61
Each segment and group thus has an associated collection of Influencers,
Conversation Leaders, Websites and Terms. Influencers and Conversation
Leaders represent the accounts that most strongly shape group and
segment discussion. Influencers are users especially likely to be followed
by accounts in that segment, and Conversation Leaders are users pref-
erentially mentioned by accounts in that segment. Websites are URLs
preferentially linked to by users in that segment, and Terms are key-
words preferentially used in tweets from that segment.
We measure these group and segment preferences with CFI scores and
M-scores. CFI scores describe how “focused” the segment or group is on
the object: Higher scores mean bigger gaps between a given group (or
segment) and the baseline patterns seen in other groups.62 M-scores
combine CFI with raw counts of interactions by segment members.
DISINFORMATION, ‘FAKE NEWS’ AND INFLUENCE CAMPAIGNS ON TWITTER 21ELECTION DATA
AND MAPS
With the seed set chosen, data were collected from Twitter.
We began by gathering data on all tweets that referenced our
list of fake news sites in the 30 days before the 2016 election.
All told, we found 6,610,875 tweets or retweets that linked to one of our
600-plus fake or conspiracy websites during the month before the elec-
tion. These 6.6 million sampled tweets and retweets came from 454,832
separate accounts, an exceptionally broad swath of Twitter. At total of
73,296 accounts tweeted links to one or more of these sites at least 10
times over the 30-day election period.
Despite the enormous number of tweets referencing fake news sites, a
few heavily (re)tweeted outlets dominated. During the election period,
the top 10 sites accounted for 65 percent of all tweets of fake news
links, while the 50 most linked fake news sites accounted for 89 percent
of tweets pointing to fake news. These figures are substantially differ-
ent from the picture of fake news that dominated early media reports,
which repeatedly portrayed fake news production as organic, sponta-
neous and small-scale.
The more than 73,000 accounts that (re)tweeted our fake news sites at
least 10 times in our sampled data are our starting set from which we
draw the map. From this group, accounts with 10 followers or fewer in
common with the rest of the group were removed. Note that this fil-
tering mechanism, by itself, can often remove significant numbers of
bots; bots on average have fewer followers and “friends” (accounts they
follow which follow them back) and are less densely connected to the
Twitter network. Even after this initial filtering step, though, 27,125
sites qualified for inclusion in the overall map. This makes the election
map one of the largest and densest maps Graphika has ever produced.
After considering the problem in detail, we decided that the most useful
approach would be to pull out the ultra-dense, highly connected core
as its own map, with less connected sites mapped out separately (see
periphery map below).
Accounts with a K-core of 175 or greater—that shared at least 175 fol-
lowers on average with the rest of the map—were included in the core
map. Remarkably, 13,861 sites met this extremely high bar for inclusion.
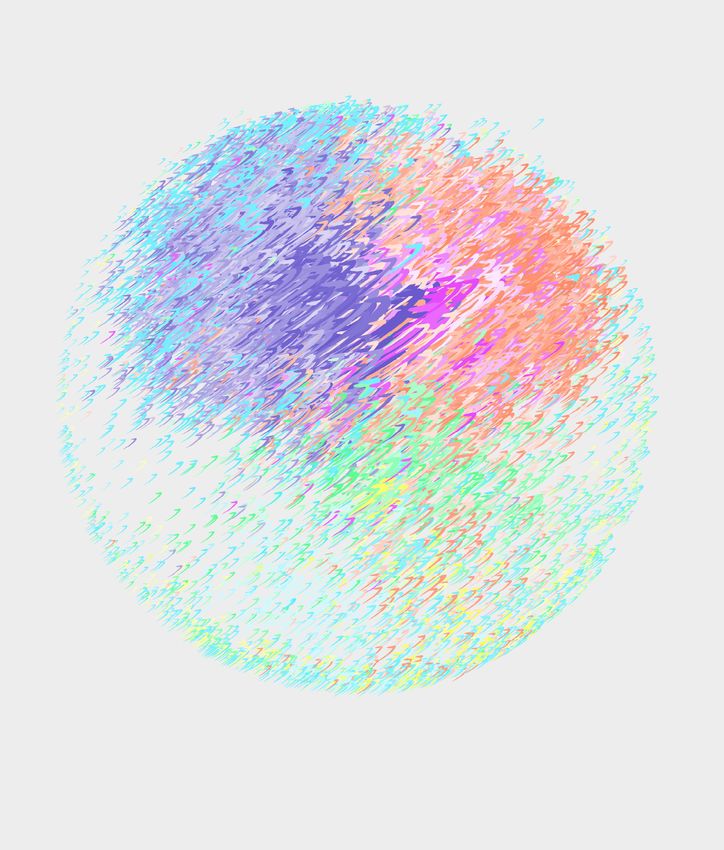
DISINFORMATION, ‘FAKE NEWS’ AND INFLUENCE CAMPAIGNS ON TWITTER 22FIGURE 1 Election Core MAP DISINFORMATION, ‘FAKE NEWS’ AND INFLUENCE CAMPAIGNS ON TWITTER 23
ELECTION DATA AND MAPS

       Election                  Let us start with the election core map, with reflects Twitter activity
       Core Map                  surrounding fake and conspiracy news stories among the most followed
                                 accounts (Figure 1). Near the center of the map is a cluster of accounts
                                 with hundreds of thousands of followers each, including prominent
                                 conservative commentators and individuals associated with the Trump
                                 campaign. The central placement of these accounts reflects the fact that
                                 they are widely followed by other accounts on the map, not the volume
                                 of fake news that these accounts are tweeting.

                                 From this central nexus we can see the intersection of different groups
                                 of accounts colored in shades of blue, salmon and pink. Segments in
                                 the Pro-Trump group are in shades of blue, and these segments create a
                                 dense cluster of interlinked accounts in the bottom center of the map.

                                 Above the center of the map, we can see the Conservative group with its
                                 component segments in shades of salmon, and the Hard Conservative
                                 group with segments in shades of pink. The various Conservative seg-
                                 ments are highly dispersed and together cover nearly the entire map. The
                                 Pro-Trump group and the Hard Conservative group, though, strongly
                                 overlap with each other. This unusual pattern, with little spatial sep-
                                 aration between the various groups and segments, reflects the densely
                                 interconnected nature of political Twitter on the eve of the 2016 election.

                                 The clear outlier segments, as expected, are all placed in the Other group.
                                 Here we can see clusters of accounts that focus on anti-immigrant or
                                 anti-Muslim themes, those that promote conspiracy theories, accounts
                                 that defend Julian Assange of WikiLeaks, and a few self-proclaimed
                                 racist and “white identity” accounts. These segments, in shades of
                                 aquamarine, are scattered mostly through the left half of the map.
                                 Many are pushed all the way to the edge, reflecting the relative lack of
                                 connection to sites in the middle of the map.

                                 The dense and highly overlapping structure of this map reflects just
                                 how strongly integrated noncredible and fake news outlets were with
                                 credible discourse in the lead-up to the 2016 election. Links to fake
                                 news sites tweeted by this core group are nearly guaranteed to spread
                                 widely and quickly.

                                 We do identify a number of segments linking especially often to par-
                                 ticular fake news or conspiracy-leaning websites. Accounts within the
                                 Trump Support | Core, Always Trump, and MAGA | Conservative segments
                                 are especially active in linking to the Truthfeed site. Accounts in the
                                 Constitutional Conservative segment link often to The Gateway Pundit,
                                 while Libertarian Journos accounts are more likely to link to Activist Post.

                                 In most segments, however, we do not see links to specific fake news
                                 dramatically more than other segments. Partly, this reflects the high
                                 baseline rate of links to fake news outlets, which is a function of how
                                 the map was created.

DISINFORMATION, ‘FAKE NEWS’ AND INFLUENCE CAMPAIGNS ON TWITTER                                                  24
FIGURE 2 Election Periphery MAP DISINFORMATION, ‘FAKE NEWS’ AND INFLUENCE CAMPAIGNS ON TWITTER 25
ELECTION DATA AND MAPS

       Election                  While the election core map is ultra-dense and heavily overlapping, the
       Periphery Map             second, periphery map (Figure 2) looks different. Here we are examin-
                                 ing fake and conspiracy news sharing among Twitter accounts outside
                                 the ultra-connected central nodes of the previous graph. Despite
                                 removing the dense Pro-Trump core, this map still shows a cluster of
                                 accounts near the center-left—though these accounts have far fewer
                                 followers on average than those in the core map. But in contrast to the
                                 previous map, we see greater spatial separation between groups. The
                                 periphery map includes 13,264 accounts.

                                 Let us start with the right side of the map, where we can see the
                                 U.S. Right group in shades of blue, totaling a whopping 4,732 accounts.
                                 Most accounts in this group have relatively few followers, but this is
                                 largely a selection effect: Many similar accounts with more followers
                                 are included in the core map.

                                 A large number of accounts included in the U.S. Right group, par-
                                 ticularly those on the periphery of the map, show clear evidence of
                                 automated posting. Consistent with indications of widespread automa-
                                 tion, nearly all of the segments in the U.S. Right link heavily to multiple
                                 fake news outlets—a rate far above similar segments in the core map.

                                 Continuing clockwise around the map, we encounter the Libertar-
                                 ian group in orange. The U.S. Libertarian and U.S. Libertarian Journos
                                 segments are widely spread across the map, reflecting their ties to
                                 a heterodox set of accounts. Several accounts of libertarian journal-
                                 ists near the center of the maps are the most followed accounts on the
                                 entire periphery map. The U.S. Libertarian group, perhaps unsurpris-
                                 ingly, links to a number of libertarian-leaning sites that traffic often in
                                 conspiracy theorizing.

                                 The periphery map also shows that fake news is not just the province of
                                 accounts claiming to be pro-Trump or right-wing. Continuing clockwise,
                                 in the bottom center of the map, is the U.S. Liberal group in shades of
                                 pink. In this category, 1,206 accounts are placed in six segments. Some
                                 of these accounts offer seemingly contradictory messaging, combining
                                 attacks on the Democratic Party and Hillary Clinton from the left with
                                 endorsement of ultra right-wing conspiracy theories and retweets of
                                 Russia propaganda outlets such as RT and Sputnik.

                                 In the bottom-left quadrant, we can find accounts and segments in the
                                 International Conspiracy | Activist group in eastern blue. These include
                                 self-proclaimed anti-New World Order accounts, accounts associated
                                 with the hacker collective Anonymous, and accounts supportive of the
                                 Occupy movement. U.K. far-left accounts also make an appearance,

DISINFORMATION, ‘FAKE NEWS’ AND INFLUENCE CAMPAIGNS ON TWITTER                                                 26
ELECTION DATA AND MAPS
along with ostensibly pro-Palestinian accounts. The Anti-NWO segments
link heavily to Russia Insider and The Russophile, news sites that are
overwhelmingly pro-Kremlin. The Pro-Palestine segment similarly often
links to Russia Insider, a self-proclaimed “debunking” site based in
Russia that regularly pushes Putin-friendly articles.
In green, on the left side of the map, we can see the Russia group.
The Russian News | Politics segment is near the far left edge of the map,
showing relatively weak ties to other accounts. This is consistent with
our expectations, since most of these accounts post only in the Russian
language. Of particular interest is the Russian Trolls Abroad segment,
a cluster of accounts which pushes the Kremlin line on almost every-
thing—often in provocative ways. This segment is among the most
aggressive of any on the map in pushing fake news. Several prominent
accounts in this segment have been suspended since the election.
Continuing clockwise around the map, we see the European Right group
in aquamarine on the top left. Included in this group are segments
associated with the U.K. Independence Party, pro-Brexit segments,
and segments supportive of Geert Wilders and the right wing of Dutch
politics. We can also see strong connections between sites that seem
to be right-wing French accounts. Many of these supposedly French
accounts, though, focus to a large degree on Russian issues from a
pro-Putin perspective, a strong indication of bot or troll accounts.
The Far Right France | Russia and European Right segments often link
to the French and German versions of RT, respectively.
Lastly, two groups are spread extremely widely across the maps and
cannot be easily localized. The Social Media Marketing group, in yellow,
consists mainly of accounts that focus on paid promotions. Many of
these accounts postelection seem to have nothing to do with politics,
instead promoting a motley array of commercial products. Likely these
accounts were paid for political tweets and links during the election and
have since moved on to other clients.
The Other group is similarly a grab bag of segments devoted to a host
of different topics. The International RT | WikiLeaks segment is one of
the most interesting in this group. Curiously, this segment includes
several of the official Twitter accounts of fake news outlets. This pat-
tern is particularly striking because these sites seem to have no obvious
connection to Russia, WikiLeaks or indeed international content of any
type, and yet these fake news sites share a significant fraction of their
Twitter followers. This fact alone is curious, particularly in a map dom-
inated by bots and semi-automated accounts.
DISINFORMATION, ‘FAKE NEWS’ AND INFLUENCE CAMPAIGNS ON TWITTER 27FIGURE 3 Postelection MAP DISINFORMATION, ‘FAKE NEWS’ AND INFLUENCE CAMPAIGNS ON TWITTER 28
ELECTION DATA AND MAPS

       Postelection              For our final map (Figure 3), we turn to the 30-day period between
       Map                       March 12 and April 12, 2017. Overall during this period, 428,182 accounts
                                 in our sample (re)tweeted links to fake news, and more than 4.0 million
                                 tweets or retweets linked to fake or conspiracy news sites—a drop from
                                 the 6.6 million in the month preceding the election, but still an enor-
                                 mous volume of content.

                                 As before, in creating the postelection map, we keep only accounts
                                 that linked to fake news at least 10 times in our sample, filtering out
                                 accounts that linked to fake news sites less often. We also filter out
                                 accounts only minimally connected to the rest of the graph with K-core
                                 decomposition: Only sites with a K-core of 10 or greater are included. A
                                 total of 12,032 accounts meet both criteria.

                                 We examined accounts included in the postelection map using the
                                 Tweetbotornot machine learning package (Kearney 2018; see discussion
                                 above). The top 100 accounts, ranked by the number of followers who
                                 are also included in the map, averaged a 33 percent probability of being
                                 a bot—suggesting that automated posting is relatively common even
                                 among the most followed accounts in our map. We also classified 300
                                 randomly selected accounts from the entire map, excluding the top 100;
                                 this random set of accounts was given an average 63 percent probabil-
                                 ity of being a bot.63 These numbers do not include the 11 percent of the
                                 postelection map accounts that were suspended by Twitter as of April
                                 2018, a group that overrepresents bots.

                                 There is thus strong evidence that a majority of accounts in the
                                 map—and likely more than two-thirds—are bots or heavily
                                 automated cyborg accounts.

                                 This map resembles the election core map much more than the periph-
                                 ery map. While the orientation of the map is different, this does not
                                 change the overall relationships between accounts. The same accounts
                                 are clustered together even if the map is flipped from left to right, or if
                                 the map is rotated from top to bottom.

                                 Like the core election map, the postelection map is ultra-dense and
                                 heavily overlapping, with the most popular accounts clustered near the
                                 center. The largest of these groups can be seen in the upper-left quad-
                                 rant. The Trump Support group in blue dominates this upper-left section,
                                 and it contains 15 distinct segments (subgroups). Particularly notable is
                                 the Pro-Trump Far Right segment, a set of ultra-popular accounts in the
                                 upper middle of the map.

DISINFORMATION, ‘FAKE NEWS’ AND INFLUENCE CAMPAIGNS ON TWITTER                                                 29
You can also read


