STATE OF THE CLIMATE IN 2019 - THE ARCTIC J. Richter-Menge and M. L. Druckenmiller, Eds - American Meteorological Society
←
→
Page content transcription
If your browser does not render page correctly, please read the page content below
STATE OF THE CLIMATE IN 2019
             THE ARCTIC
             J. Richter-Menge and M. L. Druckenmiller, Eds.

                                                                                                                                              Downloaded from http://journals.ametsoc.org/bams/article-pdf/101/8/S239/4988919/bamsd200086.pdf by guest on 04 November 2020

Special Online Supplement to the Bulletin of the American Meteorological Society, Vol.101, No. 8, August, 2020

https://doi.org/10.1175/BAMS-D-20-0086.1
Corresponding author: Matthew L. Druckenmiller / druckenmiller@nsidc.org
©2020 American Meteorological Society
For information regarding reuse of this content and general copyright information, consult the AMS Copyright Policy.

                AU G U S T 2 0 2 0 | S t a t e o f t h e C l i m a t e i n 2 0 1 9                                     5. THE ARCTIC   S239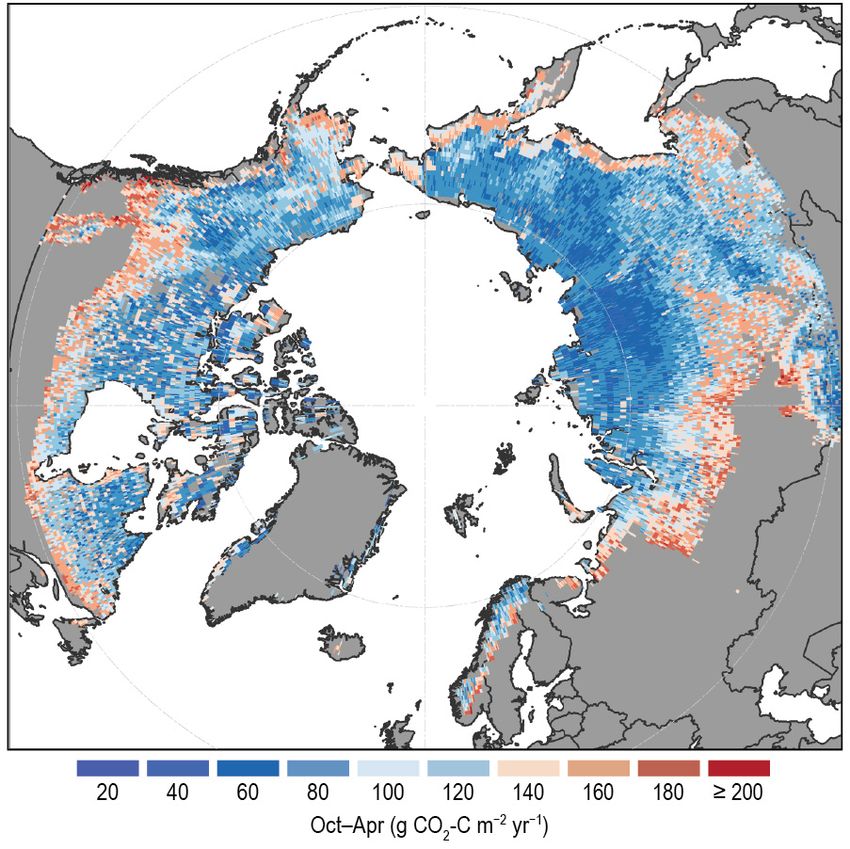
STATE OF THE CLIMATE IN 2019
                             The Arctic

                                                                         Editors

                                                                     Jessica Blunden
                                                                      Derek S. Arndt

                                                                     Chapter Editors

                                                                                                               Downloaded from http://journals.ametsoc.org/bams/article-pdf/101/8/S239/4988919/bamsd200086.pdf by guest on 04 November 2020
                                                                   Peter Bissolli
                                                               Howard J. Diamond
                                                           Matthew L. Druckenmiller
                                                                Robert J. H. Dunn
                                                                Catherine Ganter
                                                                 Nadine Gobron
                                                                  Rick Lumpkin
                                                          Jacqueline A. Richter-Menge
                                                                      Tim Li
                                                               Ademe Mekonnen
                                                              Ahira Sánchez-Lugo
                                                                 Ted A. Scambos
                                                                Carl J. Schreck III
                                                              Sharon Stammerjohn
                                                               Diane M. Stanitski
                                                                 Kate M. Willett

                                                                     Technical Editor

                                                                     Andrea Andersen

                                                    BAMS Special Editor for Climate

                                                                      Richard Rosen

                                                   American Meteorological Society

AU G U S T 2 0 2 0 | S t a t e o f t h e C l i m a t e i n 2 0 1 9                      5. THE ARCTIC   S240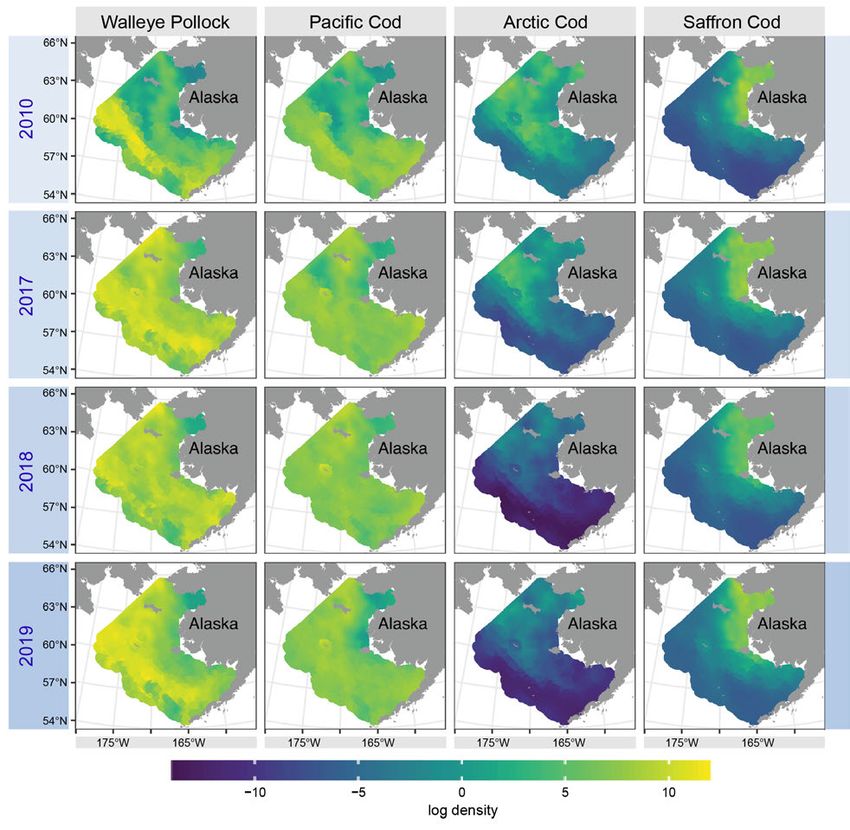
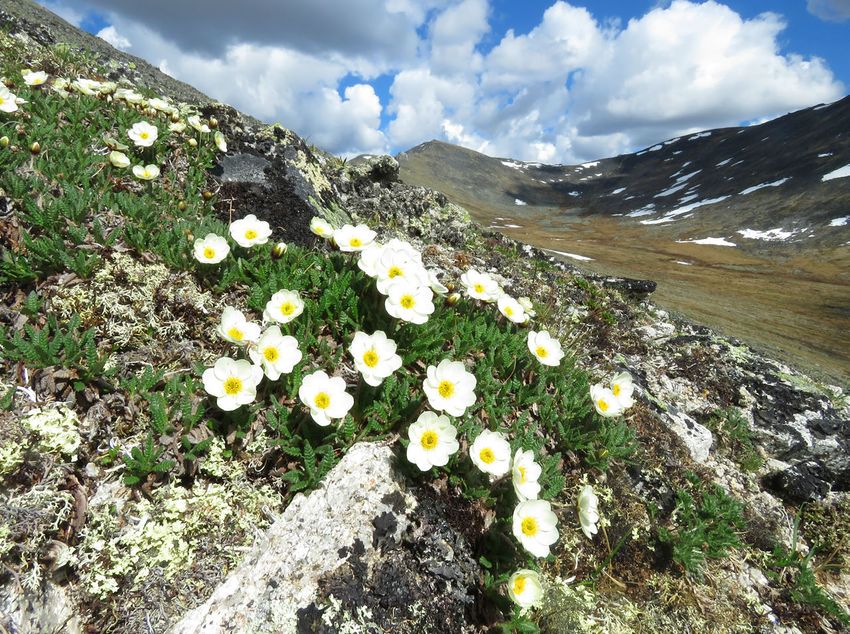
Cover credit:
A patch of eightpetal mountain-avens (Dryas octopetala) bloom on a tundra hillslope in the Brooks
Range near Atigun Pass, northern Alaska, 2 June 2019. Photo by Gerald V. Frost.

                                                                                                                 Downloaded from http://journals.ametsoc.org/bams/article-pdf/101/8/S239/4988919/bamsd200086.pdf by guest on 04 November 2020
The Arctic is one chapter from the State of the Climate in 2019 annual report and is available
from https://doi.org/10.1175/BAMS-D-20-0086.1. Compiled by NOAA’s National Centers for
Environmental Information, State of the Climate in 2019 is based on contributions from
scientists from around the world. It provides a detailed update on global climate indicators,
notable weather events, and other data collected by environmental monitoring stations and
instruments located on land, water, ice, and in space. The full report is available from
https://doi.org/10.1175/2020BAMSStateoftheClimate.1.

How to cite this document:

Citing the complete report:
Blunden, J. and D. S. Arndt, Eds., 2020: State of the Climate in 2019. Bull. Amer. Meteor. Soc.,
101 (8), Si–S429, https://doi.org/10.1175/2020BAMSStateoftheClimate.1.

Citing this chapter:
Richter-Menge, J. and M. L. Druckenmiller, Eds., 2020: The Arctic [in “State of the Climate in
2019"]. Bull. Amer. Meteor. Soc., 101 (8), S239–S285, https://doi.org/10.1175/BAMS-D-20-0086.1.

Citing a section (example):
Mudryk, L., R. Brown, C. Derksen, K. Luojus, and B. Decharme, 2020: Terrestrial snow cover
[in “State of the Climate in 2019"]. Bull. Amer. Meteor. Soc., 101 (8), S263–S265,
https://doi.org/10.1175/BAMS-D-20-0086.1.

 AU G U S T 2 0 2 0 | S t a t e o f t h e C l i m a t e i n 2 0 1 9                       5. THE ARCTIC   S241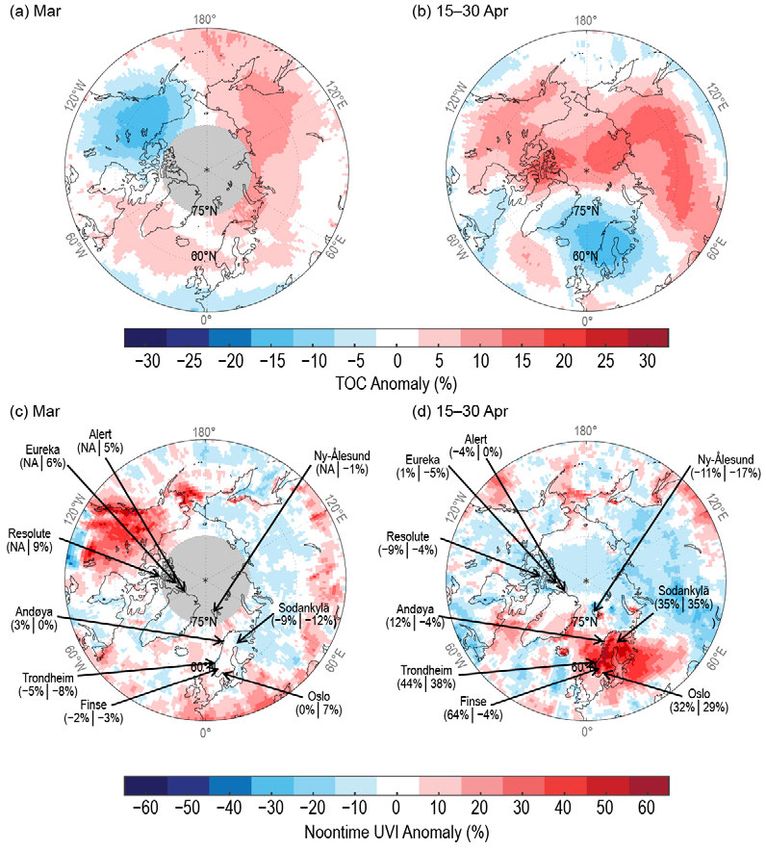
Editor and Author Affiliations (alphabetical by name)

Andersen, J. K., Geological Survey of Denmark and Greenland, Copenhagen,              Kholodov, A. L., Geophysical Institute, University of Alaska Fairbanks,
    Denmark                                                                               Fairbanks, Alaska
Andreassen, Liss M., Section for Glaciers, Ice and Snow, Norwegian Water              Kim, Seong-Joong, Korea Polar Research Institute, Incheon, Republic of Korea
    Resources and Energy Directorate, Oslo, Norway                                    Kohler, Jack, Norwegian Polar Institute, Tromsø, Norway
Baker, Emily H., U.S. Geological Survey, Alaska Science Center, Anchorage,            Labe, Zachary, University of California at Irvine, Irvine, California
    Alaska                                                                            Ladd, Carol, NOAA/OAR Pacific Marine Environmental Laboratory, Seattle,
Ballinger, Thomas J., International Arctic Research Center, University of Alaska          Washington
    Fairbanks, Fairbanks, Alaska                                                      Lakkala, Kaisa, Finnish Meteorological Institute, Sodankylä, Finland
Berner, Logan T., School of Informatics, Computing, and Cyber Systems,                Lara, Mark J., Department of Plant Biology and Department of Geography,
    Northern Arizona University, Flagstaff, Arizona                                       University of Illinois at Urbana-Champaign, Urbana, Illinois
Bernhard, Germar H., Biospherical Instruments Inc., San Diego, California             Loomis, Bryant, NASA Goddard Space Flight Center, Greenbelt, Maryland
Bhatt, Uma S., Geophysical Institute, University of Alaska Fairbanks, Fairbanks,      Luks, Bartłomiej, Institute of Geophysics, Polish Academy of Sciences, Warsaw,
    Alaska                                                                                Poland
Bjerke, Jarle W., Norwegian Institute for Nature Research, FRAM – High North          Luojus, K., Arctic Research Centre, Finnish Meteorological Institute, Helsinki,

                                                                                                                                                                          Downloaded from http://journals.ametsoc.org/bams/article-pdf/101/8/S239/4988919/bamsd200086.pdf by guest on 04 November 2020
    Research Centre for Climate and the Environment, Tromsø, Norway                       Finland
Box, Jason E., Geological Survey of Denmark and Greenland, Copenhagen,                Macander, Matthew J., ABR, Inc. Environmental Research & Services,
    Denmark                                                                               Fairbanks, Alaska
Britt, L., NOAA/NMFS Alaska Fisheries Science Center, Seattle, Washington             Malkova, G. V., Earth Cryosphere Institute, Tyumen Science Center, Tyumen,
Brown, R., Climate Research Division, Environment and Climate Change                      Russia
    Canada, Montréal, Quebec, Canada                                                  Mankoff, Kenneth D., Geological Survey of Denmark and Greenland,
Burgess, David, Geological Survey of Canada, Ottawa, Ontario, Canada                      Copenhagen, Denmark
Cappelen, John, Danish Meteorological Institute, Copenhagen, Denmark                  Manney, Gloria L., NorthWest Research Associates, and New Mexico Institute
Christiansen, Hanne H., Geology Department, University Centre in Svalbard,                of Mining and Technology, Socorro, New Mexico
    The University Center in Svalbard, Longyearbyen, Norway                           Marsh, J. M., College of Fisheries and Ocean Sciences, University of Alaska
Decharme, B., Centre National de Recherches Météorologiques, France                       Fairbanks, Fairbanks, Alaska
Derksen, C., Climate Research Division, Environment and Climate Change                Meier, Walt, National Snow and Ice Data Center, Cooperative Institute for
    Canada,Downsview, Ontario, Canada                                                     Research in Environment Sciences at the University of Colorado, Boulder,
Drozdov, D. S., Earth Cryosphere Institute, and Tyumen State University,                  Colorado
    Tyumen, Russia                                                                    Moon, Twila A., National Snow and Ice Data Center, Cooperative Institute for
Druckenmiller, Matthew L., National Snow and Ice Data Center, Boulder,                    Research in Environmental Sciences at the University of Colorado, Boulder,
    Colorado                                                                              Colorado
Epstein, Howard E., Department of Environmental Sciences, University of               Mote, Thomas, Department of Geography, University of Georgia, Athens,
    Virginia, Charlottesville, Virginia                                                   Georgia
Farquharson, L. M., Geophysical Institute, University of Alaska Fairbanks,            Mudryk, L., Climate Research Division, Environment and Climate Change
    Fairbanks, Alaska                                                                     Canada, Downsview, Ontario, Canada
Farrell, Sinead L., NOAA Earth System Science Interdisciplinary Center,               Mueter F. J., College of Fisheries and Ocean Sciences, University of Alaska
    University of Maryland, College Park, Maryland                                        Fairbanks, Alaska
Fausto, Robert S., Geological Survey of Denmark and Greenland, Copenhagen,            Müller, Rolf, Forschungszentrum Jülich, Jülich, Germany
    Denmark                                                                           Nyland, K. E., Department of Geography, George Washington University,
Fettweis, Xavier, SPHERES research unit, University of Liège, Liège, Belgium              Washington, D.C.
Fioletov, Vitali E., Environment and Climate Change Canada, Toronoto,                 O’Neel, Shad, U.S. Geological Survey, Alaska Science Center, Anchorage, Alaska
    Ontario, Canada                                                                   Overland, James E., NOAA/OAR Pacific Marine Environmental Laboratory,
Forbes, Bruce C., Arctic Centre, University of Lapland, Rovaniemi, Finland                Seattle, Washington
Frost, Gerald V., ABR, Inc. Environmental Research & Services, Fairbanks,             Perovich, Don, Thayer School of Engineering, Dartmouth College, Hanover, New
    Alaska                                                                                Hampshire
Gerland, Sebastian, Norwegian Polar Institute, Fram Centre, Tromsø, Norway            Phoenix, Gareth K., Department of Animal and Plant Sciences, University of
Goetz, Scott J., School of Informatics, Computing, and Cyber Systems, Northern            Sheffield, Sheffield, United Kingdom
    Arizona University, Flagstaff, Arizona                                            Raynolds, Martha K., Institute of Arctic Biology, University of Alaska Fairbanks,
Grooß, Jens-Uwe, Forschungszentrum Jülich, Jülich, Germany                                Alaska
Hanna, Edward, School of Geography and Lincoln Centre for Water and                   Reijmer, C. H., Institute for Marine and Atmospheric Research Utrecht, Utrecht
    Planetary Health, University of Lincoln, Lincoln, United Kingdom                      University, Utrecht, The Netherlands
Hanssen-Bauer, Inger, Norwegian Meteorological Institute, Blindern, Oslo,             Richter-Menge, Jacqueline, University of Alaska Fairbanks, Institute of
    Norway                                                                                Northern Engineering, Fairbanks, Alaska
Hendricks, Stefan, Alfred Wegener Institute, Helmholtz Centre for Polar and           Ricker, Robert, Alfred Wegener Institute, Helmholtz Centre for Polar and
    Marine Research, Bremerhaven, Germany                                                 Marine Research, Bremerhaven, Germany
Ialongo, Iolanda, Finnish Meteorological Institute, Helsinki, Finland                 Romanovsky, Vladimir E., Geophysical Institute, University of Alaska
Isaksen, K., Norwegian Meteorlogical Institute, Blindern, Oslo, Norway                    Fairbanks, Fairbanks, Alaska; Earth Cryosphere Institute, Tyumen Science
Johnsen, Bjørn, Norwegian Radiation and Nuclear Safety, Østerås, Norway                   Center, Tyumen, Russia
Kaleschke, L., Alfred Wegener Institute, Helmholtz Centre for Polar and Marine        Schuur, E. A. G., Center for Ecosystem Science and Society, Northern Arizona
    Research, Bremerhaven, Germany                                                        University, Flagstaff, Arizona

                 AU G U S T 2 0 2 0 | S t a t e o f t h e C l i m a t e i n 2 0 1 9                                                         5. THE ARCTIC         S242
Sharp, Martin, Department of Earth and Atmospheric Sciences, University of            van de Wal, R. S. W., Institute for Marine and Atmospheric Research Utrecht,
    Alberta, Edmonton, Alberta, Canada                                                    Utrecht University, Utrecht, The Netherlands
Shiklomanov, Nikolai I., Department of Geography, George Washington                   Walker, Donald A., Institute of Arctic Biology, University of Alaska Fairbanks,
    University, Washington, D.C.                                                          Alaska
Smeets, C. J. P. P., Institute for Marine and Atmospheric Research Utrecht,           Walsh, John E., International Arctic Research Center, University of Alaska
    Utrecht University, Utrecht, The Netherlands                                          Fairbanks, Fairbanks, Alaska
Smith, Sharon L., Geological Survey of Canada, Natural Resources Canada,              Wang, Muyin, NOAA/OAR Pacific Marine Environmental Laboratory, and
    Ottawa, Ontario, Canada                                                               Joint Institute for the Study of the Atmosphere and Ocean, University of
Streletskiy, Dimitri A., Department of Geography, George Washington                       Washington, Seattle, Washington
    University, Washington, D.C.                                                      Webster, Melinda, Geophysical Institute, University of Alaska Fairbanks,
Tedesco, Marco, Lamont Doherty Earth Observatory, Columbia University,                    Fairbanks, Alaska
    Palisades, New York, and NASA Goddard Institute of Space Studies, New             Winton, Øyvind, Geological Survey of Denmark and Greenland, Copenhagen,
    York, New York                                                                        Denmark
Thoman, Richard L., International Arctic Research Center, University of Alaska        Wolken, Gabriel J., Alaska Division of Geological & Geophysical Surveys;
    Fairbanks, Fairbanks, Alaska                                                          University of Alaska Fairbanks, Fairbanks, Alaska

                                                                                                                                                                        Downloaded from http://journals.ametsoc.org/bams/article-pdf/101/8/S239/4988919/bamsd200086.pdf by guest on 04 November 2020
Thorson, J. T., NOAA/NMFS Alaska Fisheries Science Center, Seattle,                   Wood, K., Joint Institute for the Study of the Atmosphere and Ocean, University
    Washington                                                                            of Washington, and NOAA/OAR Pacific Marine Environmental Laboratory,
Tian-Kunze, X., Alfred Wegener Institute, Helmholtz Centre for Polar and                  Seattle, Washington
    Marine Research, Bremerhaven, Germany                                             Wouters, Bert, Institute for Marine and Atmospheric Research, Utrecht
Timmermans, Mary-Louise, Yale University, New Haven, Connecticut                          University, Utrecht, Netherlands; Department of Geoscience & Remote
Tømmervik, Hans, Norwegian Institute for Nature Research, Tromsø, Norway                  Sensing, Delft University of Technology, Delft, The Netherlands
Tschudi, Mark, Aerospace Engineering Sciences, University of Colorado,                Zador, S., NOAA/NMFS Alaska Fisheries Science Center, Seattle, Washington
    Boulder, Colorado
van As, Dirk, Geological Survey of Denmark and Greenland, Copenhagen,
    Denmark

          Editorial and Production Team
Andersen, Andrea, Technical Editor, Innovative Consulting                             Love-Brotak, S. Elizabeth, Lead Graphics Production, NOAA/NESDIS
    Management Services, LLC, NOAA/NESDIS National Centers for                            National Centers for Environmental Information, Asheville, North Carolina
    Environmental Information, Asheville, North Carolina                              Misch, Deborah J., Graphics Support, Innovative Consulting Management
Griffin, Jessicca, Graphics Support, Cooperative Institute for Satellite                  Services, LLC, NOAA/NESDIS National Centers for Environmental
    Earth System Studies, North Carolina State University, Asheville,                     Information, Asheville, North Carolina
    North Carolina                                                                    Riddle, Deborah B., Graphics Support, NOAA/NESDIS National Centers for
Hammer, Gregory, Content Team Lead, Communications and Outreach,                          Environmental Information, Asheville, North Carolina
    NOAA/NESDIS National Centers for Environmental Information,                       Veasey, Sara W., Visual Communications Team Lead, Communications and
    Asheville, North Carolina                                                             Outreach, NOAA/NESDIS National Centers for Environmental Information,
                                                                                          Asheville, North Carolina

                 AU G U S T 2 0 2 0 | S t a t e o f t h e C l i m a t e i n 2 0 1 9                                                        5. THE ARCTIC         S243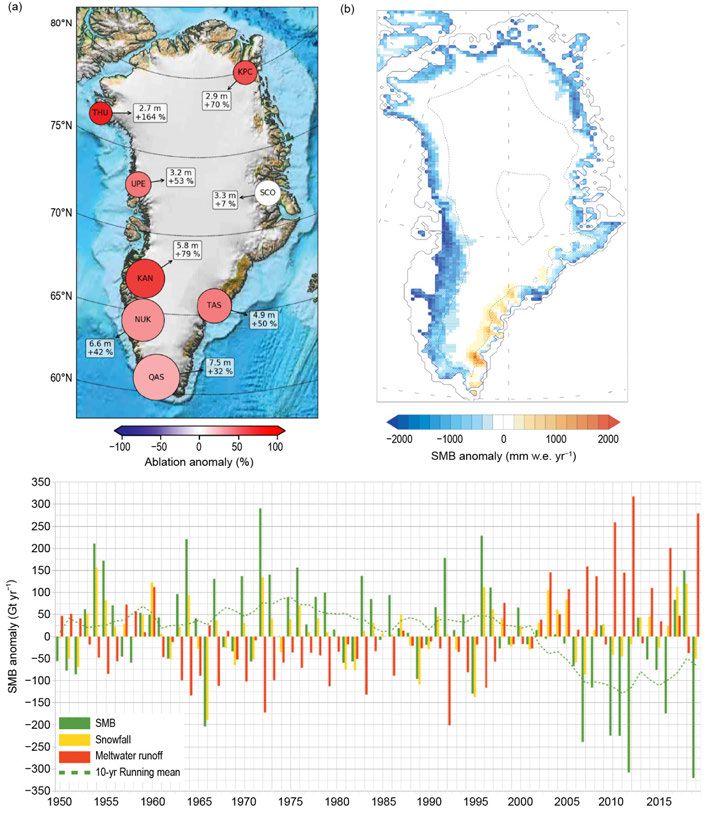
5. Table of Contents

List of authors and affiliations...................................................................................................S242
a. Overview .................................................................................................................................S245
b. Surface air temperature .........................................................................................................S246
		1. Mean annual land surface air temperature...................................................................S246
		2. Air temperature variation...............................................................................................S247
c. Sea surface temperature.........................................................................................................S249
d. Sea ice ......................................................................................................................................S251
		1. Sea ice extent...................................................................................................................S251

                                                                                                                                                                Downloaded from http://journals.ametsoc.org/bams/article-pdf/101/8/S239/4988919/bamsd200086.pdf by guest on 04 November 2020
		2. Sea ice age........................................................................................................................S252
		3. Chukchi Sea......................................................................................................................S253
     Sidebar 5.1: Shifting fish distributions in the Bering Sea...................................................S254
e. Greenland ice sheet.................................................................................................................S257
		1. Surface air temperatures, surface mass balance, and albedo......................................S257
		2. Glacier retreat and ice discharge....................................................................................S259
		3. Total mass balance...........................................................................................................S260
f. Glaciers and ice caps outside Greenland................................................................................S260
g. Terrestrial snow cover.............................................................................................................S263
h. Terrestrial permafrost.............................................................................................................S265
		1. Permafrost temperature.................................................................................................S266
		2. Active layer thickness......................................................................................................S269
     Sidebar 5.2: Permafrost carbon............................................................................................S270
i. Tundra greenness.....................................................................................................................S272
j. Ozone and UV radiation...........................................................................................................S274
		1. Ozone...............................................................................................................................S274
		2. Ultraviolet radiation........................................................................................................S276
Acknowledgments.......................................................................................................................S278
Appendix: Acronym List..............................................................................................................S280
References....................................................................................................................................S281

*Please refer to Chapter 8 (Relevant datasets and sources) for a list of all climate variables and
datasets used in this chapter for analyses, along with their websites for more information and
access to the data.

  AU G U S T 2 0 2 0 | S t a t e o f t h e C l i m a t e i n 2 0 1 9                                                                     5. THE ARCTIC   S244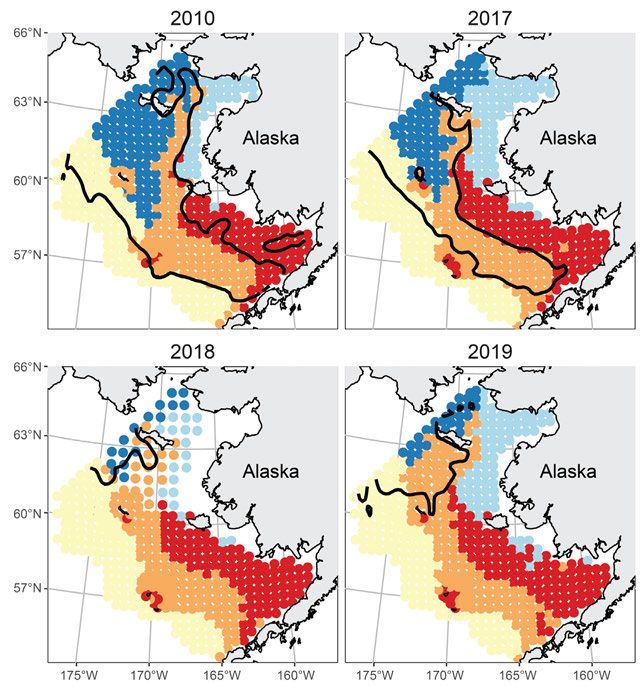
5. THE ARCTIC
J. Richter-Menge and M. L. Druckenmiller, Eds.
a. Overview—M. L. Druckenmiller and J. Richter-Menge
   Mean annual Arctic surface air temperatures (SAT) over land have increased more than twice
as fast as the global mean since the mid-1980s. Observations from 2019 continue to highlight
prolonged changes across key and connected features of the Arctic’s land, ice, ocean, and atmo-
sphere. Through these connections, the changing Arctic environment has a magnified impact
on ecosystems and societies on regional and global scales.
   Central to observed changes throughout the Arctic system is the persistent and pronounced

                                                                                                                  Downloaded from http://journals.ametsoc.org/bams/article-pdf/101/8/S239/4988919/bamsd200086.pdf by guest on 04 November 2020
increase in Arctic SAT, which in 2019 was the second highest in the 120-year observational record.
In particular, the southward displacement of the polar vortex over North America—a repeat of
conditions from 2018—brought record-high SATs to Alaska and northwest Canada. These condi-
tions contributed to the second winter in a row when sea ice coverage in the Bering Sea was by
far the lowest in observed or reconstructed records dating back to 1850 (Richter-Menge et al.
2019; Walsh et al. 2019). More generally, warming air temperatures are linked to the continued
Arctic-wide decline in the extent and thickness of the sea ice cover. In March 2019, when the ice
reached its maximum extent for the year, thin, first-year ice predominated at ~77%, compared to
about 55% in the 1980s. This transformation toward thinner and more mobile ice makes the sea
ice cover more vulnerable to melting out in summer and, therefore, diminishes the ice cover’s role
in cooling the Arctic region by reflecting incoming solar radiation back to space. In September
2019, the minimum sea ice extent at the end of summer was tied with 2007 and 2016 for the second
smallest in the 41-year satellite record.
   The declining trend in the extent of the sea ice cover is driving changes in sea surface tem-
peratures (SSTs) in the Arctic Ocean and adjacent seas, largely caused by direct solar heating of
exposed, ice-free—and thus darker (i.e., lower albedo)—Arctic waters. A warmer ocean, in turn,
melts more sea ice. This feedback, known as the ice–albedo feedback, contributes to the continued
and accelerated warming of the Arctic region. August mean SSTs show significant warming for
1982–2019 in most regions of the Arctic Ocean that are ice-free in August. On a regional scale, the
Chukchi and Bering Seas continue to exhibit larger warming trends in August than the Arctic-wide
August mean, with the Chukchi Sea mean SSTs in August 2019 being the second highest on record.
   Increased ocean temperatures and reduced sea ice in the Bering Sea are leading to shifts in fish
distributions within some of the most valuable fisheries in the world. On the Bering Sea shelf, the
summer distribution of fishes living on the seafloor is closely tied to the extent of the cold pool
(bottom water temperatures < 2°C), which forms during autumn freeze-up when cold dense water
sinks to the seafloor where it persists throughout the following summer. As this cold pool was
considerably reduced during summers 2018 and 2019 in association with the record low winter sea
ice coverage, southern fish species expanded northward. As a result, larger and more abundant
boreal (southern Bering Sea) species, as opposed to smaller and less abundant Arctic species,
dominated a large portion of the shelf in 2018 and 2019. These shifts in populations present chal-
lenges for the management of commercial and subsistence fisheries alike, while illuminating the
potential for further cascading changes to the ecosystem.
   On land, the increasing SATs are causing a decrease in the extent of the Arctic spring snow
cover, an increase in the overall amount of Arctic vegetation, and the warming and thawing of
perennially-frozen ground, known as permafrost. These components of the Arctic environment
interconnect to influence hydrology, surface stability, wildlife, infrastructure, and the livelihoods

  AU G U S T 2 0 2 0 | S t a t e o f t h e C l i m a t e i n 2 0 1 9                       5. THE ARCTIC   S245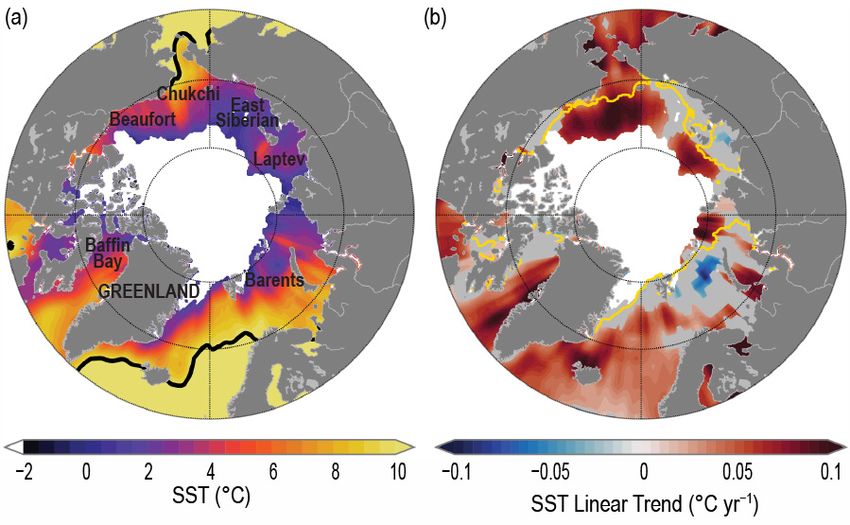
of Indigenous Peoples. Permafrost thaw also promotes the release of carbon dioxide and methane
from soils to the atmosphere through the microbial conversion of permafrost carbon that has
accumulated over hundreds to thousands of years. New evidence suggests that the increasing
release of these sequestered greenhouse gases may be shifting permafrost soils from being a net
carbon sink to being a net carbon source, thereby further accelerating global climate warming.
   Land-based ice across the Arctic is similarly responding to the persistent rise of SATs. Melt
across the Greenland ice sheet (GrIS) is contributing to global average sea level rise at a current
rate of about 0.7 mm yr−1. During the 2019 melt season, the extent and magnitude of ice loss over
the GrIS rivaled 2012, the previous year of record ice loss. Observations from 2018 and 2019 reveal
a continuing trend of significant ice loss from glaciers and ice caps across the Arctic, especially
in Alaska and Arctic Canada. The Arctic-wide mass loss from glaciers and ice caps outside of
Greenland is estimated to contribute approximately 0.4 mm yr−1 to global sea level rise, which, if
normalized by area, represents more melt water per area than the GrIS.
   Long-term observing in the Arctic has revealed a region undergoing sustained and often rapid

                                                                                                                            Downloaded from http://journals.ametsoc.org/bams/article-pdf/101/8/S239/4988919/bamsd200086.pdf by guest on 04 November 2020
change. Yet, throughout this chapter, observations are also often marked by regional differences
(e.g., continental-scale differences in snow cover and terrestrial greening), indicating a complex
and variable system, tied in part to its global connections via the ocean and atmosphere. The
Arctic plays a critical role in regulating global climate, primarily through the reflective properties
of sea ice, land ice, and snow. As these features diminish in extent, the Arctic will increasingly
exert its influence on the rest of Earth in other ways, too. Through global sea level rise, the re-
lease of permafrost carbon, and its role in steering global weather patterns, the Arctic is vitally
connected to people worldwide.
   (This chapter includes a focus on glaciers and ice caps outside Greenland, section f, which
alternates yearly with a section on Arctic river discharge, as the scales of regular observation for
both of these climate components are best suited for reporting every two years.)

b. Surface air temperature —J. E. Overland, T. J. Ballinger, E. Hanna, I. Hanssen-Bauer, S.-J. Kim, J. E. Walsh,
   M. Wang, U. S. Bhatt, and R. L. Thoman
   Arctic surface air temperature (SAT) is a leading indicator of global climate change. Although
there are year-to-year and regional differences in SATs that are driven by natural variability, the
magnitude, persistence, and Arctic-wide patterns of recent temperature increases are indicators
of global climate warming due to increasing concentrations of atmospheric greenhouse gases
(Overland 2009; Notz and Stroeve 2016). Increasing atmospheric temperatures also act as a driver
of Arctic changes in the ocean and on land. For instance, a linear relationship between global
temperature change and Arctic sea ice cover decline (section 5d) suggests a direct climate forcing
(Mahlstein and Knutti 2012). Similarly, tundra greening (section 5i), especially along coastlines,
and glacier mass loss (sections 5e,f) are also results of air temperature increases (Box et al. 2019).
   Highlights from 2019 include a mean annual SAT over Arctic land that was the second highest
in the observational record (1900–present). On the regional scale, Alaska experienced higher-
than-normal air temperatures throughout the year, especially in winter, that were associated
with unusual southerly winds and a lack of sea ice in the Bering Sea (section 5d). West Greenland
experienced especially warm localized air temperatures during spring and summer, which sup-
ported extensive ice sheet melt events (section 5e) and early regional snow melt. In autumn, a major
northward jet stream displacement resulted in extreme high temperatures in northern Greenland.

1) Mean annual land surface air temperature
   At +1.7°C, the mean annual SAT anomaly for January–December 2019 for land weather stations north
of 60°N, relative to the 1981–2010 mean, is the second-highest value after 2016 in the observational
record starting in 1900. Since the mid-1980s, Arctic warming has consistently outpaced global mean
temperature increases, leading to an Arctic that has now warmed more than twice as much as the

  AU G U S T 2 0 2 0 | S t a t e o f t h e C l i m a t e i n 2 0 1 9                                 5. THE ARCTIC   S246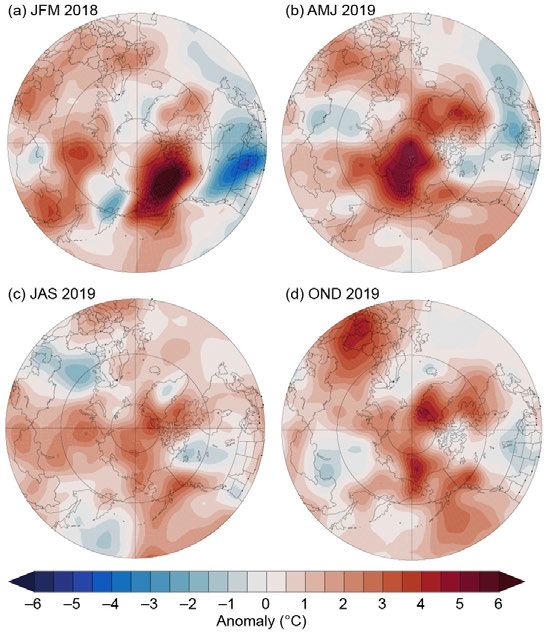
Fig. 5.1. Arctic (land stations north of 60°N; blue line) and global (red line) mean annual land SAT anomalies (in °C) for the
period 1900–2019 relative to the 1981–2010 mean value. Note that there were few stations in the Arctic, particularly in
northern Canada, before 1940. (Source: CRUTEM4 dataset.)

          globe—a phenomenon known as Arctic amplification (Fig. 5.1). While there is currently no consensus

                                                                                                                                 Downloaded from http://journals.ametsoc.org/bams/article-pdf/101/8/S239/4988919/bamsd200086.pdf by guest on 04 November 2020
          on the relative importance of several factors contributing to Arctic amplification, mechanisms include:
          reduced summer albedo due to sea ice and snow cover loss (Pithan and Mauritsen 2014); the increase
          of water vapor and clouds in the Arctic atmosphere (Dufour et al. 2016; Kim et al. 2017); lapse-rate feed-
          back (decreases in tropospheric temperature with height [Stuecker et al. 2018]); ocean heat transport
          (Langenbrunner 2020); and decreased air pollution (Acosta Navarro et al. 2016).

          2) Air temperature variation
             Seasonal air temperature variations during 2019 are divided into winter (January, February,
          March [JFM]); spring (April, May, June [AMJ]); summer (July, August, September [JAS]); and au-
          tumn (October, November, December [OND])
          (Fig. 5.2). These SAT divisions are chosen to
          coincide with the seasonal cycles of key Arctic
          variables. For instance, the summer sea ice
          minimum extent occurs in September and
          autumn cooling continues through December.
             Winter 2019 (JFM). A major Arctic warm-
          ing event in winter (Fig. 5.2a) was observed in
          Alaska and its adjacent seas, where monthly
          temperature anomalies reached more than 6°C
          above normal. Over the Bering Sea, this event
          was similar, yet even warmer than the event
          observed in winter 2018, and contributed to low
          sea ice extent and ecological impacts to fisher-
          ies (Sidebar 5.1) and marine mammals (Richter-
          Menge et al. 2019). In both cases, this pattern of
          SAT was supported by the displacement of the
          stratospheric polar vortex to over North Amer-
          ica (Fig. 5.3b). March was exceptionally warm
          over much of Alaska, the Yukon, and western
          Northwest Territories, where most places set
          all-time record high monthly means, in some
          cases 3°C higher than any previous March.          Fig. 5.2. Seasonal anomaly patterns during 2019 for near-
             In February and March 2019 (Fig 5.3a), as       SAT (in °C) relative to the baseline period 1981–2010 in (a)
                                                             winter, (b) spring, (c) summer, and (d) autumn. Temperature
          in winter 2018, strong, warm winds from the
                                                             anomalies are from slightly above the surface layer (at 925
          south over the Bering Sea greatly delayed sea      hPa level) to emphasize large spatial patterns rather than lo-
          ice advances (section 5d) and moved warm air       cal features. (Source: NCAR /NCEP reanalysis via NOAA /ESRL.)

            AU G U S T 2 0 2 0 | S t a t e o f t h e C l i m a t e i n 2 0 1 9                           5. THE ARCTIC   S247
Fig. 5.3. The geopotential height pattern (m) (a),
                                                                      (c), (d) at 700 hPa and (b) 100 hPa for selected 2019
                                                                      time periods that also reflect Arctic-wide wind pat-
                                                                      terns. The 700-hPa geopotential height field is used
                                                                      to characterize atmospheric wind circulation about
                                                                      a third of the way up in the troposphere; winds
                                                                      tend to follow the contours of geopotential heights
                                                                      anticlockwise around low values. (a) Feb–Mar 2019
                                                                      and (b) the polar vortex at 100 hPa in Feb–Mar 2019,
                                                                      which supported the winter wind pattern shown in
                                                                      Fig. 5.3a. (c) May–Aug geopotential height at 700
                                                                      hPa. There is a low geopotential height center and
                                                                      cyclonic flow near the Kara Sea and Canadian Arctic
                                                                      Archipelago and high geopotential heights and anti-
                                                                      cyclonic winds over Greenland, which acted in tandem
                                                                      to transport warm air from lower latitudes into the

                                                                                                                               Downloaded from http://journals.ametsoc.org/bams/article-pdf/101/8/S239/4988919/bamsd200086.pdf by guest on 04 November 2020
                                                                      central Arctic. The persistent ridges over the Pacific
                                                                      Arctic and Greenland caused southerly winds and
                                                                      warm air temperatures over Alaska and the southern
                                                                      Yukon Territory and over areas to the north and west
                                                                      of Greenland, respectively. (d) Rare displacement of
                                                                      the jet stream over the Canadian Arctic Archipelago
                                                                      and Baffin Bay in Oct–Dec 2019 led to extremely high
                                                                      northern Greenland temperatures. (Source: NCAR /
                                                                      NCEP reanalysis via NOAA / ESRL.)

northward along the date line into the central Arctic. The lower-level atmospheric wind pattern
(Fig. 5.3a) was connected to patterns higher in the atmosphere (i.e., the polar vortex; Fig. 5.3b)
that contributed to the persistence of the wind pattern over Alaska and the rest of North America.
   Spring 2019 (AMJ). Spring (Fig. 5.2b) showed warm temperature anomalies, especially in the
East Siberian Sea extending into the central Arctic where temperatures were 5°C above average
and were associated with offshore winds, as also seen during 2017 and 2018. In April, record high
temperatures occurred at several sites in Scandinavia and in many parts of Iceland. Localized
extreme temperatures off the west coast of Greenland triggered an early and extensive snow melt
season (sections 5e,g). Stations along the Greenland coast, especially the west and northwest
coasts, had near-record high temperature maxima of ~22°C in June due to localized southerly
winds (Fig. 5.3c). Similar high temperatures continued into the summer.
   Summer 2019 (JAS). Unlike summers 2016, 2017, and 2018, summer 2019 returned to the
relatively warm conditions observed in much of the previous decade (Fig. 5.2c). Low surface pres-
sures, particularly over the Canadian Archipelago and Kara Sea, combined with high pressure
over Greenland to advect warm, southerly air into the central Arctic, causing early summer melt-
ing (section 5d). June and especially July were very warm over much of Alaska and the southern
Yukon (+4°C anomalies). At Anchorage, all three months were the warmest on record over the
last 69 years, caused by a persistent ridge of high pressure and southerly winds over the Pacific
Arctic (Fig. 5.3c). Similarly, July was the warmest month on record in Reykjavik, Iceland, since
records began there in 1871 (Trausti Jónsson, Icelandic Met. Office, personal communication).
   Autumn 2019 (OND). Positive temperature anomalies stretched across the central Arctic with
the largest temperature anomalies (+3°C) in the Chukchi Sea and north Greenland (Fig. 5.2d). Like
autumn 2017 and 2018, the sustained warming pattern in the Chukchi Sea during 2019 was as-
sociated with a delayed autumn sea ice freeze-up (section 5d). During autumn 2019, the Northern
Hemisphere jet stream pattern was relatively zonal and well to the south of Arctic regions, with
strong westerly winds over North America and Europe and little penetration of Arctic air toward

 AU G U S T 2 0 2 0 | S t a t e o f t h e C l i m a t e i n 2 0 1 9                                     5. THE ARCTIC   S248
the south. The exception was the location of low 700-hPa geopotential heights displaced from the
North Pole to northern Canada, centered in the Canadian Arctic Archipelago, which created the
strongest high-pressure Greenland blocking episode (above-average mid-tropospheric geopotential
heights and anticyclonic winds over Greenland) in October since 2006 (Fig. 5.3d). This blocking
pattern led to southerly winds advecting relatively warm air to northern Greenland, resulting in
the observed large temperature anomalies.
c. Sea surface temperature —M.-L. Timmermans, Z. Labe, and C. Ladd
Summer sea surface temperatures (SSTs) in the Arctic Ocean are driven mainly by the amount of
incoming solar radiation absorbed by the sea surface. Solar warming of the Arctic surface ocean is
influenced by the distribution of sea ice (with greater warming occurring in ice-free regions), cloud
cover, ocean optical properties, and upper-ocean stratification. In the Barents and Chukchi Seas,
there is an additional source of ocean heat contributed by the advection of warm water from the
North Atlantic and North Pacific Oceans, respectively. Arctic SSTs are an essential indicator of the
Downloaded from http://journals.ametsoc.org/bams/article-pdf/101/8/S239/4988919/bamsd200086.pdf by guest on 04 November 2020
role of the ice–albedo feedback mechanism in any given summer melt season. As the area of sea ice
cover decreases (section 5d), more incoming solar radiation is absorbed by the ocean and, in turn,
the warmer ocean melts more sea ice. In addition, higher SSTs are associated with delayed autumn
freeze-up and increased ocean heat storage throughout the year. Marine ecosystems are influenced
by SST, which affects the timing and development of primary and secondary production cycles, as
well as available habitat for upper-trophic and temperature-sensitive species.
Sea surface temperature data presented in this section are a blend of in situ and satellite mea-
surements from December 1981 to present, taken from the OISSTv2 (Reynolds et al. 2002, 2007).
Compared to purely in situ temperature measurements, the OISSTv2 product explains about 80%
of the variance, with an overall cold bias via its tendency to underestimate SST by −0.02°C (Stroh
et al. 2015). The OISSTv2 product uses a linear relationship with sea ice concentration to infer SST,
with SST constrained to −1.8°C (the freezing point of seawater with a salinity of 33 g kg−1 at the sea
surface) where ice concentration is 100% (Reynolds et al. 2007). Variations in freezing temperature
as a result of variations in sea surface salinity (not accounted for in the algorithm) imply that OIS-
STv2 SSTs under sea ice can be too cool by up to 0.2°C, with the highest errors in the fresher surface
waters of the Canada Basin (see Timmermans and Proshutinsky 2015). August mean SSTs provide
the most appropriate representation of Arctic Ocean summer SSTs, because they are not affected by
the cooling and subsequent sea ice growth that typically takes place in the latter half of September.
The period 1982–2010 is used as a climatological reference mean.
August 2019 mean SSTs ranged from 8° to 9°C in the southern Chukchi and Barents Seas to
approximately 1°C in the interior Arctic Ocean near the mean sea ice edge for that month (Fig.
5.4a). Sea surface temperatures in August 2019 were consistent with sustained mean August SST
Fig. 5.4. (a) Mean SST (°C) in Aug 2019. White
shading is the Aug 2019 mean sea ice extent, and
black contours indicate the 10°C SST isotherm. (b)
Linear SST trend (°C yr−1) for Aug of each year from
1982–2019. The trend is shown only for values that
are statistically significant at the 95% confidence in-
terval; the region is gray otherwise. The yellow line
indicates the median ice edge for Aug 1982–2010.
White shading is the Aug 2019 mean sea ice extent.
(Sources: SST data are from the NOAA OISSTv2; sea
ice extent and ice-edge data are from NOAA /NSIDC
Climate Data Record of Passive Microwave Sea Ice
Concentration, Version 3; Peng et al. 2013; Meier
et al. 2017.)
AU G U S T 2 0 2 0 | S t a t e o f t h e C l i m a t e i n 2 0 1 9 5. THE ARCTIC S249Fig. 5.5. SST anomalies (°C) in (a) Aug 2019 and (b)
Aug 2018 relative to the Aug 1982–2010 mean. The
yellow line indicates the median ice edge for Aug
1982–2010 and white shading indicates the mean
sea ice extent in (a) Aug 2019 and (b) Aug 2018. The
two regions marked by black boxes relate to data
presented in Figs. 5.6 and 5.7. (Sources: SST data are
from the NOAA OISSTv2; sea ice extent and ice-edge
data are from NOAA /NSIDC Climate Data Record of
Passive Microwave Sea Ice Concentration, Version 3;
Peng et al. 2013; Meier et al. 2017.)
Downloaded from http://journals.ametsoc.org/bams/article-pdf/101/8/S239/4988919/bamsd200086.pdf by guest on 04 November 2020
warming trends from 1982 to 2019 over much of
the Arctic Ocean, with statistically significant
(at the 95% confidence interval) linear warming
trends of up to +1°C decade−1 (Fig. 5.4b). A notable
exception was the cooling trend in the northern
Barents Sea region, discussed later.
August 2019 mean SSTs were around 1°–7°C
higher than the 1982–2010 August mean in the
Beaufort, Chukchi, and Laptev Seas and Baf-
fin Bay (Fig. 5.5a). The anomalously high SSTs
in the vicinity of the August 2019 mean sea ice
edge are linked to anomalously low sea ice extent
throughout summer, which allowed for direct
solar heating of the exposed surface waters (Fig.
5.5a). Conversely, the entire Barents Sea region
was marked by anomalously low August 2019
SSTs that were around 0.5°–2°C lower than the
1982–2010 mean. Relative to August 2018, August
2019 SSTs were up to 4°C higher in the Beaufort
Sea and Baffin Bay, while SSTs were a few de-
grees lower in the Barents Sea in August 2019
compared to August 2018 (Fig. 5.5b).
The Chukchi Sea region continues to exhibit
larger warming trends than the Arctic mean
(Figs. 5.6a,b), with August 2019 mean SSTs in
the region being the second highest on record
(Fig. 5.6b). The Bering Sea exhibits a similar
warming trend to the Chukchi Sea in August Fig. 5.6. Area-averaged SST anomalies (°C) for Aug of
(Fig. 5.6c; see Thoman et al. 2019). A marked each year (1982–2019) relative to the 1982–2010 Aug
exception to the prevalent August SST warm- mean for (a) the Arctic Ocean north of 67°N; (b) the
Chukchi Sea region shown by black box in Fig. 5.5; and
ing trends across the Arctic is the cooling trend
(c) the Bering Sea domain bounded by 54°–64°N and
(−0.06 ± 0.03°C yr−1) in the northern Barents Sea 180°–200°E (see Thoman et al. 2019). The dotted lines
(Fig. 5.7a). The statistically significant northern show the linear SST anomaly trends over the period
Barents Sea cooling trend is not observed in all shown. Numbers in the legends correspond to linear
months; annually-averaged northern Barents trends in °C yr−1 (with 95% confidence intervals).
AU G U S T 2 0 2 0 | S t a t e o f t h e C l i m a t e i n 2 0 1 9 5. THE ARCTIC S250Sea SSTs exhibit a warming trend, which has
been attributed to changes in Atlantic water
influence in the region (e.g., see Barton et al.
2018). August mean sea ice extent over the en-
tire Barents Sea domain has been generally
declining over 1982–2019 (Fig. 5.7b). If only
the northern Barents Sea is considered, there
has been little-to-no August sea ice for most
years in the past two decades. The interplay
between sea ice cover, solar absorption, and
lateral ocean heat transport that results in
lower August SSTs in the Barents Sea region
requires further study.
Downloaded from http://journals.ametsoc.org/bams/article-pdf/101/8/S239/4988919/bamsd200086.pdf by guest on 04 November 2020
Fig. 5.7. (a) Area-averaged SST anomalies (°C) for Aug of each
year (1982–2019) relative to the 1982–2010 Aug mean for the
northern Barents Sea region shown by black box in Fig. 5.5.
The dotted line shows the linear SST anomaly trend over the
period shown. Numbers in the legend indicate the statisti-
cally significant linear cooling trend in °C year−1 (with 95%
confidence interval). (b) Aug sea ice extent calculated over the
entire Barents Sea domain. Sea ice extent data are from NSIDC
Sea Ice Index, Version 3 (Fetterer et al. 2017) using a regional
mask introduced by Meier et al. (2007), available at nsidc.org.
d. Sea ice —D. Perovich, W., Meier, M. Tschudi, K. Wood, S. Farrell, S. Hendricks, S. Gerland, L. Kaleschke, R. Ricker,
X. Tian-Kunze, and M. Webster
1) Sea ice extent
Sea ice is an important component of the Arctic system, because it limits the amount of absorbed
solar energy due to its high albedo, acts as a barrier between the underlying ocean and the atmo-
sphere, provides a habitat for biological activity, and serves as a platform for Indigenous community
hunting and travel. The extent of the Arctic sea ice cover varies substantially during the year, with
the end-of-winter ice cover generally being two to three times as large as that at the end of summer.
Sea ice extent has been continuously monitored by passive microwave instruments on satellite
platforms since 1979, providing a consistent long-term perspective on changing coverage over the
last four decades. The sea ice extent estimates used in this report are based on products from the
National Snow and Ice Data Center (NSIDC) Sea Ice Index (Fetterer et al. 2017), derived from NASA’s
gridded sea ice concentration fields (Cavalieri et al. 1996; Maslanik and Stroeve 1999). Other similar
products exist and, while absolute numbers vary, they all show general consistency in trends and
variability (e.g., Meier and Stewart 2019).
March and September are of particular interest in sea ice time series because Arctic sea ice maximum
and minimum extents, respectively, typically occur during these months. Figure 5.8 shows monthly
average ice extents in March and September 2019. The sea ice cover reached a winter maximum extent
of 14.78 million km2 on 13 March 2019. This tied with 2007 as the seventh-lowest maximum extent in the
41-year satellite record and was 5.9% below the 1981–2010 average. The previous four years (2015–18)
are the four lowest years in the record. From year to year, the regions with a reduced winter sea ice
AU G U S T 2 0 2 0 | S t a t e o f t h e C l i m a t e i n 2 0 1 9 5. THE ARCTIC S251cover extent are not consistent. For example, in
March 2019, the winter maximum sea ice extent
in some marginal seas was near normal, such
as in the Sea of Okhotsk, while the Bering Sea
was 70%–80% lower than normal.
The sea ice cover reached a summer mini-
mum extent of 4.15 million km2 on 18 Septem-
ber 2019. This tied with 2007 and 2016 as the
second-lowest extent of the satellite record
and was 2.04 million km 2 (33%) less than
the 1981–2010 average minimum ice extent.
The September minimum ice extent has not
returned to pre-2007 levels; the 13 lowest ex-
tents in the satellite record have all occurred
Downloaded from http://journals.ametsoc.org/bams/article-pdf/101/8/S239/4988919/bamsd200086.pdf by guest on 04 November 2020
in the last 13 years (2007–19). Fig. 5.8. Average monthly sea ice extent in Mar 2019 (left)
Observations of Arctic sea ice extent have and Sep 2019 (right) illustrate the respective monthly winter
maximum and summer minimum extents. The magenta line
shown decreasing trends in all months and
indicates the median ice extents in Mar and Sep, respectively,
virtually all regions (Meier et al. 2014). The during the period 1981–2010. Maps are from NSIDC at http://
September monthly average trend for the en- nsidc.org/data /seaice_index / (Fetterer et al. 2017).
tire Arctic Ocean is now −12.9 ± 2.2% decade−1
relative to the 1981–2010 average (Fig. 5.9), statistically significant at the 99% confidence level.
Trends are smaller during March (−2.7% decade−1), but the decrease is also statistically significant.
In 2019, the seasonal reduction between the March maximum and September minimum extent
was 10.63 million km2, a change of roughly 72%. The difference between maximum and minimum
extents in the satellite record has increased in recent years.
Fig. 5.9. Time series of sea ice extent anomalies in Mar (the
month of maximum ice extent, in black) and Sep (the month of
minimum ice extent, in red). The anomaly value for each year is
the difference (in %) in ice extent relative to the mean values for
the period 1981–2010. The black and red dashed lines are least-
squares linear regression lines. The slopes of these lines indicate
ice losses of −2.7 ± 0.4% and −12.9 ± 2.2% decade−1 in Mar and
Sep, respectively. Both trends are statistically significant at the
99% confidence level. (Source: NSIDC Sea Ice Index [Fetterer et
al. 2017].)
2) Sea ice age
The age of sea ice is also a key descriptor of the state of the sea ice cover. It serves as an indicator for
ice physical properties including snow cover, surface roughness, optical properties, melt pond cover-
age, salinity, and thickness (Tschudi et al. 2016). Older ice tends to be thicker and thus more resilient
to changes in atmospheric and oceanic forcing compared to younger ice. The age of the ice has been
determined using satellite observations and drifting buoy records that track ice parcels over several
years (Maslanik et al. 2011). This method has been used to provide a record of the age of the ice since
the mid-1980s (Tschudi et al. 2019 a,b).
The area of the oldest ice (>4 years old) was a substantial fraction of the winter sea ice cover
within the Arctic Ocean in the mid-1980s (2.52 million km2, 33% of the ice pack in March 1985). In
AU G U S T 2 0 2 0 | S t a t e o f t h e C l i m a t e i n 2 0 1 9 5. THE ARCTIC S252contrast, in 2019 the >4 year-old ice category made
up just a small fraction (90 000 km2, 1.2% in March
2019) of the Arctic Ocean ice pack (Fig. 5.10). First-
year ice now dominates the sea ice cover, compris-
ing ~70% of the March 2019 ice pack, compared to
approximately 35%–50% in the 1980s. Given that
older ice tends to be thicker and stronger, the sea ice
cover has transformed from a strong, thick ice mass
in the 1980s to a younger, more fragile, and thinner
ice mass in recent years. The distribution of ice age
in March 2019 was generally similar to that in March
of the previous year.
3) Chukchi Sea
Downloaded from http://journals.ametsoc.org/bams/article-pdf/101/8/S239/4988919/bamsd200086.pdf by guest on 04 November 2020
The Chukchi Sea has experienced particularly
large changes in sea ice coverage and is a represen-
tative example of extreme sea ice conditions in the
Arctic. The September 2019 Arctic sea ice minimum
extent was characterized by profound sea ice loss
in the Chukchi Sea (Fig. 5.11), due to multiple fac-
tors. First, the Bering Sea had extremely low ice
cover for much of the winter 2019 (see Sidebar 5.1), Fig. 5.10. Late winter sea ice age coverage map for the
which may have acted as a precursor to the sum- week of (a) 12–18 Mar 1985 (b) and 12–18 Mar 2019 (c)
mer Chukchi Sea conditions. In spring 2019, melt Sea ice age percentage within the Arctic Ocean region
onset across the Chukchi Sea occurred 20–35 days (purple shaded region in inset image) for the week of
12–18 Mar 1985 and 2019. (Source: NSIDC [Tschudi et
earlier than the 1981–2010 average. Sea ice began
al. 2019a,b].)
a rapid and accelerating retreat from the south in
early May, leading to a record low sea ice extent in the Chukchi Sea that lasted until early August,
with negative sea ice concentration anomalies of 50%. A combination of anomalously warm air
temperatures (1°–5°C above the 1981–2010 average) and southerly winds promoted this precipitous
loss of ice (section 5b). As the sea ice retreated northward, exposed open water areas warmed,
leading to anomalous SSTs in summer 2019 greater than 5°C above average (section 5c).
The dearth of sea ice continued into the autumn season, accompanied by anomalously warm air
temperatures of 4° to 5°C above the 1981–2010 average during October and November 2019 (section 5b).
The warm air temperatures were partly due to very warm ocean waters, with SSTs remaining at 5°C or
more above average in the Chukchi Sea well into November. The Chukchi Sea did not fully freeze over
until 24 December, about a month later than average, with only 2007 and 2016 showing similarly late
freeze-up dates since modern satellite observations began in 1979.
Fig. 5.11. Time series of 2019 sea ice extent in the Chukchi Sea
(see inset) through 12 Nov (red line) compared to the previous
year (2018; yellow line); the record minimum year (2012, blue
line), and the climatological median (1981–2010; black line),
derived from satellite passive-microwave data. The gray shaded
areas show the maximum range of variability of sea ice extent
for the first decade of the satellite era (1979–88) and the most
recent decade (2008–17), illustrating the long-term change in
sea ice extent over the entire period since 1979. (Source: NSIDC
Sea Ice Index, version 3 [Fetterer et al. 2017].)
AU G U S T 2 0 2 0 | S t a t e o f t h e C l i m a t e i n 2 0 1 9 5. THE ARCTIC S253SIDEBAR 5.1: Shifting fish distributions in the Bering Sea—J. M. MARSH, F. J. MUETER,
J. T. THORSON, L. BRITT, AND S. ZADOR
The eastern Bering Sea is a highly productive ecosystem that On the Bering Sea shelf, the summer distribution of demersal
supports many subsistence and commercial fisheries. These fishes and invertebrates is tied to the extent of the cold pool
commercial fisheries are some of the most valuable in the world, (bottom water temperatures < 2°C). The cold pool forms during
with annual wholesale revenue exceeding $1 billion (U.S. dol- autumn freeze-up when cold dense water sinks to the seafloor
lars; Fissel et al. 2019). To support sustainable management and where it persists throughout the following summer, even as the
assess overall ecosystem health, yearly summer bottom-trawl surface waters undergo seasonal warming. The size of the cold
surveys in the southeastern Bering Sea have monitored the pool is dependent on the extent of sea ice in the Bering Sea
abundance and biomass of demersal (living on the seafloor) during the preceding winter (Wyllie-Echeverria and Wooster
fishes and invertebrates since 1982 (NPFMC 2018). To study 1998), and it can serve as a thermal barrier to boreal (southern
impacts of the loss of seasonal sea ice on the Bering Sea eco- Bering Sea) fish expansion into the Arctic. Until recently, it was
Downloaded from http://journals.ametsoc.org/bams/article-pdf/101/8/S239/4988919/bamsd200086.pdf by guest on 04 November 2020
system, the surveys were expanded in 2010 and 2017–19 to expected that sea ice would continue to persist throughout
include the northern Bering Sea, a transitional zone between the winter over the shallow northern Bering Sea and southern
the North Pacific Ocean and the Arctic Chukchi Sea.
On the Bering Sea shelf, the summer distribution
of demersal fishes and invertebrates is tied to the
extent of the cold pool (bottom water temperatures
< 2°C). The cold pool forms during autumn freeze-up
when cold dense water sinks to the seafloor where it
persists throughout the following summer, even as
the surface waters undergo seasonal warming. The
size of the cold pool is dependent on the extent of
sea ice in the Bering Sea during the preceding winter
(Wyllie-Echeverria and Wooster 1998), and it can
serve as a thermal barrier to boreal (southern Bering
Sea) fish expansion into the Arctic. Until recently, it
was expected that sea ice would continue to persist
throughout the winter over the shallow northern
Bering Sea and southern Chukchi Sea shelf, enabling
the formation of the cold pool (Stabeno et al. 2012).
However, latent heat in the water column from the
The eastern Bering Sea is a highly productive ecosys-
tem that supports many subsistence and commercial
fisheries. These commercial fisheries are some of the
most valuable in the world, with annual wholesale
revenue exceeding $1 billion (U.S. dollars; Fissel et al.
2019). To support sustainable management and assess
overall ecosystem health, yearly summer bottom-trawl Fig. SB5.1. Distribution of major species assemblages identified in the
surveys in the southeastern Bering Sea have monitored eastern Bering Sea during the summers of 2010, 2017, 2018, and 2019,
the abundance and biomass of demersal (living on the including three boreal assemblages on the southern inner shelf (red),
seafloor) fishes and invertebrates since 1982 (NPFMC middle shelf (orange), and outer shelf/slope region (yellow), as well
2018). To study impacts of the loss of seasonal sea as a mixed Norton Sound (light blue) and an Arctic /northern shelf
ice on the Bering Sea ecosystem, the surveys were assemblage (dark blue). See Thorson et al. (2019) for a description
of clustering methods used on catch-per-unit-effort (kg ha –1) of 44
expanded in 2010 and 2017–19 to include the northern common species caught in 1983 hauls. The contour (black) denotes
Bering Sea, a transitional zone between the North the 2°C isotherm of bottom water temperature, which marks the
Pacific Ocean and the Arctic Chukchi Sea. boundary of the cold pool.
AU G U S T 2 0 2 0 | S t a t e o f t h e C l i m a t e i n 2 0 1 9 5. THE ARCTIC S254Chukchi Sea shelf, enabling the formation of the cold pool gracilis), which are key indicator species for the northern shelf
(Stabeno et al. 2012). However, latent heat in the water column (Arctic) and Norton Sound assemblages, respectively. Both
from the warm conditions of summer 2016, combined with less walleye pollock and Pacific cod shifted northward between
sea ice formation in the 2016/17 winter (Thoman et al. 2020), bottom-trawl surveys conducted in 2010 and repeated in 2017,
resulted in an unusually narrow cold pool on the eastern Ber- 2018, and 2019. Hotspots of increased density in the later
ing Sea shelf during summer 2017. Sea ice extent was further years are apparent for Pacific cod south of St. Lawrence Island
reduced in the 2017/18 and 2018/19 winters with the lowest (63°N, 170°W) and for pollock south of the Bering Strait (64°N,
coverage on record for February and March, respectively (75%) in the size of center of population for these commercially important species
the cold pool during the summers of 2018 and 2019 (Fig. SB5.1). (Stevenson and Lauth 2019). These results also show that the
These changes in the physical environment are expected to areas with the greatest changes vary from species to species,
Downloaded from http://journals.ametsoc.org/bams/article-pdf/101/8/S239/4988919/bamsd200086.pdf by guest on 04 November 2020
affect the distribution of fish and invertebrate communities. In and that northward shifts in boreal species can occur even
general, fish populations are expected to remain within their while their densities remain high within the southern portion of
preferred thermal conditions by shifting their spatial distribu- their range. A similar “borealization” of the fish community has
tions to track changes in ocean temperatures (Pinsky et al. occurred in the Barents Sea, as increasing water temperatures
2013). Therefore, within a warming marine environment, boreal and retreating ice cover have opened new feeding habitats for
fish populations in the Bering Sea are expected to expand north- Atlantic cod (Gadus morhua) and haddock (Melanogrammus
ward into new areas (Hollowed et al. 2013), while cold-adapted aeglefinus), two commercially important cod species (Fossheim
species may contract. et al. 2015; Thorson et al. 2019).
We compare the spatial distribution of five assemblages Compared to these boreal species, Arctic taxa tend to be
(groups of co-occurring species) in the Bering Sea during the more sensitive to habitat changes. Arctic cod in particular can
2017–19 warm period, relative to the cooler conditions of 2010 serve as a sentinel species that responds quickly to changes
(Fig. SB5.1). These assemblages represent three boreal fish in water temperature and sea ice extent (Alabia et al. 2018;
communities from the outer, middle, and inner shelf, a mixed Marsh and Mueter 2019). Correspondingly, we saw roughly
community in Norton Sound, and an Arctic community on the 92% and 78% reductions in the area occupied by Arctic cod
northern shelf. Following a drastic reduction in the size of the when comparing 2010 to 2018 and 2019, respectively (Figs.
cold pool in 2018 and 2019, the middle-shelf (boreal) assem- SB5.2i–l), while saffron cod, an indicator for the Norton Sound
blage expanded northward while the northern shelf (Arctic) assemblage, has expanded westward and southward along the
assemblage retracted. At the same time, the inner shelf and coast (Figs. SB5.2m–p).
Norton Sound assemblages expanded offshore in 2018 and The expansion of nearshore “Norton Sound” and southern
2019, coinciding with warmer coastal water temperatures, shelf species into the northern Bering Sea is likely to have
particularly in 2019. These community-level shifts, which reflect profound effects from predation on the benthic ecology of the
changes in the distribution of individual species, result in a large northern Bering Sea—effects that are yet undocumented. The
portion of the shelf transitioning from an Arctic community, observed high densities of fish in the Bering Strait suggest that
dominated by relatively smaller and less abundant species boreal species may shift their summer feeding migrations into
(e.g., Arctic cod; Boregadus saida), to a community dominated the Chukchi Sea, which has also seen large decreases in summer
by larger and more abundant boreal species (e.g., Pacific cod; and autumn sea ice extent (section 5d). Such potential move-
Gadus macrocephalus). ment northward into the Chukchi Sea highlights the need for
Changing distributions are also illustrated by mapping the additional fisheries surveys north of the Bering Strait, as well
density (biomass per unit area) of four individual gadid (cod as continued surveys in the Bering Strait region and a synthesis
family) species in the Bering Sea (Fig. SB5.2). We selected of data from both the United States and Russian waters. In this
two boreal species that support high-value commercial fisher- report, we have presented only a limited four years of survey
ies, walleye pollock (Gadus chalcogrammus) and Pacific cod, data from the U.S. Bering Sea.
and two smaller gadids, Arctic cod and saffron cod (Eleginus
AU G U S T 2 0 2 0 | S t a t e o f t h e C l i m a t e i n 2 0 1 9 5. THE ARCTIC S255You can also read