DIVERSIFIED DIVERSIFIED TECHNOLOGY INDUSTRIALS MINING REITS SPECIAL SITUATIONS - Volume 3 DECEMBER 2020
←
→
Page content transcription
If your browser does not render page correctly, please read the page content below

Volume 3 DECEMBER 2020

DIVERSIFIED

DIVERSIFIED TECHNOLOGY

INDUSTRIALS

MINING

REITS

SPECIAL SITUATIONS
INSTITUTIONAL EQUITY

2021 LBS Top Picks
Our Annual Institutional Equity Preferred Picks report summarizes our best investment ideas for 2021 as well as our outlook for each
sector in the Laurentian Bank Securities coverage universe.
Year to date, LBS’ 2020 Preferred Picks returned 13.5% (equal-weighted), outperforming the TSX Composite and Small Cap
indices by 7.1% and 4.2%, respectively, aided by a sharp recovery post-March and our exit from the Oil & Gas (O&G) sector in May.
Our picks for 2020 were Altius Minerals Corporation (ALS-T), Argonaut Gold Inc. (AR-T), Aurora Cannabis Inc. (ACB-T), Boyd Group
Income Fund (BYD-T), Extendicare Inc. (EXE-T), Marathon Gold Corporation (MOZ-T), PetroShale Inc. (PSH-V), TECSYS Inc. (TCS-
T), TFI International Inc. (TFII-T) and Whitecap Resources Inc. (WCP-T). Among these, supply chain management (SCM) solution
provider TECSYS generated the highest return (YTD total return of 118.2%) particularly buoyed by the increasing importance of SCM
in a pandemic-induced environment, followed by Marathon Gold, which returned 65.8% YTD and strongly outperformed the S&P TSX
Global Gold Index, which returned 19.5% over the comparable period. Our coverage universe returned 19.3%, generating a
positive alpha of 10.1% vs. the TSX Small Cap index. Our Preferred Picks and coverage universe outperformance relative to the Small
Cap index demonstrates our continued ability to build a basket of fundamentally strong and high-potential early stage companies. However,
our Preferred Picks underperformed against our coverage universe by 5.9%, particularly due to our negative O&G exposure in 1H/20.

As we enter 2021 with the world still reeling from the effects of COVID-19, we are witnessing a “survival of the fittest”, where
businesses focusing on fundamentals and generating efficiencies are potentially witnessing further growth opportunities ahead as
laggards lose out. Similarly, our basket of Preferred Picks is generally defined by companies with sound business models, healthy
balance sheets (with M&A consolidation remaining a key catalyst) and positive organic growth.

   Sector                                            Analyst            Company                                     Ticker   Rating   Risk Rating Mkt Cap (M)       Price       Target     Div. Yield         1-yr RoR
   Diversified                                       Nauman Satti       NFI Group Inc.                              NFI-T     Buy        High       $1,442         $23.07       $26.00       3.7%               16.4%
   Diversified Technology                            Nick Agostino      mdf commerce inc.                          MDF-T      Buy        High        $241          $10.60       $13.25       0.0%               25.0%
   Industrials (Transportation and Infrastruture)    Mona Nazir         SNC-Lavalin Group Inc.                     SNC-T      Buy       Medium      $3,983         $22.69       $31.50       0.4%               39.2%
   Mining (Gold & Services)                          Ryan Hanley        Major Drilling Group International Inc.     MDI-T     Buy        High        $518           $6.42        $9.00       0.0%               40.2%
   Mining (Gold)                                     Barry Allan        Marathon Gold Corporation                  MOZ-T      Buy        High        $586           $2.82        $5.75       0.0%              103.9%
   Mining (Base & Precious Metals)                   Jacques Wortman    Galway Metals Inc.                         GWM-T      Buy        High        $187           $1.12        $2.25       0.0%              100.9%
   Real Estate Investment Trusts                     Yashwant Sankpal   InterRent REIT                            IIP.UN-T    Buy       Medium      $1,960         $13.85       $17.25       2.4%               26.9%
   Special Situations                                Furaz Ahmad        Converge Technology Solutions               CTS-V     Buy       Medium       $490           $3.86        $5.75       0.0%               49.0%

   T - Toronto Stock Ex change, V - TSX Venture Stock Ex change                                                                                  Pricing as of December 10, 2020 unless otherwise indicated
   Source: Thomson Reuters Eikon, LBS

Cameron Baker, CFA M.IM.| Head of Equities

DECEMBER 2020                                                                                            i
INSTITUTIONAL EQUITY

DIVERSIFIED — Nauman Satti ................................................................................................................................................................... 2
NFI Group Inc. (NFI-T – $23.07)

DIVERSIFIED TECHNOLOGY — Nick Agostino........................................................................................................................................ 4
mdf Commerce Inc. (MDF-T – $10.60)

GOLD — Barry Allan .................................................................................................................................................................................. 6
Marathon Gold Corporation (MOZ-T – $2.82)

GOLD & SERVICES — Ryan Hanley.......................................................................................................................................................... 7
Major Drilling Group International Inc. (MDI-T – $6.42)

BASE & PRECIOUS METALS — Jacques Wortman ................................................................................................................................. 8
Galway Metals Inc. (GWM-V – $1.12)

INDUSTRIALS — Mona Nazir ................................................................................................................................................................... 10
SNC-Lavalin Group Inc. (SNC-T – $22.69)

REAL ESTATE — Yashwant Sankpal....................................................................................................................................................... 12
InterRent REIT (IIP.UN-T – $13.85)

SPECIAL SITUATIONS — Furaz Ahmad ................................................................................................................................................. 14
Converge Technology Solutions (CTS-V – $3.86)

Appendix I — Coverage Universe ......................................................................................................................................................... 15

Appendix II — Important Disclosures................................................................................................................................................... 16

All pricing as of December 10, 2020 unless otherwise indicated.

DECEMBER 2020                                                                               ii
INSTITUTIONAL EQUITY Nauman Satti, MBA, CFA | DIVERSIFIED
DIVERSIFIED
Nauman Satti, MBA, CFA | SattiN@lb-securities.ca 647 252-5602
Our preferred pick is NFI Group Inc. (NFI-T). NFI is well-positioned to benefit from a secular shift towards electric vehicles from its
zero-emission bus & coach offerings. Unlike most other EV plays that have a greater risk of execution, NFI offers downside protection
from: 1) its well-established client relationships, and 2) its platform-agnostic offering of traditional internal combustion engine (ICE)
vehicles alongside EVs. We believe NFI will continue to benefit from new policy initiatives around carbon-emissions which should
accelerate the replacement cycle for transit buses. Furthermore, in our view, the company’s EV opportunity is not fully reflected in the
stock price.
Trend is Your Friend: Favorable Policy Initiatives for the Sector
We believe the entire supply chain involved in electric vehicle manufacturing should benefit from policy changes that are happening at
government and shareholder levels. We highlight some of the key trends in this market:
Reducing carbon-emission top of political agenda. Although buying decisions for transit buses and coaches are driven by “total
cost of ownership”, increasingly the focus is shifting to “benefits to the environment”, which should drive legislation that will require
zero-emission vehicles (ZEV) even at higher costs. We believe this has now become an important factor for political constituents
which are translating to policy changes. In the U.S., 14 States have set a target for ZEV to be 30% of all new vehicle sales by 2030
and all new sales to be ZEV by 2025.
Government coffers incentivizing the change. In the U.S., the government extended its previous US$25B CARES Act transit
funding by another year to Dec. 2020, while introducing a draft legislation for a new “Invest in America Act” with US$494B of
infrastructure spending, tilted towards green initiatives. In Canada, the Infrastructure Bank’s growth plan has $1.5B of financing
allocated to the adoption of electric buses and its related infrastructure. The Throne speech by the government also pushed for
green initiatives and expects to bring forward legislation for Canada’s 2030 climate goals with the ultimate goal of net-zero
emissions by 2050. Furthermore, the Liberal party has pledged to work with provinces to fund 5,000 new zero-emission buses over
the next five years, signaling a favorable policy for electric buses. In the U.K, the government has introduced a £5.1B funding plan
for a National Bus Strategy. We believe these incentives should result in faster adoption of EVs.
Shareholders ask for ESG. Recent market commentary especially from the largest money managers such as Black Rock
highlights that a large number of investors are increasingly focused on climate change. We believe companies such as NFI which
are helping in the transition should gather more attention from institutional flow of money.
Apart from EV players that have had a successful SPAC offering — such as Arrival (NASDAQ: NERV), Fisker (NYSE: Fisker),
Lordstown Motors (NASDAQ: RIDE), Nikola (NASDAQ: NKLA), Green Power Motor Company (Canadian Ventures Exchange: GPV-V),
and Lion Electric (NYSE: LEV) — we highlight below some of the industries/companies within the supply chain that will
contemporaneously benefit from such a secular shift.
Auto-part manufacturers. Firms such as Exro Technologies (Canadian Venture Exchange: EXRO-V) that provides inverter to
electric vehicles or Exco Technologies (TSX: XTC) that provides innovative technologies for passenger vehicles should benefit
from an acceleration in transition to electric vehicles.
Clean energy infrastructure. One of the bottlenecks in the eco-system of electric vehicles remains charging and fuel
infrastructure. NFI has introduced “Infrastructure Solutions” alongside its EV offerings to help transit agencies but we believe white
space remains for battery, hydrogen, CNG, and RNG charging infrastructure which is being explored by some new players such as
Greenlane Renewables (Canadian Venture Exchange: GRN-V).
.
DECEMBER 2020 1INSTITUTIONAL EQUITY Nauman Satti, MBA, CFA | DIVERSIFIED
NFI Group Inc.
(NFI-T – $23.07)
Buy – Target Price: $26.00
Company Profile A Seat at the EV Table
NFI Group is a manufacturer of transit buses and motor coaches,
based in Winnipeg, Manitoba, Canada. The company has also Investment thesis and rationale — Downside protected
ventured into the electric bus market with its products being used
by multiple transit agencies. NFI Group also provides aftermarket
Despite the recent stock run-up (up 32% since our initiation in Sept.‘20), we
services to the bus and motor coach industry. The company remain bullish on the story based on NFI’s strong position within the transit
operates under the following brands: New Flyer, Alexander Dennis, bus market, secular tailwinds for its EV offerings, and potential cost
ARBOC, MCI, NFI Parts, Carfair, and Plaxton. synergies and geographic expansion opportunities from its Alexander
Dennis (ADL) acquisition. Meanwhile, the downside remains protected with
US$4.5B in backlog, which reflects 12+ months of revenue.
Key catalysts — Potential for further multiple re-rating
We highlight below some of the factors that can trigger a multiple re-rating
for NFI in the short- and long-term:
A potential stimulus package in the near-term should provide fiscal support
to federal agencies that are the single largest clients for NFI Group.
In the medium- to long-term, the focus on zero-emission should
Source: BigCharts.com increase from the new government in the U.S., which should
accelerate the replacement cycle of transit buses.
Market and Company Data
Ticker NFI-T Shares O/S (M) 62.5
We believe that NFI’s electric buses opportunity is not fully reflected in
Rating Buy Market Cap (M) C$1,442 its stock price, especially when compared to the valuations of other
Risk High Float O/S (M) 54.6% electric truck & bus manufacturers such as Lion Electric (recent SPAC
Price C$23.07 Float Value (M) C$787 values it at US$1.9B), with limited to no revenues. A potential
1-Yr Target C$26.00 Avg Daily Volume 325,979 realization of NFI’s undervalued EV offering can trigger a further
Dividend 3.7% Enterprise Value (M) C$3,235
multiple re-rating.
1-Yr ROR 16.4%
52 Wk High-Low C$9.12 - C$33.94 Year-End Dec Valuation — Undervalued relative to peers
BVPS $9.63 Net Debt/Cap 65%
Valuation 8.0x EV/EBITDA (2022) Next Reporting Mar 2021 Our valuation of NFI is based on 8.0x 2022 EV/EBITDA, which is in-line
Adj. EPS (FD)
with traditional auto manufacturers but at a substantial discount to specialty
Q1 Q2 Q3 Q4 Annual P/E
2018A $0.57 A $0.82 A $0.57 A $0.70 A $2.67 6.7x
EV manufacturers such as BYD Company (23x 2022 EBITDA) and
2019A $0.26 A $0.42 A $0.24 A $0.72 A $1.64 10.8x GreenPower Motor (54x 2022 EBITDA). We believe that as EV
2020E ($0.01) A ($0.97) A $0.09 A $0.18 E ($0.71) N/A contributions in NFI’s backlog increase from the current ~10%, NFI stock
2021E $0.15 E $0.01 E $0.18 E $0.21 E $0.55 32.1x can see further multiple re-rating, which is why we remain bullish despite
2022E $0.28 E $0.44 E $0.44 E $0.93 E $2.10 8.5x
the recent stock rally. The company will hold its virtual investor day on
Adjusted EBITDA ($M)
Q1 Q2 Q3 Q4 Annual EV/EBITDA
January 11, 2021, following which we will revisit our investment thesis.
2018A $74 A $91 A $70 A $80 A $315 7.9x
Key risks
2019A $60 A $81 A $77 A $104 A $322 7.7x
2020E $56 A ($24) A $61 A $63 E $155 16.0x We highlight three key risks to our investment thesis: 1) lack of fiscal
2021E $61 E $44 E $58 E $60 E $224 11.1x
support by governments towards transit agencies can increase the
2022E $65 E $76 E $74 E $118 E $333 7.5x
*All numbers in US, unless otherwise stated replacement cycle for transit buses; 2) NFI is undertaking a cost-saving
Source: Company reports; Eikon; LBS. initiative plan of US$65M+ in savings by 2023; an unsuccessful execution
can lead to cost overruns and potential margin contraction; and 3) delays in
reducing the leverage can hamper growth; Q3/20 covenant ratio at 4.17x.
DECEMBER 2020 2INSTITUTIONAL EQUITY Nick Agostino, CFA, MBA, P.ENG. | DIVERSIFIED TECHNOLOGY DIVERSIFIED TECHNOLOGY Nick Agostino, MBA, CFA, P.Eng. | AgostinoN@lb-securities.ca 416 865-5967 Our preferred pick is mdf Commerce Inc. (MDF-T). In picking MDF we note strong underlying fundamentals with e-commerce usage in the retail market increasing from 16% pre-COVID to ~30% ending 2020, with industry experts suggesting a 60% adoption over the next years. We see this momentum as a tailwind for MDF’s Unified Commerce division and model in growing contributions from its top- 10-global-grocer win, Aldi, announced on December 14, 2020, along with follow-on wins in this market niche. We look for MDF to grow its market share in Strategic Sourcing both through organic growth fueled by increased government spending and through M&A in the U.S. market. Adding to this, we anticipate a recovery in retail omni-channel spending through the course of 2021 as vaccinations are completed, benefitting MDF’s Supply Chain solutions. We expect the improved financial performance driven by the above along with on-going M&A and new partner announcements to fuel further multiple expansion, as we expect the current discount with MDF trading at 2.6x NTM EV/Sales vs. peers at 3.5x to close over time upon successful execution. MDF remains well-funded with >$36M in net cash, has a renewed credit facility and de-levered balance sheet to carry out its M&A strategy, and has strong revenue visibility with >$64M in ARR along with solid double-digit YoY MRR growth. Cloud Multiples to Normalize while the Pandemic-Driven Acceleration Remains Sticky In 2020, the onslaught of the pandemic allowed many digital assets (including cloud-based, SaaS models) to prove their worth as they helped facilitate work-from-home requirements and saw the world become much more reliant on “e-markets” which included strong adoption in e-health (WELL Health Technologies Corp.: WELL-T), e-commerce (mdf Commerce: MDF-T), e-learning (Docebo Inc.: DCBO-T) as well as the underlying assets to help facilitate the flow of goods on a global scale (Kinaxis Inc.: KXS-T; TECSYS Inc.: TCS-T; Descartes Systems Group Inc.: DSG-T). All of these companies benefitted from a multiple expansion to reflect the earnings growth through and post the pandemic, leading to strong double-digit share price appreciation in 2020. While the pandemic shone a spotlight on these companies, and in some cases accelerated marketplace adoption (healthcare, omni-channel, learning), we believe these higher adoption levels are sticky as the service offered becomes an essential fabric of today’s digital age. That said, with vaccines rolling out through 2021, we expect multiples for many of these companies to return to normalized levels and have reflected this in our valuation multiples. M&A Remained Resilient in 2020 and Should Pick Up in 2021 M&A has been at the forefront of the technology industry over the last few years, fueled by favourable stock valuations, growth multiple expectations and business-scale aspirations, despite the pandemic impact the overall activity has remained steadfast with 145 1H/20 deals, flat vs. the 150 deals in the 2H/19, but saw a pick-up in activity in Q3/20 on re-opening economies. We expect M&A to be an ongoing theme in our coverage universe with the likes of WELL-T, and an anticipated acceleration of activity from DSG-T and MDF-T as they both seek out strategic opportunities, and possibly activity from TCS-T. We also expect 5N Plus Inc. (VNP-T) to be more activity in the deal-making market, in particular through joint venture partnerships. In some cases the pandemic impacted deal activity with some companies, hindering their ability to conduct requisite in-person due diligence, thereby slowing or nullifying their activity in 2020; we highlight Savaria Inc. (SIS-T) as a good example. With a vaccine rollout underway, we look for M&A activity to pick up with these companies. In all cases we note these companies have strengthened their balance sheets in 2020, allowing them to be more active in 2021. Cash Flow Growth to Continue, but at a Slower Pace During 2020, solid organic growth and on-going acquisition synergies allowed companies in our coverage universe to post strong double-digit YoY CF and FCF growth, the exceptions being WELL and DCBO that are in hyper-growth mode. For 2021, we look for strong FCF growth (ex. w/c) to continue led by KXS-T (52%), TCS-T (21%), VNP-T (14%), SIS-T (8%) and DSG-T (1%). We expect both WELL-T and DCBO-T to move into positive territory on both EBITDA and FCF generation through 2021 while continuing to aggressively invest in growth. Similarly we expect MDF-T to be roughly flat YoY as it increases its near-term opex to drive organic growth in its operations and accelerate its FCF growth in the subsequent years as it gains scale leverage. DECEMBER 2020 3
INSTITUTIONAL EQUITY                                                                                            Nick Agostino, CFA, MBA, P.ENG. | DIVERSIFIED TECHNOLOGY

 mdf Commerce Inc.
 (MDF-T – $10.60)
 Buy – Target Price: $13.25

 Company Profile                                                                     2020 Was a Good Year for MDF; 2021 Should be Better
 mdf Commerce Inc. is a Montreal-based operator of e-business
 networks and a provider of e-commerce solutions. Through                            Investment thesis and rationale — Superior growth
 numerous separately branded platforms, the company offers
 procurement/publishing solutions (targeting governments and
                                                                                     With its focus on B2B (~82% of total sales), combining Unified Commerce (UC)
 private corporations), online marketplaces in many market verticals                 and Strategic Sourcing, MDF targets a US$20.4B market growing at a
 (automotive, IT/telecom, electronics, wine and spirits, and jewelry),               combined ~11.5% CAGR over the next 3-5 years. 2020 was a transformative
 as well as SaaS business solutions. The company employs 520                         year with MDF strengthening its management team, revamping platforms,
 individuals situated in nine locations, namely in North America.                    recapitalizing its balance sheet ($88M of liquidity), expanding its N.A. footprint
                                                                                     and winning a competitive RFP in the U.K. to establish a European beachhead.
                                                                                     With the pandemic as a tailwind, MDF enters 2021 with 14% quarterly sales
                                                                                     growth, 11% MRR growth, a 76% recurring revenue stream with $64M in ARR.
                                                                                     The company is also currently on-boarding two large wins, OTT HydroMet and
                                                                                     a top 10 global European-based grocer, Aldi U.K. and Ireland, whose sizable
                                                                                     contributions to MRR should start flowing through 2021.
                                                                                     Key catalysts — More deals and partnerships
                                                                                     Deals & Partnerships. In 2020, notable wins included NHS London
                                                                                     Procurement (U.K.), The Canning Group (U.S.), and the Government of
 Source: BigCharts.com                                                               Newfoundland & Labrador. In UC, it won OTT HydroMet and a top-10
                                                                                     global grocer, Aldi U.K. and Ireland. We expect further wins in 2021 —
 Market and Company Data                                                             especially in e-commerce — and additions to its partnership list (includes
  Ticker              MDF-T                          Shares O/S (M)          22.7    Logic, KPMG, Enavate). New/existing partners should aid sales growth.
  Rating              Buy                            Market Cap (M)        $241.1
  Risk                High                             Float O/S (M)         19.3    M&A. Building off two successful transactions since new CEO Luc
  Price               $10.60                         Float Value (M)       $204.9    Filiatreault took the reins in Sept. 2019 (kCentric and Vendor Registry) and
  1-Yr Target         $13.25                   Avg Daily Volume (K)          91.5
  Dividend            $0.00                     Enterprise Value (M)       $204.5    ongoing solid contributions from its earlier acquisition of Orckestra, we look
  1-Yr ROR            25.0%                         Control Blocks:                  for MDF to pursue more M&A in 2021 to bolt-on to its Strategic Sourcing
  52 Wk High-Low      $12.00 - $2.22                    Mgmt. % Dir         15.0%
  Valuation           2.75x EV/Sales (F2022/23E)          Institutional     36.0%
                                                                                     platform, primarily targeting assets in the U.S., or possibly Europe (U.K.).
  BVPS                $5.96                            Net Debt/Cap        -31.6%
  Year End            Mar. 31                        Next Reporting        Mar-21    Valuation — Trades below peers
  Sales                                                                              We value MDF shares based on 2.75x F2022/23 Sales. On a NTM EV/Sales,
               Q1         Q2         Q3           Q4          Annual      EV/Sales
  F2019A      $21.1   A $20.3     A $20.9      A $20.8      A $83.1         2.5x
                                                                                     MDF trades at 2.6x, a discount to the peer blend of 3.5x. In Q2/F21, MDF
  F2020A      $20.2   A $18.2     A $18.1      A $18.3      A $74.9         2.7x     posted adjusted organic growth (excl. B2C eMarketplace assets) of 13% vs.
  F2021E      $20.5   A $20.8     A $21.1        $21.8         $84.1        2.4x     peer forward sales growth of 15%; similarly MDF posted LTM EBITDA margins
  F2022E                                                       $90.0        2.3x
  Adjusted EBITDA ($M)
                                                                                     of 7.2% vs. peers at 10.6%. We see further multiple expansion (to ~4x, aligning
              Q1       Q2               Q3         Q4         Annual EV/EBITDA       with peers) as MDF becomes a 40% sales growth + EBITDA margin performer.
  F2019A     $5.3 A $6.7          A    $5.5    A $5.0       A $22.6       9.0x
  F2020A     $4.1 A $4.1          A    $2.2    A ($0.9)     A $9.6       21.4x       Key risks
  F2021E     $1.9 A $2.4          A    $2.1       $2.1         $8.5      24.0x
  F2022E                                                       $9.8      20.8x       Economy. MDF relies on transactional activity within the omni-channel/e-
  Source: Company reports; ThomsonONE; LBS estimates.                                commerce, retail and government procurement markets among other
 Pricing as of Dec. 14, 2020 intra-day.                                              things, placing importance on a healthy economic environment.
                                                                                     M&A. As MDF targets sales of $250M over the next 4+ years, M&A will be
                                                                                     a key contributor to this growth. As such, integration, accretion and market
                                                                                     acceptance will be key factors in supporting its consolidation strategy.

DECEMBER 2020                                                                           4
INSTITUTIONAL EQUITY Barry Allan, MBA | MINING MINING Barry Allan, MBA | AllanB@lb-securities.ca 416 865-5798 Ryan Hanley | HanleyR@lb-securities.ca 647 252-5607 Jacques Wortman, MBA | WortmanJ@lb-securities.ca 416 941-7701 PRECIOUS METALS Our preferred development pick is Marathon Gold Corp. (MOZ-T). Marathon is currently advancing its Valentine Gold project in west- central Newfoundland toward production. Given an unusually-high degree of asset quality, as well as its significant size, if the market does not recognize the underlying value of the project as near-term milestones are achieved, an established gold producer should. Our preferred exploration pick is Galway Metals Inc. (GWM-V). A key thesis developed in 2020 was that the Jubilee, Richard, and George Murphy zones were part of one large mineralized system. An aggressive 2021 drill program is expected to further test these targets, culminating with a resource update. Given the exploration potential at Clarence Stream, GWM is a Preferred Pick for 2021. MINING SERVICES Our preferred mining services pick is Major Drilling Group International Inc. (MDI-T). Given our expectation that exploration spending should continue to increase due to depressed resource bases and increased levels of cash flow generation, along with the number & size of equity financings completed by exploration companies, we are adding MDI to our list of 2021 preferred picks. With its strong balance sheet & experienced management team, MDI remains well positioned to take advantage of increasing levels of demand for drilling services. Precious Metals Have Been a Good Place to Be in 2020, Which Should Remain the Case Through 2021 2020 was a good year for bullion prices, and as a result, the entire sector enjoyed better valuations year-over-year as the gold price sought new highs. For 2021, we expect strong precious metal prices to prevail while the broader economy continues to struggle with the impact of a pandemic and the related low-interest rate environment which looks to further stimulate a recovery. Strong Cash Flow Generation to Continue A stronger gold price resulted in many non-producing companies being able to raise a significant amount of capital in order to fund exploration and development plans, while existing gold producers were able to generate record levels of free cash flow — all of which should combine to form a perfect storm of exploration activity in 2021, along with an opportunity for increased levels of M&A activity. Good Capital Markets and Strong Cash Flow Generation is Putting Particular Pressure on Mining Services Growing levels of cash flow generated by mining companies and an increase in the number & size of equity financings completed by exploration companies have both led to a rebound in exploration spending, particularly across Canada & the US. Unfortunately COVID- 19 related restrictions resulted in some exploration programs being deferred in early 2020, and potentially through early 2021; however the emergence of a vaccine and what we expect will be loosening restrictions over the year ahead should lead to more aggressive exploration campaigns, particularly given the depressed reserve bases of both precious and base metal producers. 2020 a Strong Year for the Iron Ore Market, Despite COVID-19, and Ends with a Market ‘Squeeze’ The P62 iron ore price is ending 2020 at 8-year highs, with a strong uptrend over the course of H2/20 coming as a result of continued strong demand for steel products in China, especially rebar. With Vale’s new production guidance, Australian ports unable to complete maintenance activities until Q1/21, and concerns about additional cyclones, potential supply-side constraints contributed to the market squeeze and peak iron ore prices. The Base Metal Complex has also Performed Very Well in 2020, Led by Copper Higher base metal prices are associated with optimism regarding a global post-pandemic recovery. Copper recently reached a seven (7) year high, leading the entire base metal complex higher. That being said, we believe that current base metal prices are baking in a significant premium and could potentially pull back somewhat over the course of 2021 in order to better reflect underlying market fundamentals. DECEMBER 2020 5
INSTITUTIONAL EQUITY                                                                                                                                  Barry Allan, MBA | MINING

 Marathon Gold Corporation
 (MOZ-T – $2.82)
 Buy – Target Price: $5.75

 Company Profile                                                                               About Building a Mine and Unlocking Value
 Marathon Gold Corp. is an advanced-staged development
 company focused on the 100% owned Valentine Lake Gold project                                 Investment thesis and rationale — Unusually good quality
 located in west-central Newfoundland. The project consists of a
 very large land package of approximately 240 km2 centered on 30
                                                                                               A high-quality asset in an excellent jurisdiction that should become
 kms of strike length along the Valentine Lake Thrust Fault. In April                          Canada’s next gold mine. The Valentine Gold Project is currently a 4.1
 2020, a Pre-Feasibility Study (PFS) was released that illustrated a                           Moz resource in an established mining district of Newfoundland where a
 critical mass of gold resources in three separate gold deposit                                completed PFS indicates recovering 1.9 Moz over a 12-year mine life for an
 justifies advancing the project to a Feasibility Study (FS) level of                          upfront capital cost of $272 million, generating an after-tax IRR of ~64% at
 assessment. An Environmental Impact Statement (EIS) was filed in
 September, 2020. There is a high probability that Marathon Gold’s                             the current gold price through the use of conventional open-pit mining and
 Valentine Gold Project grows further and becomes the largest gold                             milling technology. Ongoing exploration continues to discover additional
 mine in Atlantic Canada.                                                                      resources that could potentially add to the mine life. Marathon Gold is all
                                                                                               about unlocking the value of an attractive gold asset.
                                                                                               Key catalysts — Near-term milestones
                                                                                               A number of near-term milestones are expected as the project is
                                                                                               advanced to a production decision. A PFS was completed in April 2020,
                                                                                               and in August 2020 a Feasibility Study was initiated for a targeted
                                                                                               completion in H1/21, at which time a construction decision is expected. A
                                                                                               12-month permitting process was started in September 2020 with the filing
                                                                                               of an Environmental Impact Statement (EIS), and ongoing exploration at
                                                                                               site has continued – identifying additional mineralization outside of the
                                                                                               defined resource base. In early 2021 an updated resource is expected, and
 Source: BigCharts.com
                                                                                               by the middle of 2021 it is expected the true size and meaning of the
 Market and Company Data                                                                       Valentine Gold Project should be better established and understood.
 Ticker                     MOZ-T                  Shares-basic O/S (M)               207.7    Valuation — Expect a premium price
 Rating                     Buy                    Shares-FD (M)                      238.8
 Risk                       High                   Market Cap (C$M)                  $585.7    The Valentine Gold Project is of a size and quality that will have meaning
 Price (C$)                 $2.82                  Float O/S (M)                      207.7    for any established intermediate gold producer. Our valuation of the project
 1-Yr Target (C$)           $5.75                  Ave Daily Vol (K)                  263.8
 Valuation Method           1.00 X NAVPS           52-Wk High-Low (C$)           $2.92-$0.71
                                                                                               is based on the project’s net present value of discounted expected cash
 NAVPS (C$)                 $5.73                  Year-end                       December     flow at a gold price of US$1,850/oz using input parameters of the PFS and
 Div. Yield                 0.0%                   Next Reporting                 Feb, 2021    the existing resource, and using a 6% discount rate. Given the low-risk
 1-Yr ROR                   103.9%                 Working Cap (C$M)                  $52.5    jurisdiction and the excellent access to labour and services, we believe the
                                                                                               project should attract a premium valuation – either by capital markets
                                           2019         2020E          2021E          2022E
 Gold Price (US$/oz)                     $1,325         $1,725         $1,850        $1,850
                                                                                               and investors, and if not, by potential suitors with access to existing
 Gold Prod'n (Koz)                           0.0            0.0            0.0           0.0   cash flow.
 Op. Cost (US$/oz)                           $0               $0           $0            $0
 EPS (C$/sh)                             ($0.03)        ($0.03)        ($0.03)       ($0.03)   Key risks — Risk of funding and building
 P/EPS                                      n.m.           n.m.           n.m.          n.m.
 CFPS (C$/sh)                            ($0.03)        ($0.02)        ($0.03)       ($0.03)
                                                                                               The hurdles facing the project will be the ability to fund the upfront
 P/CFPS                                     n.m.           n.m.           n.m.          n.m.   capital costs to construct the mine, and the risks of actual
 Source: Company report; LBS estimates                                                         construction. However, given the project’s quality, we anticipate the
                                                                                               project will be built – if not by the existing management group who have the
                                                                                               skill sets to do so, then by an existing gold producer. For a project at this
                                                                                               stage of development, the Valentine Gold Project is in an enviable position
                                                                                               compared to its peers given the project’s size and location.

DECEMBER 2020                                                                                     6
INSTITUTIONAL EQUITY Ryan Hanley | MINING
Major Drilling Group International Inc.
(MDI-T – $6.42)
Buy – Target Price: $9.00
Company Profile Major Increases in Global Exploration Spending Expected
Major Drilling International Ltd. is one of the world’s largest drilling
services companies, operating over 600 drill rigs which are Investment thesis and rationale — Robust demand for drilling
primarily focused on the mining industry. The company maintains
offices throughout North America, South America, Europe, Asia,
We expect that demand for drilling services will continue to grow as higher
and Africa, with its head office located in Moncton, New Brunswick. levels of cash flow are generated by gold producers with depressed
MDI was established in 1980 and has a wide array of experience resource bases, while the number & size of equity financings completed by
not only geographically, but also in dealing with various drilling gold explorers has increased significantly when compared to prior years.
services which include both exploration and production drilling. Additionally, the recent rebound in base metal prices from their March lows
should lead to growing exploration budgets from base metal producers,
while base metal explorers have now also started to raise capital.
Key catalysts — Increased demand from all geographic regions
Through FQ2/21 activity in Canada & the US returned to pre-COVID levels,
with growth stemming from an influx of demand from junior exploration
companies. While this is positive, we believe that longer-term revenue
growth and further upside will come from a rebound in activity throughout
other regions (i.e. Central & South America as well as Asia-Africa) as
countries in these areas emerge from COVID-19 related lockdowns,
Source: BigCharts.com allowing companies to undertake more aggressive drill campaigns.
Although no formal budgets have been released, MDI has indicated that
Market and Company Data some gold producers have already forecasted higher budgets for calendar
Ticker MDI-T Shares-basic O/S (M) 80.6
2021, while gold explorers continue to raise capital.
Rating Buy Shares-FD (M) 82.8 Valuation — Room for upside, particularly if demand persists
Risk High Market Cap (M) $517.7
Price C$6.42 Ave Daily Vol (M) 0.24 Despite our belief that demand should rise sharply, particularly given the
1-Yr Target C$9.00 52-Wk High-Low $7.54-$2.26 increased amount of activity from gold producers & explorers while base
Valuation Method 10.0x NTM Year-end April metal producers should also be generating significantly higher levels of
EV/EBITDA Next Reporting March cash flow given a 45% to 70% increase in base metal prices from their
Div. Yield n/a Working Cap ($M) $153.3 March lows, our forecast modestly calls for a ~24% y/y increase in F2022
1-Yr ROR 40.2% EV ($M) $510.2 revenue. Additionally, we are forecasting adjusted gross margins of 25% in
F2022. Should demand continue to increase, we believe that there is still
F2019 F2020 F2021E F2022E ample room for pricing, and therefore margins, to increase as well. As a
Revenue ($M) $384.8 $409.1 $403.2 $497.3
point of reference, for the quarter ending October 31, 2007 (FQ2/08), MDI
EBITDA ($M) $39.2 $48.4 $51.0 $77.5
realized adjusted gross margins of 35% on revenue of over $156M.
EV/EBITDA 13.0x 10.5x 10.0x 6.6x
EPS ($/sh) ($0.23) ($0.88) $0.10 $0.44 MDI maintains a strong financial position with $7.6M in net cash and $87M
P/EPS n/a n/a 65.9x 14.7x in total liquidity. Our $9.00 target price is based on 10x our EV/EBITDA
CFPS ($/sh) $0.48 $0.59 $0.58 $0.88 projections over the next twelve months.
P/CFPS 13.3x 10.9x 11.1x 7.3x
Key risks — In our opinion, labour is now the largest challenge
*All Figures in C$ unless otherwise noted.
Source: Thomson Eikon, Company Reports Aside from a sharp decline in commodity prices which would result in
reduced exploration budgets, we believe the largest risk is related to
labour. Costs to retain experienced drillers, as well as costs related to the
recruitment and training of new drillers could put pressure on margins,
although we currently expect this to be offset by pricing increases.
DECEMBER 2020 7INSTITUTIONAL EQUITY Jacques Wortman, MBA | MINING
Galway Metals Inc.
(GWM-V – $1.12)
Buy – Target Price: $2.25
Company Profile Clarence Stream — A Growing Resource; Quality Targets
Galway Metals Inc. is a Canadian exploration and development
company focused primarily on advancing its 100% owned Clarence Investment thesis and rationale — A quality project
Stream project located in New Brunswick. In addition, GWM also
holds a 100% interest in the Estrades VMS project in Quebec, and
In our view, the most significant development in 2020 for GWM at Clarence
we expect management will start to raise market awareness of this Stream was the ability to demonstrate the continuity of gold mineralization
asset in 2021. With a cash balance of ~$18 mm post a Jun/20 and the key thesis that the Jubilee, Richard and George Murphy zones
financing, GWM is well positioned to continue its aggressive were part of one mineralizing system. In large part, this feature contributed
75,000 metre, 5-drill-rig exploration drilling program at Clarence to increased market awareness and the ability to participate in the junior
Stream through to the end of 2021.
gold bull market in Q2 and Q3. As a result, GWM was able to complete a
significant $17.4 mm equity financing in Jun/20. This financing facilitated an
increase in the H2/20 and 2021 drill program, to a 5-rig, 75,000 metre drill
program by the end of 2021. In our view, the aggressive 2021 drill program
will be important for several reasons: 1) it will complete the new Q1/21
resource estimate, 2) it will allow GWM to further explore the potential of
the recent discoveries, and 3) it will allow GWM to test new regional targets
(geochemical/geophysical) that have seen little to no drilling historically.
Key catalysts — Proof of a new gold district
In 2021, we expect the following key catalysts to continue to demonstrate
that Clarence Stream represents an important new gold district:
Source: BigCharts.com
New resource estimate: in the five (5) known zones we estimate a new
Market and Company Data inventory of ~1.4 mm ounces,
Ticker GWM-V Shares - basic O/S (mm) 167.1
Rating BUY Shares - FD (mm) 181.1 Drill results: 1) We expect the Richard–George Murphy gap to continue
Risk High Market Cap ($ mm) $187.2 to demonstrate good continuity of gold mineralization, and 2) Clarence
Price ($) $1.12 Float O/S (mm) 140.6 Stream is rich in terms of near-zone and regional targets, with a focus
1-Yr. Target ($) $2.25 Ave Daily Vol 267,272 on results from the 4+km soil anomaly SW of Jubilee, the Oak Bay –
Valuation Method 1.0x NAV 52-Wk High-Low ($) $2.09-$0.29
NAVPS ($) $2.22 Year-end December
Tower Hill areas, North Zone extensions, Otter Lake NE of the South
Div. Yield 0.00% Next reporting April Zone, and anomalies 7 km S of GMZ.
1-Yr ROR 100.9% Working Cap ($ mm) $15.2
Valuation — Potential commands premium valuation
F2019A F2020E F2021E F2022E
We apply a C$225/oz valuation target multiple to our 1.4 mm oz resource
Gold Price (US$/oz) $1,387 $1,775 $1,850 $1,850
Gold Prod'n (koz) 0.0 0.0 0.0 0.0
estimate to reflect our view that: 1) the ounce count will increase in the five
Op. Cost (US$/oz) nm nm nm nm (5) known zones, and 2) the numerous other targets with strong indicators
EPS (C$/sh) ($0.05) ($0.06) ($0.08) ($0.08) consistent with past discoveries – soil and till anomalies, boulder assays,
P/E nm nm nm nm geophysics – have the potential to yield new discoveries. We value
CFPS (C$/sh) ($0.05) ($0.06) ($0.08) ($0.08) Estrades at US$0.015/lb ZnEq resource. Adjusting for balance sheet items
nm nm nm nm
our NAV is $2.22/sh and we apply a 1.0x target multiple to NAV.
P/CF
source: Company reports, Refinitiv, LBS estimates
Key risks — An early-stage project
The key risk in GWM story is the early-stage nature of the projects, the
amount of drilling required to advance them, and the associated exploration
risk. That said, the continuity of mineralization to date at Clarence Stream
reduces this risk. GWM is well financed to the end of 2021.
DECEMBER 2020 8INSTITUTIONAL EQUITY Mona Nazir, MBA | INDUSTRIALS INDUSTRIALS Mona Nazir, MBA | NazirM@lb-securities.ca 647 252-5609/ 514 213-6324 Our preferred pick is SNC-Lavalin Group Inc. (SNC-T). Significant undervaluation and a solid baseline business drive our selection this year, despite bearish investor sentiment. It would be an understatement to say that SNC has experienced a challenge or two over the last 24 months. When we initially picked up this name to add to our existing E&C coverage, one key selling point was the valuation upside. Fast forward 3 years+, the stock is down 60% and challenges experienced by the company were never part of our wildest forecasts: significant misses in financial performance, retraction of annual guidance, exit from LSTK contracts after wide-spread losses, impairment charges, delays in achieving targeted results (FCF), DPA agreement/ litigation risk, CEO/President departure, management changes and more recently restructuring of its Resources division and related provisions. While headwinds are expected to continue into H1/21, we believe that investor attention may turn back to this name on attractive valuation metrics and also given the recent appreciation and related multiples of Canadian peers including: WSP-T Global Inc. (WSP-T), Stantec Inc. (STN-T) and Aecon Group Inc. (ARE-T). SNC’s E&C revenue is expected to level out at the ~$8B level (down from $9.8B in 2018) and when combined with the $2B 407 valuation and capital asset portfolio of $0.4B, we believe that the sum of the parts are greater than the $3.9B market cap. As the LSTK projects backlog runs-off and the Resources restructuring is complete, investors should see some consistency and improvement in financial performance and a business characterized by a seemingly lower risk profile. COVID Challenges, What COVID Challenges? In mid-March and early April as COVID numbers began to rise (10,000 level worldwide vs. 500,000+ level currently; daily case figures) and WFH began to take shape, investor concern was heightened and we saw stock prices across our universe fall drastically. In mid- March WSP was down 35% (from $95 to $61), Cargojet Inc. (CJT-T) was down 39% (from $122 to $75), TFI International Inc. (TFII-T) was down 50% (from $48 to $24) and uncertainty plagued update calls with management teams. TFII stated on its Q4 2019 conference call that over 80% of its business had revenue contraction from 20% to 40% in early April. The one key takeaway and surprise was how each and every management team, despite the different businesses: from Stella-Jones Inc. (SJ-T) to Héroux-Devtek (HRX-T) to Aecon to Stantec, re-shifted operations entirely, focused on business fundamentals and increased efficiencies so much so that stock prices are rebounding, in some cases significantly above pre-pandemic levels. We continue to highlight names with strong management teams and their related capabilities in steering the ship throughout the storm and we believe that is a newly appreciated and key focus area for investors across the board. Another key focus item for investors remains positive FCF and related FCF yield and Héroux- Devtek is a standout performer with 9.5% FCF yield YTD and 8%+ on an annualized basis while TFII remains in the top-tier with its double digit FCF yield. Investors Gravitating Towards Names that Offer Greater M&A Growth Of the names that have showcased greatest stock price appreciation or rebound, with the exception of Cargojet, Exchange Income Corp. (EIF-T), WSP, TFII, STN and IBI Group Inc. (IBG-T) have announced acquisition activity. From the mid-March selloff, names that have exhibited the highest appreciation include EIF which is up 202% (from $12.57 to $37.73), WSP which is up 97% and TFII which is up 183%. One common denominator between these names is the fact that they leaned on the acquisition lever and investors are ultimately rewarding companies willing to step back into this arena. Despite initially announcing an M&A pause due to COVID-19, TFII was the first company in our universe to return to acquisition activity. The company has made 10 acquisitions YTD with a combined purchase price in the ~$1B range. Turning to WSP Global, the market had anticipated a large acquisition over the last 10 months and the company delivered in early December with the $1.5B purchase of Golder (20% margin profile following full synergy extraction). Looking into 2021, we believe that WSP and TFII have the potential to continue with acquisition activity with both companies have strong FCF generation in and around the $600M mark and dry powder for each remains around ~$1B of availability. We also highlight that EIF could take advantage of the current Aerospace downturn (YTD RPK down 70% YoY) and look to make some asset purchases on the Regional One or PAL side. Stantec is expected to continue with acquisition activity; however we can expect “small to medium size” targets (under 1,000 employees), continuing trends seen this year (three acquisitions; 435 employees added). Net/ net we continue to believe that investors are paying close attention to companies that have the ability to grow via acquisition activity and a proven track record, which has directly resulted in expansion of related valuation multiples. DECEMBER 2020 9
INSTITUTIONAL EQUITY Mona Nazir, MBA | INDUSTRIALS
SNC-Lavalin Group Inc.
(SNC-T – $22.69)
Buy – Target Price: $31.50
Company Profile Seemingly-Low Valuation Should Attract Greater Attention
SNC-Lavalin (SNC) is one of the leading engineering and
construction companies in the world and the largest E&C firm in Investment thesis and rationale — Light at the end of the tunnel
Canada. The company provides engineering and construction
expertise, operations and maintenance services, as well as
Challenges plaguing the SNC story are not over, as of yet; however, the
investments in infrastructure concessions. current stock price and valuation gap, is glaringly obvious. We believe that,
as the story continues to de-risk, greater attention is warranted. After
exiting LSTK projects (backlog run-off continues) and with the Resources
restructuring we believe that SNC’s operations are not only valuable but
strong. The company continues to be part of the infrastructure build-out and
expertise remains. Looking at the Canadian landscape simplistically, WSP
and STN’s market caps are 62% and 24% above current net revenue levels
and while their margin profiles are superior to SNC’s we believe SNC’s
inherent valuation gap cannot be ignored (50% discount). We believe as
SNC resurfaces with a lower risk profile, and greater financial profitability
and consistency it is well positioned for a multiple re-rating.
Key catalysts — Operational focus
Source: BigCharts.com
Stronger financial performance and lower losses stemming from the
Market and Company Data SNCL Projects division (turn to profitability in all segments);
Ticker SNC-T Shares O/S (M) 176
Rating Buy Market Cap (M) 3,983 Completion of the Resources restructuring;
Risk Medium Float O/S (M) 175
Price $22.69 Float Value (M) 3,981 Completion of the LSTK backlog run-off;
1-Yr Target $31.50 Avg Daily Volume (K) 786
Dividend
1-Yr ROR
$0.08
39.2%
Enterprise Value (M) 5,106
Control Blocks:
Certainty that provisions and litigation matters, of meaningful size, are
52 Wk High-Low $34.36- $17.50 Manag & Dir 0.1% in the past.
BVPS $19.42 Next Reporting Feb-21
Valuation Sum-of-the-Parts Year End Dec. 31 Valuation — SNC continues to lag behind peers
PS&PM EPS Q1 Q2 Q3 Q4 Annual
2019A ($0.08) A ($1.71) A $0.41 A $0.45 A ($0.93) Our $31.50/share target price is based on a sum-of-the-parts valuation
2020E ($0.02) A ($0.22) A ($0.33) A $0.29 E ($0.28)
2021E $0.28 E $0.33 E $0.39 E $0.50 E $1.50 methodology. For its core E&C business we have applied a 6x EV/ EBITDA
2022E $1.84 multiple. Our 407 valuation of $12.50 is based on a DCF analysis which
PS&PM Adjusted EBITDA ($M)
2019A $79 A ($152) A $185 A $167 A $279 aligns with CPPIB’s recent purchase of a 10% stake. The capital assets are
2020E $85 A $40 A $73 A $145 E $343 valued at 1.5x book value, equating to $3.23. It is conceivable as investors
2021E $141 E $151 E $166 E $190 E $649
2022E $721 regain confidence in the story, profitability increases and restructuring
Cons. EPS Q1 Q2 Q3 Q4 Annual P/E yields results, that we could see significant stock price appreciation from
2019A $0.34 A ($1.34) A $0.71 A $0.56 A $0.28 82.3x
2020E $0.15 A ($0.18) A ($0.19) A $0.36 E $0.13 168.8x the current level. WSP trades at 12x 2021 EBITDA while STN’s multiple is
2021E $0.34 E $0.39 E $0.51 E $0.58 E $1.83 12.4x 9x and the industry average is 8.5x.
2022E $2.28 10.0x
Adjusted EBITDA ($M) EV/EBITDA
2019A $137 A ($89) A $225 A $193 A $465 11.0x Key risks — It’s in management’s hands
2020E $120 A $51 A $103 A $158 E $432 11.8x
2021E $153 E $164 E $190 E $206 E $714 7.2x Some delays in restructuring of the Resources division, the run-off of
2022E $808 6.3x the LSTK backlog and future provisions. Also lack of consistency in
Source: Company reports; Bloomberg; LBS.
financial performance as project profitability ebbs and flows linked to the
nature of its business.
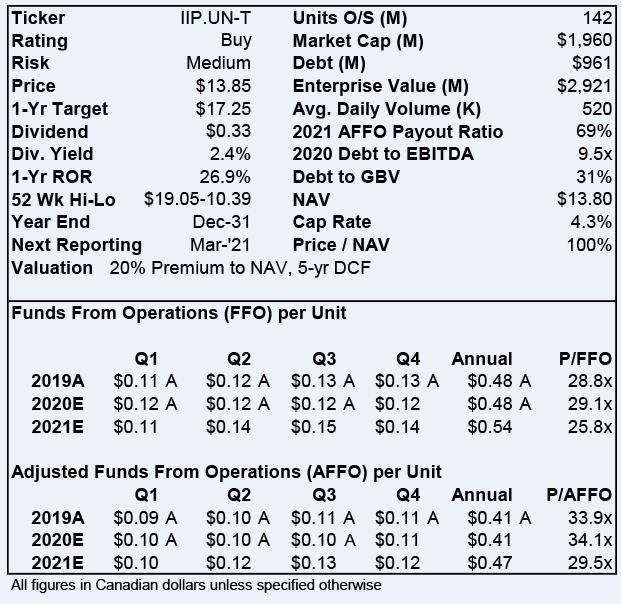
DECEMBER 2020 10INSTITUTIONAL EQUITY Yashwant Sankpal, MBA | REITS REITS Yashwant Sankpal, MBA | SankpalY@lb-securities.ca 416 865-5941 Our preferred pick is InterRent REIT (IIP.UN-T). InterRent is one of the largest apartment landlords in Canada, with 11,000 suites located in primarily in Montreal, Ottawa, the GTA and the Niagara Hamilton region. While the REIT typically trades at a 15-25% premium to NAV, the pandemic meltdown in the stock market and the subsequent negative press about the sector (rise in vacancy and bad debt, government restrictions on rent increases / evictions in some markets) has brought down IIP’s valuation down along with the rest of the REIT sector. IIP has recovered some of the losses, but still trades at par with our NAV estimate. As we explain on the next page, this consistent value creator should be trading at a 15-20% premium to NAV. Winners and Losers from the Pandemic While the pandemic has created temporary headwinds for some real estate segments (Apartments and Seniors Living), it has also caused structural changes in a few segments (Retail, and Office). The Industrial segment has actually seen improving fundamentals during the pandemic thanks do the growth in demand for eCommerce. In the Retail segment, fashion-oriented, enclosed, and downtown retail properties are struggling because of involuntary lockdowns, and the negative impact of the increased eCommerce traffic. We believe the Office sector, especially downtown Office, has seen a paradigm shift for the worst as the pandemic has changed our society’s outlook on telecommuting. It appears that this mass telecommuting model is not only here to stay but is likely to grow in proportion as time passes, somewhat akin to what eCommerce has done to the brick-and-mortar Retail industry. Also a trend of businesses moving from downtown locations to suburban, to follow their employees, is beginning emerge. All these factors are pointing to rising vacancies and falling rents in the downtown office sector. On the other hand, if the trend of young professional moving to suburbs continues to sustain and grow, it could also have negative consequences for downtown Apartments and Retail properties. Having said all that, we highlight that it is still early days to have a strong conviction on these trends and many of them may not materialize. Low Interest Rates Beneficial for the Entire Sector Since the beginning of 2020, the Canadian 10-year bond yield dropped more than 100bps to as low as 45bps in July 2020. The Bank of Canada expects to leave the benchmark rate near zero until 2023. Given the higher proportion of leverage used by the REITs, these low rates mean significant interest savings for the REIT sector and should translate into meaningful FFO/unit and dividend growth. Expect V-Shaped Recovery in the Apartment Sector Due to the pandemic, very few new immigrants, foreign students or business travellers are entering into Canada, creating a large demand gap for the Apartment sector and the short-term rental / Hotel industry. However, the government of Canada plans to bring in 1.2MM new immigrants between 2021 and 2023. This wave of renters is going be very positive for the Canadian Apartment sector that is currently experiencing somewhat soft fundamentals. As a result, we think the Apartment sector’s cash flows and valuations are likely to see a V-shaped recovery once Canada opens international travel. DECEMBER 2020 11
INSTITUTIONAL EQUITY                                                                                                    Yashwant Sankpal, MBA | REITS

 InterRent REIT
 (IIP.UN-T – C$13.85)
 Buy – Target Price: C$17.25

 Company Profile                                                   Opportunity to Buy a Consistent Value Creator at NAV
 InterRent is a growth-oriented REIT focused in Ontario and        Investment thesis and rationale — High Quality
 Quebec, and owns ~11,000 suites. The National Capital Region
 accounts for 30% of the suites, followed by Montreal (27%), and   We believe IIP is one of the best managed REITs in Canada and has been
 Hamilton/Niagara (19%).                                           a consistent value creator for its unitholders (grown its FFO/unit at a CAGR
                                                                   of 7% for the last five years). IIP’s ability to apply its re-positioning formula
                                                                   effectively has been and will remain its core strength. Such a high quality
                                                                   company trading at par with our NAV estimate is an attractive investment
                                                                   opportunity. See our recent quarterly update dated Nov 10, 2020.
                                                                   Key catalysts — V-shaped recovery
                                                                   Recovery in occupancy. Since the onset of the pandemic, IIP’s
                                                                   occupancy has declined 320bps to 92% as the demand from new
                                                                   immigrants and students declined and rental supply increased as many
                                                                   short-term rental suites (B&B) switched to long-term rentals. When Canada
 Source: BigCharts.com
                                                                   opens its doors for new immigrants and universities begin regular classes,
                                                                   IIP’s occupancy should quickly recover to its historical 95-96% range, and
 Market and Company Data                                           should boost its FFO/unit by 15-20%.
                                                                   Resumption of the repositioning program. the main driver behind IIP’s
                                                                   superior FFO/unit growth is its ability to reposition its acquisitions. IIP
                                                                   renovates underperforming buildings and rent them at market rents. A
                                                                   repositioned suite experiences on average a 25% increase in NOI.
                                                                   Currently, only 70% of IIP’s 11,000 suites are repositioned. The pandemic
                                                                   has slowed down the pace of repositioning.
                                                                   Valuation — Trades at NAV
                                                                   Attractive opportunity to buy a high quality business at NAV. While IIP
                                                                   may appear to be trading at sector-high FFO & AFFO multiples, it can be
                                                                   partly explained by the fact that: 30% of its suites are non-repositioned (i.e.
                                                                   its cash flow is understated), that IIP has the lowest leverage in its peer
                                                                   group, and by its track record of above average FFO/unit growth. Given
                                                                   these factors, IIP should trade at a 15-20% premium to NAV.
                                                                   Key risks
                                                                   A prolonged pandemic. If the recently discovered vaccines do not prove
                                                                   effective against the virus or the distribution of the vaccines is not uniform
                                                                   across the world, the pandemic and the related restrictions could last for a
                                                                   longer period, impacting the resumption of international travel.
                                                                   Adverse policy changes. Since the start of the pandemic, we saw a few
                                                                   instances where government bodies made adverse policy changes without
                                                                   consulting the Apartment industry (rent freeze, eviction bans, etc.). While
                                                                   these changes were short term, a long-term change could impact the
                                                                   profitability of the sector permanently. Having said that, we see a very low
                                                                   chance of such a change.

DECEMBER 2020                                                         12
INSTITUTIONAL EQUITY Furaz Ahmad, CFA, CPA, CMA | SPECIAL SITUATIONS SPECIAL SITUATIONS Furaz Ahmad, CFA, CPA, CMA | AhmadF@lb-securities.ca 416 865-5982 Our preferred pick is Converge Technology Solutions Corp. (CTS-V). While CTS’s stock has increased over 170% in 2020, we believe there is still material upside potential over the next 12 months and see a number of catalysts that may drive the stock higher. Given the highly fragmented nature of the IT Solution Providers (ITSP) industry, with ~80k ITSPs competing for market share, and the largest player only accounting for 40% recently (vs. consolidated gross margins of 27.6% in Q3/20), with the company expecting to increase gross margins for these services to 55-60% over the next 2 years. M&A Remains a Focal Point for Growth Acquisitions are expected to be a key driver of growth for our small cap diversified coverage universe in 2021. Given the challenges created by COVID-19, many small to mid-size companies are facing financial distress. This should lead to significant M&A in 2021 as larger, better capitalized players in the market have an opportunity to consolidate fragmented industries. Additionally, private equity sponsors, who have ample capital to deploy, are also expected to be active, which is expected to drive up acquisition multiples, particularly in industries that generate significant free cash flow. While larger sell-side-led acquisition processes tend to demand higher prices and more private equity interest, we believe there continues to be opportunity to pursue small-scale tuck-in acquisitions at more measured valuation multiples. Within our coverage universe the following companies are expected to be active on the M&A front in 2021: Boyd Group Services Inc. (BYD-T), Calian Group Ltd. (CGY-T), Converge Technology Solutions Corp. (CTS-V), CCL Industries Inc. (CCL.B-T), and K-Bro Linen Inc. (KBL-T). COVID-19 Recovery Many of the companies in our coverage universe were significantly impacted by COVID-19 in 2020, and while the recovery is expected to be gradual, we expect a relatively normalized operating environment starting in H2/2021. COVID-19 negatively impacted the following companies in our coverage universe: Boyd Group Services Inc. (BYD-T), Uni-Select Inc. (UNS-T), Currency Exchange International Corp. (CXI-T), and K-Bro Linen Inc. (KBL-T). As vaccines get distributed in the U.S., Canada, and the U.K., we expect a recovery in the travel and hospitality industry, as well as vehicle miles traveled, which should ultimately be a tailwind for the companies mentioned above on a y/y basis. DECEMBER 2020 13
You can also read