DO OFFICE BUILDINGS 'SAVE' ENERGY IN THE UNITED STATES DUE TO DAYLIGHT SAVING TIME (DST)? A 50-STATE SIMULATION-BASED STUDY - ashrae
←
→
Page content transcription
If your browser does not render page correctly, please read the page content below
2018 Building Performance Analysis Conference and
                                                                        SimBuild co-organized by ASHRAE and IBPSA-USA
                                                                                                               Chicago, IL
                                                                                                    September 26-28, 2018

     DO OFFICE BUILDINGS ‘SAVE’ ENERGY IN THE UNITED STATES DUE TO
     DAYLIGHT SAVING TIME (DST)? A 50-STATE SIMULATION-BASED STUDY

                              Tarek Rakha1, Yuanyue Chen1, and Christoph Reinhart2
                                       1
                                         Syracuse University, Syracuse, NY
                             2
                               Massachusetts Institute of Technology, Cambridge, MA

                                                                        Previous research that has been conducted in order to
ABSTRACT                                                                investigate the savings DST provides has not been
This paper investigates the “savings” in Daylight Saving                conclusive. Results supported both an increase and a
Time (DST) through a comprehensive simulation-based                     decrease in energy savings. Within the US,
study. A United States Department of Energy (US DOE)                    investigations that utilized existing electrical
core and perimeter reference small office building was                  consumption data showed that Indiana demonstrated a 1-
simulated with and without DST for each state across the                4% increase in electrical energy consumption (Kotchen
seven US climate zones using benchmark inputs. The                      and Grant, 2011). California demonstrated a 3.4%
“lightswitch” model was used to represent                               decrease in winter (Kandel and Metz, 2001) whilst a
probabilistically-valid user behavior for lighting energy,              similar experiment conducted a few years later showed
using DIVA for Grasshopper as the front-end for                         no significant change in energy consumption (Kandel
Radiance and Daysim, and resulting schedules were used                  and Sheridan, 2007). A study that drew from electrical
as input for the EnergyPlus thermal zone models, using                  consumption data across the United States, however,
Archsim for Grasshopper. Results demonstrate a range                    found a 0.5% decrease in electrical consumption (Belzer,
up to 7% lighting energy savings when DST is not                        Hadley and Chin, 2008).
applied in 36 states. On average, the application of DST                Outside of the United States, experiments in Victoria,
did not save energy in simulated small office spaces                    Australia showed that extending DST would reduce
across the country, and caused an increase of 0.1% in                   electricity consumption in the evening, but these savings
total energy consumption. The paper concludes by                        would be negated by increased demand in the morning
discussing the validity of continuing to apply DST in the               (Kellogg & Wolff, 2008). Studies in Ontario, Canada
US.                                                                     show a 1.5% decrease in energy consumption (Rivers,
                                                                        2016) and experiments in the United Kingdom showed a
                                                                        0.3% decrease (Hill, Desobry, Garnsey, & Chong, 2010).
INTRODUCTION                                                            Due to the specific nature of existing research, the results
Daylight Saving Time (DST) is the practice of setting                   vary across the globe due to economical, geographical
clocks an hour forward during summer and back during                    and climatological factors. Evidence of success is
the winter, introduced in the United States during the                  therefore limited, even contradictory, and there is no
first World War in order to save energy by reducing the                 definitive proof of the benefits or disadvantages of DST
amount of electric energy used for lighting in the evening              (Aries & Newsham, 2008).
(Gurevitz, 2007). DST in the United States is observed                  The application of DST, however, resulted in various
by moving the time forward one hour on the first Sunday                 negative effects on human health and well-being.
in April and back one hour on the last Sunday in October                Previous work has shown that transitions into and out of
(Yacker, 1998). 141 countries have applied DST at one                   DST caused minor jet lag symptoms such as sleep
point, however the number has decreased to just 76                      disruption, fragmentation of the circadian rhythm, and
countries around the world (Time and Date AS, 2016).                    fatigue (Lahti, Leppämäki, Lönnqvist, & Partonen,
While DST might have saved energy when it was first                     2008). As a result, investigations conducted in the United
introduced, with the inclusion of heating and cooling                   States showed that there has been a significant increase
costs, the benefits of DST has become less pronounced,                  in accidents in the week following the time change into
and the US has been debating the benefits of its                        and out of DST (Varughese & Allen, 2001). The use of
continued application (Gurevitz, 2007).                                 DST has also been linked to an increase in suicide rates

© 2018 ASHRAE (www.ashrae.org) and IBPSA-USA (www.ibpsa.us).                                                                             21
For personal use only. Additional reproduction, distribution, or transmission in either print or digital form is not permitted without
ASHRAE or IBPSA-USA's prior written permission.
(Berk, et al., 2008) and an increase in cardiac representative cities for each of the 50 states, followed
complications (Jiddou, Pica, Boura, Qu, & Franklin, by setting up a daylighting simulation model in DIVA
2013). Research relating energy savings to application of for Grasshopper that produces five lighting schedules for
DST was inconclusive, but its possible hazard on issues standard core and shell zones. The schedules are used as
of human health was not. It is therefore critical to inputs for a five thermal zones model in Archsim for
understand the magnitude of expected energy savings, in Grasshopper. Finally, fuel breakdown for heating,
order to qualify DST’s further implementation. The cooling, lighting and equipment outputs are produced
problem lends itself to the use of computer simulation, and tabulated for analysis.
in order to compare energy use with and without the
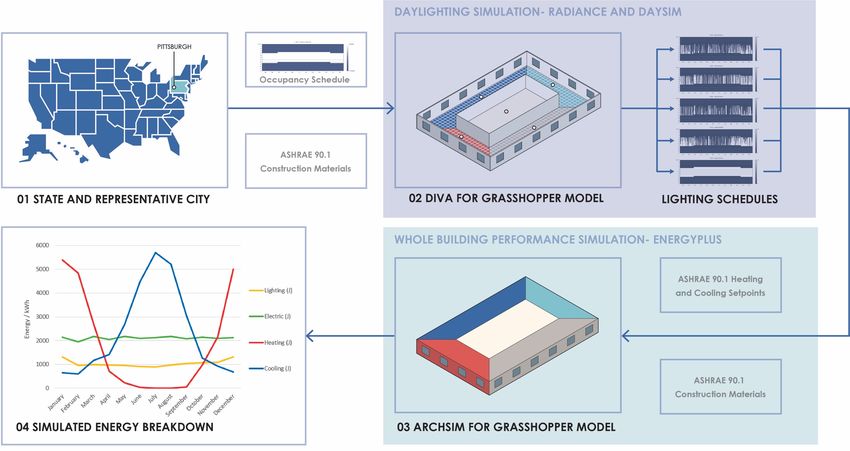
Location and Reference Model Setup
implementation of DST in various climate zones.
Simulation has been used before as a tool to investigate The 50 US states were demonstrated by modeling a
this issue for Osaka City, Japan. It was found that the reference building in a representative city from each
energy reduction of lighting was 0.02% of the total state. Each city is classified into one of the 7 US climate
annual primary energy consumption in the residential zones (Baechler, Williamson and Gilbride, 2010). Not
sector for the seasonal total. The energy use for cooling, every state falls completely in a single climate zone, so
however, increased by 0.15% of the total energy use and cities were selected to ensure an even spread across all
therefore, the primary energy use is increased by 0.13% climates. While the distribution is still skewed, with only
of the total primary energy consumption residential 2 states in Zone 1 and 7, as the majority of the US falls
sector due to DST. between Zone 4 and 5, this uneven distribution was
unavoidable.
This paper investigates the savings in DST through a
comprehensive simulation-based study. A US DOE core A standardized small office model was built in Rhino3D
and perimeter reference small office building was CAD software based off the benchmark reference
seleced to represent the office building type simulated buildings developed by the US DOE (U.S. Department
for each state across the seven US climate zones, using of Energy, 2014). The small office model (Figure 2) has
benchmark inputs, to answer the research question: does a floor area of 5500 ft2 and consists of a rectangular room
the application of DST actually “save” energy use in with windows on all four sides. The 10 windows are 6 ft
office buildings? wide and 5 ft high. For the purposes of our simulations,
the office is located on the ground floor, with no
METHODOLOGY surrounding obstructions that may cast shadows on the
The research method was developed through a 4-step building.
workflow (Figure 1) that is applied once without DST
and once with DST. The first step is identifying
Figure 1 Simulation-based 4 step research method developed to run once without DST and another with DST
© 2018 ASHRAE (www.ashrae.org) and IBPSA-USA (www.ibpsa.us). 22
For personal use only. Additional reproduction, distribution, or transmission in either print or digital form is not permitted without
ASHRAE or IBPSA-USA's prior written permission.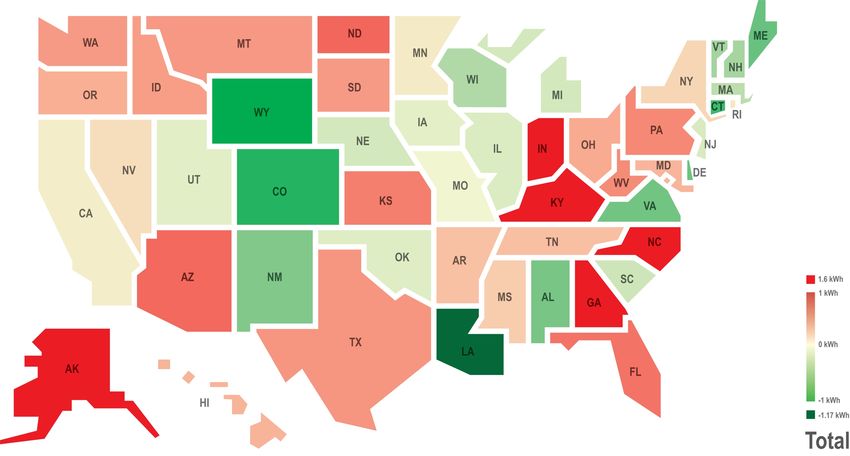
not switching on the lights even though the illuminance
                                                                        has fallen beneath the required lux threshold.
                                                                        Radiance/Daysim and the lightswitch model simulate
                                                                        annual hourly illuminance values at the working plane,
                                                                        and uses the output to generate an hourly lighting
                                                                        schedule according to probabilistic occupant interaction.
                                                                        The simulation ran at a target illuminance of 500 lux for
                                                                        a control node in the middle of each of the 4 perimeter
                                                                        zones, and lighting was always on in the core zone. The
                                                                        resultant 5 lighting schedules were used as inputs in the
                                                                        whole building performance simulation model.

                                                                                            Typical Occupancy Schedule

     Figure 2 Daylighting and energy CAD model
 illustrations, with 4 perimeter zones and 1 core zone.
Daylighting Simulation
Daylighting performance was simulated using DIVA for
Grasshopper as the front-end for the backwards raytracer
Radiance (validated by Reinhart and Walkenhorst, 2001)
                                                                                            Typical Equipment Schedule
and Daysim simulation engines. The model inputs
include geometric definitions of space, finishing                             Figure 3 Occupancy and equipment schedules
materials and occupancy schedules.
Office schedules were created according to the
ASHRAE 90.1 standards for occupancy as well as                          Whole Building Performance Simulation (BPS)
equipment usage. The occupant is assumed to arrive at
                                                                        Energy modeling was performed using Archsim for
the office at 8 AM and leaves at 6 PM on both weekdays
                                                                        Grasshopper, which uses the US DOE EnergyPlus as the
and weekends, although there is considerable lower
                                                                        whole BPS engine. Inputs exceed the daylighting model
occupancy during the weekends. Equipment schedules
                                                                        requirements, by providing construction details beyond
perform similarly, but equipment is kept running through
                                                                        finish material reflectance. The model uses thermal
the night. The occupant is assumed to take a lunch break
                                                                        zones to calculate heat transfer using inputs of weather
at 1 PM, corresponding to a dip in occupancy at that time
                                                                        data, geometry and zone definition details including
(Figure 3). The DST shift for the experiment starts on
                                                                        construction features, schedules and equipment.
March 11th and ends on November 1st, and follows the
                                                                        Consequently, the simulation engine simulates multiple
same schedules but shifted forward an hour.
                                                                        outputs, including loads for heating, cooling, lighting
The “lightswitch” model (Reinhart, 2004) was used to                    and equipment. Table 1 demonstrates primary inputs for
represent probabilistically-valid user behavior for                     the model. It is important to note that these inputs vary
lighting energy. The model more accurately simulates                    according to the climate zone based on the ASHRAE
lighting usage by taking into account the probability of                90.1 standard. The model employs a thermostat that has
an occupant to interact with lighting equipment                         a heating setpoint of 20°C and cooling setpoint of 25°C.
according to daylighting performance. It demonstrates
situations such as a user forgetting to switch off the lights
even if daylighting performance become better, or a user

© 2018 ASHRAE (www.ashrae.org) and IBPSA-USA (www.ibpsa.us).                                                                             23
For personal use only. Additional reproduction, distribution, or transmission in either print or digital form is not permitted without
ASHRAE or IBPSA-USA's prior written permission.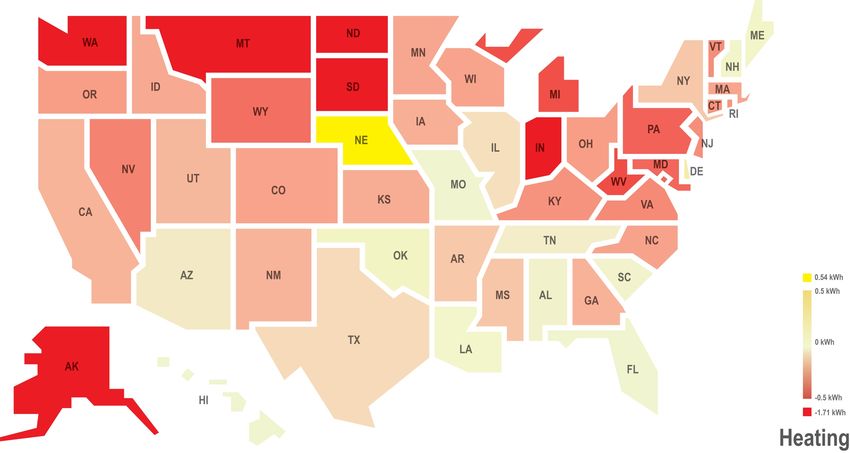
Table 1 Primary inputs for Archsim / Energyplus                     from 6.67 kWh, which is marginal comparatively). The
                                                                        most savings in terms of value was Alaska’s 1.72 kWh
   CONSTRUCTION                Wall                 1.76                decrease from 83.39 kWh annually, which is saving
   R-VALUE                                          m2K/W               2.1%. 4 states did not benefit from the application of
                               Roof                 3.32                DST, but it was all marginal in terms of value, with
                                                    m2K/W               maximum loses of 0.5 kWh yearly. Overall, the states
                               Floor                0.54                would benefit 0.9% in heating energy savings with the
                                                    m2K/W               application of DST.
   GLAZING                     U-Value              3.35
                                                    W/m2K               Cooling
                               Transmittance        70 %                Most states were either effected negatively or not
   WINDOW TO                   North                24.4%               effected by the application of DST, where 21 states had
   WALL RATIO                  East                 19.8%               better cooling energy performance when DST was not
   (WWR)                       West                 19.8%               applied, and 13 were not affected. North Carolina is a
                               South                24.4%               representative state of that change, with 0.8%
   LIGHTING                                         11.8 W/m2           improvement without DST (0.68 kWh decrease from
   POWER DENSITY                                                        83.12 kWh). However, 16 states had worse cooling
   (LPD)
                                                                        energy consumption when DST was not applied.
   EQUIPMENT                                        10.76 W/m2
                                                                        Wyoming had a 1% increase (0.45 kWh increase from
   LOADS
                                                                        42.66). Overall, the average change of energy
Simulated Energy Analysis                                               performance with and without the application of DST
For each city (representing a state) the reference office               was 0%.
model ran with and without DST first for daylighting                    Total Energy Use
simulation to produce lighting schedules, then for energy
                                                                        When combining heating, cooling and lighting, the effect
simulations to produce energy fuel breakdown. The
                                                                        cooling energy experienced had the most influence on
results were tabulated to compare the effect DST has on
                                                                        total energy use results. Following the same trends for
energy consumption, while disregarding equipment
                                                                        cooling, 23 states had better overall energy performance
loads since they were constant. The differences were
                                                                        without DST, 13 didn’t have a significant difference and
then mapped for each state.
                                                                        14 were better with DST applied. Maximum energy
RESULTS                                                                 differences with and without DST were in the 1% range
                                                                        difference. The most savings when DST was not applied
Figure 4 demonstrates the outcomes of all simulations as
                                                                        was in the state of North Caroline (1.6 kWh decrease
the difference between applying and not applying DST.
                                                                        from 172.25 kWh total), and the most savings when DST
For the purposes of our analysis, we chose to consider
                                                                        was applied was in Louisiana (1.17 kWh decrease from
each difference in the +/- 0.1% range negligible due to
                                                                        194.92 kWh). The average savings across the country
insignificance, and that the application of DST had no
                                                                        was 0.1% (typically in the 1.5 kWh range) if DST was
effect. We examined each type of energy system affected
                                                                        not applied.
by the application of DST separately, then in total.
Lighting                                                                DISCUSSION
Energy used in electric lighting was the most effected                  We discuss the “savings” value in applying DST across
negatively by the application of DST. 36 states were                    the US through three topics: possible policy implications
effected, with Alaska’s worst increase in energy use by                 in the US, future design trajectory features, and
7.6% (2.7 kWh increase added to 35.46 kWh). 11 states                   limitations within the research framework.
were better with DST, with Arizona’s best decrease in                   Possible Policy Implications
energy use by 2.9% (0.6 kWh decrease removed from
                                                                        Results demonstrate that ineffectiveness of applying
22.67 kWh). 3 states were not affected (Connecticut, for
                                                                        DST in the context of office buildings’ energy
example), and the average energy use increase for all 50
                                                                        performance. The study reveals negative implications of
states was 1.7%.
                                                                        continued DST application in states that are typically
Heating                                                                 affected in terms of cooling and lighting energy savings.
Conversely, heating energy was the most effected                        This is because the simulation model accurately
positively with the application of DST. 42 states                       represented a core and shell building setup that has
benefited from the application of DST, with California’s                bordering lighting energy losses when
3%, representing the best savings (0.2 kWh decrease

© 2018 ASHRAE (www.ashrae.org) and IBPSA-USA (www.ibpsa.us).                                                                             24
For personal use only. Additional reproduction, distribution, or transmission in either print or digital form is not permitted without
ASHRAE or IBPSA-USA's prior written permission.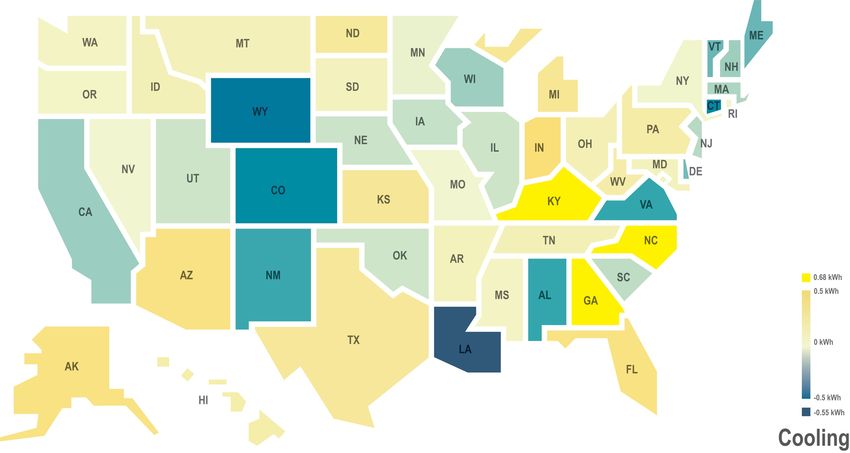
Figure 4 Heating, cooling, lighting and total energy consumption differences with and without the application of
  DST. Positive values denote energy saved when DST is not applied, and negative values signify energy saved when
                                                    DST is applied.

© 2018 ASHRAE (www.ashrae.org) and IBPSA-USA (www.ibpsa.us).                                                                             25
For personal use only. Additional reproduction, distribution, or transmission in either print or digital form is not permitted without
ASHRAE or IBPSA-USA's prior written permission.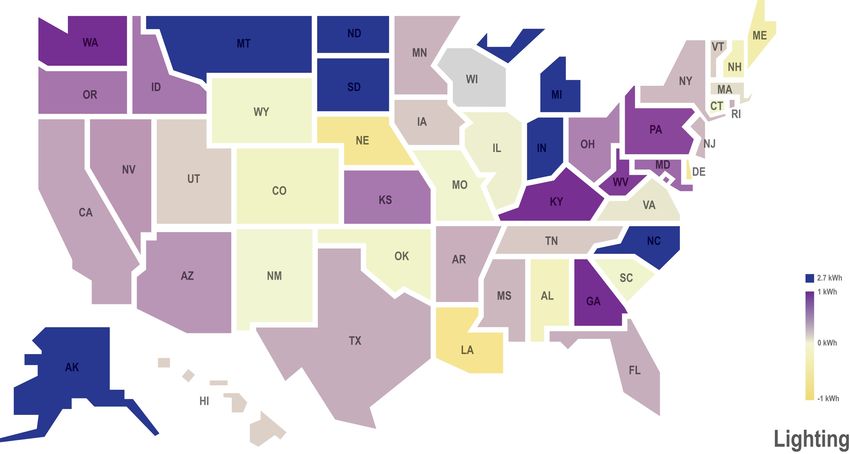
compared to heating energy gains and mixed results with                 of lighting energy loads, savings in heating energy due
cooling energy. In cases where lighting energy is used                  to the application of DST could be justified. However,
continuously, and therefore there are also cooling                      the expectation with designers, owners and building
implications, application of DST had a positive effect                  operators that promote such energy efficient practices is
(e.g. WY and NM). However, when cooling energy is                       that all building systems will be energy efficient as well,
not saved when DST is not applied, but lighting energy                  and the savings effect will be observed across all end
savings are evident, there is no significant effect                     uses, rendering DST effects neutral once again.
associated with applying DST (e.g. CA and UT). The
                                                                        Study Limitations
cases that has the most critical effect on energy savings
relevant to not applying DST are those who save both on                 This simulation-based study has several limitations:
cooling and lighting energy (e.g. KY and AK).                           § The focus is on office buildings, with no built
Considering the negative effects DST has on human                             environment or any urban context.
health and well-being, as stated in the introduction, and               § The building footprint is representing small offices,
with the findings that show the overall ineffectiveness of                    and medium to large office buildings should be
applying DST across the US, the authors question the                          studied as well.
validity of continuing to observe DST in the US. Possible
positive social aspects of applying DST include boosting                § Although lighting schedules represent human
tourism because daylight in the evening hours would                           behavior probabilistically, occupancy schedules
make people more likely to visit parks and other                              don’t, and should be researched stochastically as
attractions, but such studies were anecdotal rathe than                       well.
scientific. Therefore, if this practice continues, it is                § One building type is represented, and other building
recommended that it remains only in Northeastern states                       types should be investigated (e.g. residential,
ME, NH, VT, MA and CT, as well as Midwestern states                           commercial, medical, etc.)
WY and CO. Otherwise, other states that may benefit                     § The chosen error margin of +/- 0.1 should
from the application of DST typically have negligible                         incorporate issues of uncertainty in BPS, and its
savings, or can be considered as an outlier case (e.g.                        effect on the variability in simulated parameters
Louisiana), as shown in table 2 in the appendix.                              (Hopfe & Hansen, 2011).
Future Design Trajectories                                              It is therefore recommended that future studies address
The goal behind applying DST is to save energy. The                     such limitations. Further building, neighborhood and
reference model that was simulated did not represent best               city-scale investigations should be established through
practices that would be geared towards that particular                  the continued development of Urban Building Energy
goal. For example, the core area is relatively dominant,                Models (UBEMs) beyond single building investigations.
and construction materials, buildings systems and even                  CONCLUSION
WWRs were not designed to make use of environmental
                                                                        This paper investigated the “savings” in DST through a
features relative to each climatic zone. Therefore, we
                                                                        comprehensive simulation-based study. A US DOE core
speculate on a future that utilizes better design features
                                                                        and perimeter reference small office building was
by focusing on the southern oriented zone, and
                                                                        simulated with and without DST for each state across the
investigate the amount of energy that would be saved if
                                                                        seven US climate zones using standard inputs. Results
DST was not applied to that zone only, which is less
                                                                        demonstrate that in most states lighting and cooling
heating dominated and more lighting efficient.
                                                                        energy is saved or the effect is negligible when DST is
The results of the south zone demonstrate that 35 states                not applied. Conversely, heating energy was mostly
would benefit if DST was not applied, 2 states are not                  saved when DST was applied, but only marginally when
affected either way, and only 13 states would benefit                   compared to lighting and cooling. The paper discussed
from its application. On average, the states would save                 the validity of continuing to apply DST in the US, where
0.5% of total energy if DST was not applied to southern                 on average total energy use in the simulated office
oriented office zones. Most savings would happen in the                 building increased by 0.1% across the states.
state of Indiana, with 2.3%, and most losses would                      Furthermore, the paper speculates on future design
happen in the state of Alabama, with 1.5%.                              trajectories in general and not specific to the study at
It is important to note that speculation on better design               hand, which demonstrated that as buildings are designed
can also make the application of DST promote certain                    to be more energy efficient, the negative effects of DST
features that might make its purpose useful. With the                   are expected to be exacerbated. DST might have been
adoption of better lighting design practices, such as the               linked to energy savings when it was first introduced.
use of LEDs, occupancy sensors, and overall reduction                   However, the benefits have become less evident. With

© 2018 ASHRAE (www.ashrae.org) and IBPSA-USA (www.ibpsa.us).                                                                             26
For personal use only. Additional reproduction, distribution, or transmission in either print or digital form is not permitted without
ASHRAE or IBPSA-USA's prior written permission.
human health and wellbeing in mind, this simulation-                        consumption: a statistical analysis. California
based building energy performance study concludes that                      Energy Commission.
in the case of DST in the US, the risks outweigh the                    Kellogg, R., & Wolff, H. (2008). Daylight time and
benefits.                                                                   energy: Evidence from an Australian experiment.
ACKNOWLEDGMENT                                                              Journal of Environmental Economics and
                                                                            Management, 56 (3), 207-220.
This study was funded in part by the Syracuse Center of
Excellence (SyracuseCoE) and the Syracuse University                    Kotchen, M. J., & Grant, L. E. (2011). Does daylight
School of Architecture.                                                     saving time save energy? Evidence from a natural
                                                                            experiment in Indiana. Review of Economics and
REFERENCES                                                                  Statistics, 93(4), 1172-1185.
Aries, M. B., & Newsham, G. R. (2008). Effect of                        Lahti, T. A., Leppämäki, S., Lönnqvist, J., & Partonen,
     daylight saving time on lighting energy use: A                         T. (2008). Transitions into and out of daylight
     literature review. Energy policy, 36(6), 1858-1866.                    saving time compromise sleep and the rest-activity
Baechler, M. C., Williamson, J. L., Gilbride, T. L., Cole,                  cycles. BMC physiology, 8(1), 3.
     P. C., Hefty, M. G., & Love, P. M. (2010). Building                Reinhart, C. F. (2004). Lightswitch-2002: a model for
     America best practices series: volume 7.1: guide to                    manual and automated control of electric lighting
     determining climate regions by county (No. PNNL-                       and blinds. Solar energy, 77(1), 15-28.
     17211 Rev. 1). Pacific Northwest National
                                                                        Reinhart, C.F., Walkenhorst, O., 2001. Dynamic
     Laboratory (PNNL), Richland, WA (US).
                                                                            RADIANCE-based daylight simulations for a full-
Belzer, D. B., Hadley, S. W., & Chin, S. M. (2008).                         scale test office with outer venetian blinds. Energy
     Impact of extended daylight saving time on national                    and Buildings 33 (7), 683–697.
     energy consumption. EERE Publication and Product
                                                                        Rivers, N. (2016). Does daylight savings time save
     Library, Washington, DC (United States).
                                                                            energy? Evidence from Ontario. Environmental and
Berk, M., Dodd, S., Hallam, K., Berk, L., Gleeson, J., &                    Resource Economics, 1-27.
     Henry, M. (2008). Small shifts in diurnal rhythms
                                                                        Shimoda, Y., Asahi, T., Taniguchi, A., & Mizuno, M.
     are associated with an increase in suicide: The effect
                                                                            (2007). Evaluation of city-scale impact of
     of daylight saving. Sleep and Biological Rhythms,
                                                                            residential energy conservation measures using the
     6(1), 22-25.
                                                                            detailed end-use simulation model. Energy, 32(9),
Gurevitz, M. (2007, March). Daylight Saving Time.                           1617-1633.
     Congressional Research Service, Library of
                                                                        Time and Date AS. (2016, 02 23). Daylight Saving Time
     Congress.
                                                                            Statistics.      Retrieved      9      7,      2017:
Hill, S. I., F. Desobry, E. W. Garnsey, and Y-F. Chong.                     https://www.timeanddate.com/time/dst/statistics.ht
     "The impact on energy consumption of daylight                          ml
     saving clock changes." Energy Policy 38, no. 9
                                                                        U.S. Department of Energy. (2014, 03 7). Commercial
     (2010): 4955-4965.
                                                                            Reference Buildings. Retrieved 9 7, 2017, from
Hopfe, C. J., & Hensen, J. L. (2011). Uncertainty                           Office of Energy Efficiency and Renewable
     analysis in building performance simulation for                        Buildings:
     design support. Energy and Buildings, 43(10),                          https://energy.gov/eere/buildings/commercial-
     2798-2805.                                                             reference-buildings
Jiddou, M. R., Pica, M., Boura, J., Qu, L., & Franklin, B.              Varughese, J., & Allen, R. P. (2001). Fatal accidents
    A. (2013). Incidence of myocardial infarction with                      following changes in daylight savings time: the
    shifts to and from daylight savings time. American                      American experience. Sleep medicine, 2(1), 31-36.
    Journal of Cardiology, 111(5), 631-635.
                                                                        Yacker, H. G. (1998, February). Daylight Saving Time.
Kandel, A., & Metz, D. (2001). Effects of daylight                          Congressional Research Service, Library of
    saving time on California electricity use. California                   Congress.
    Energy Commission.
Kandel, A., & Sheridan, M. (2007). The effect of early
    daylight saving time on California electricity

© 2018 ASHRAE (www.ashrae.org) and IBPSA-USA (www.ibpsa.us).                                                                             27
For personal use only. Additional reproduction, distribution, or transmission in either print or digital form is not permitted without
ASHRAE or IBPSA-USA's prior written permission.
Table 2 Appendix simulation outputs
TOTAL ENERGY(KWH) SOUTH TOTAL ENERGY(KWH)
WITH W/O WITH W/O
ZONE STATE CITY % DIFF % DIFF
DST DST DST DST
1 Florida Miami 221.18 220.41 -0.3 36.34 35.98 -1.0
1 Hawaii Honolulu 214.96 214.55 -0.2 33.42 33.29 -0.4
2 Arizona Phoenix 214.05 213.21 -0.4 35.18 34.66 -1.5
2 Louisiana New Orleans 193.75 194.93 0.6 27.86 27.93 0.2
2 Texas Houston 192.54 191.96 -0.3 27.15 27.01 -0.5
3 Alabama Montgomery 180.47 180.98 0.3 23.48 23.83 1.5
3 Arkansas Little Rock 187.28 186.95 -0.2 25.81 25.44 -1.4
3 California San Francisco 125.47 125.40 -0.1 8.32 8.35 0.4
3 Georgia Atlanta 174.70 173.30 -0.8 21.90 21.20 -3.3
3 Mississippi Jackson 181.62 181.37 -0.1 23.98 23.80 -0.8
3 North Carolina Charlotte 172.25 170.65 -0.9 20.97 20.80 -0.8
3 Oklahoma Oklahoma City 179.75 179.83 0.0 23.28 23.16 -0.5
3 South Carolina Charleston 182.16 182.31 0.1 24.39 24.28 -0.4
4 Delaware Wilmington 172.91 173.45 0.3 21.67 21.60 -0.3
4 Kansas Wichita 174.90 174.19 -0.4 21.96 21.77 -0.8
4 Kentucky Louisville 179.76 178.55 -0.7 23.40 22.91 -2.2
4 Maryland Baltimore 172.87 172.48 -0.2 21.35 21.09 -1.2
4 Missouri Kansas City 182.18 182.18 0.0 24.16 23.87 -1.2
4 New Jersey Trenton 174.59 174.70 0.1 22.36 22.28 -0.4
4 New Mexico Albuquerque 163.98 164.46 0.3 18.35 18.30 -0.3
4 Oregon Portland 148.26 147.82 -0.3 15.38 15.40 0.1
4 Tennessee Nashville 179.93 179.59 1.0 23.46 23.40 -0.3
4 Virginia Richmond 173.25 173.78 0.3 21.41 21.47 0.3
4 Washington Seattle 143.51 142.95 -0.4 14.02 13.76 -1.9
4 West Virginia Charleston 173.74 173.11 -0.4 21.88 21.72 -0.8
5 Colorado Denver 166.50 167.27 0.5 19.52 19.73 1.1
5 Connecticut Hartford 171.03 171.71 0.4 21.41 21.44 0.2
5 Iowa Des Moines 189.60 189.66 0.0 26.66 26.53 -0.5
5 Idaho Boise 167.28 166.75 -0.3 20.29 20.02 -1.4
5 Illinois Chicago 181.23 181.32 0.0 24.40 24.45 0.2
5 Indiana Indianapolis 184.83 183.59 -0.7 25.62 25.04 -2.3
5 Massachusetts Boston 167.23 167.46 0.1 20.33 20.42 0.5
5 Michigan Detroit 180.39 179.42 -0.5 24.54 24.39 -0.6
5 Nebraska Omaha 188.19 188.32 0.1 26.77 26.58 -0.7
5 Nevada Reno 164.90 164.75 -0.1 18.75 18.55 -1.0
5 New York Syracuse 176.04 175.83 -0.1 23.32 23.26 -0.3
5 Ohio Cleveland 178.61 178.15 -0.3 24.57 24.20 -1.5
5 Pennsylvania Pittsburgh 171.36 170.71 -0.4 21.79 21.62 -0.8
5 Rhode Island Providence 169.40 169.31 -0.1 20.89 20.87 -0.1
6 Utah Salt Lake City 168.22 168.28 0.0 19.98 19.95 -0.2
6 Maine Bangor 180.91 181.47 0.3 24.77 24.94 0.7
6 Minnesota Minneapolis 192.64 192.55 0.0 27.65 27.51 -0.5
6 Montana Helena 171.73 171.16 -0.3 21.29 20.98 -1.5
6 New Hampshire Concord 178.94 179.26 0.2 23.59 23.70 0.4
6 South Dakota Sioux Falls 191.43 190.87 -0.3 27.08 26.95 -0.5
6 Vermont Burlington 180.13 180.47 0.2 24.60 24.91 1.3
6 Wisconsin Milwaukee 180.93 181.21 0.2 24.67 24.77 0.4
6 Wyoming Cheyenne 162.15 163.06 0.6 18.50 18.67 0.9
7 Alaska Anchorage 195.15 193.76 -0.7 30.69 30.68 -0.1
7 North Dakota Fargo 207.03 206.17 -0.4 32.06 31.98 -0.3
© 2018 ASHRAE (www.ashrae.org) and IBPSA-USA (www.ibpsa.us). 28
For personal use only. Additional reproduction, distribution, or transmission in either print or digital form is not permitted without
ASHRAE or IBPSA-USA's prior written permission.You can also read