Does Social Exclusion Improve Detection of Real and Fake Smiles? A Replication Study
←
→
Page content transcription
If your browser does not render page correctly, please read the page content below
BRIEF RESEARCH REPORT
                                                                                                                                   published: 28 January 2021
                                                                                                                             doi: 10.3389/fpsyg.2021.626087

                                            Does Social Exclusion Improve
                                            Detection of Real and Fake Smiles?
                                            A Replication Study
                                            Simon Schindler* and Martin Trede
                                            Department of Psychology, University of Kassel, Kassel, Germany

                                            Research on social exclusion suggests an increased attention of excluded persons
                                            to subtle social cues. In one study (N = 32), published in Psychological Science,
                                            Bernstein et al. (2008) provided evidence for this idea by showing that participants in the
                                            social exclusion condition were better in correctly categorizing a target person’s smile
                                            as real or fake. Although highly cited, this finding has never been directly replicated.
                                            The present study aimed to fill that gap. 201 participants (79.1% female) were randomly
                                            assigned to a social exclusion, social inclusion or control condition. Next, participants
                                            watched 20 videos of smiling persons and rated whether they show a real or a fake
                                            smile. In line with the original study, results showed that participants in the exclusion
                          Edited by:        condition performed better than in the control condition. However, the performance did
         Stephanie Judi-Ann Tobin,          not differ between the exclusion and inclusion condition—although the pattern was in
Queensland University of Technology,
                            Australia
                                            the predicted direction. In sum, the findings of our study increase rather than decrease
                      Reviewed by:
                                            confidence in the validity of the investigated idea, but results point to a substantially
           Michael Jason Bernstein,         smaller effect.
  Penn State Abington, United States
                       Selma Rudert,        Keywords: social exclusion, ostracism, need to belong, replication, smiles
       University of Koblenz Landau,
                            Germany
                  *Correspondence:
                                            INTRODUCTION
                      Simon Schindler
              schindler@uni-kassel.de       Social exclusion threatens the basic need to belong and is therefore suggested to trigger adaptive
                                            mechanisms (Baumeister and Leary, 1995; Williams, 2009). One such mechanism refers to the
                  Specialty section:        activation of the social monitoring system (Pickett and Gardner, 2005) meaning searching the
        This article was submitted to       environment for information relevant to restoring need satisfaction and increase careful processing
   Personality and Social Psychology,       of that information. In other words, individuals are more attentive to signals and cues that
               a section of the journal     indicate possible exclusion or rejection. In line with this idea, Pickett et al. (2004) found that
               Frontiers in Psychology
                                            people with a higher dispositional need for belonging are better at distinguishing facial expressions
       Received: 04 November 2020           (angry, anxious, happy, and sad) or vocal tones (positive vs. negative). Gardner et al. (2000) could
        Accepted: 08 January 2021
                                            further show that excluded persons have a better memory for socially relevant information than
        Published: 28 January 2021
                                            non-excluded persons. More recently, Eck et al. (2020) showed that excluded individuals base
                            Citation:       their veracity judgments less on stereotypical non-verbal cues if message content is affiliation-
     Schindler S and Trede M (2021)
                                            relevant. These cases suggest that people show increased attention to social cues when they fear
      Does Social Exclusion Improve
  Detection of Real and Fake Smiles?
                                            or experience rejection.
                 A Replication Study.           Bernstein et al. (2008) tested this idea by investigating how well people can distinguish between
          Front. Psychol. 12:626087.        a real and a fake smile after social exclusion. Assuming an increased attention of excluded persons
    doi: 10.3389/fpsyg.2021.626087          to subtle social cues and that facial expressions of emotion can act as such social cues, they expected

Frontiers in Psychology | www.frontiersin.org                                    1                                   January 2021 | Volume 12 | Article 626087
Schindler and Trede Detection of Real and Fake Smiles
that excluded people have an increased ability to distinguish smiles, compared to participants in the inclusion condition as
between a real and fake smile. Research showed that Duchenne well as participants in the control group. Going beyond the study
smiles (i.e., smiles that are formed by flexing facial muscles of Bernstein et al. (2008), we included a measure of need to belong
making the eyes’ corners wrinkle up with crow’s feet) were as a potential moderatoring variable (cf., Pickett et al., 2004).
associated with self-reported pleasure and enjoyment and were
generally rated more positively than non-Duchenne smiles (i.e.,
smiles that are formed with no contraction of the muscles of METHOD
the corner of the eyes; Ekman et al., 1990; Gunnery and Ruben,
2016). In addition, the same brain regions that are activated Ethics and Transparency Statements
when experiencing a positive emotion seem to be activated The study was conducted in full accordance with the Ethical
when forming a Duchenne smile, unlike other types of smiles Guidelines of the German Association of Psychologists (DGPs)
(Ekman et al., 1990). In contrast, the non-Duchenne smile can and the American Psychological Association (APA). Moreover,
be used to hide or mask negative emotions (Ekman et al., by the time the data were acquired it was also not required at
1988). Results from Krumhuber et al. (2007) and Johnston et al. Kassel University, nor at most other German universities to seek
(2010) showed that people who showed a real, authentic smile ethics approval for simple studies on personality and attitudes.
were considered more trustworthy and positive compared to The study exclusively makes use of anonymous questionnaires.
people who showed a fake smile. Furthermore, subjects were No identifying information was obtained from participants. The
more likely to cooperate with people who showed a real smile participants were explicitly informed that the data are treated
(Johnston et al., 2010) and were more likely to choose them for confidentially. Furthermore, they could withdraw from the study
a “trust game” (Krumhuber et al., 2007). Bernstein et al. (2008) at any time. Participants answers and the effects on need threat
concluded that distinguishing real from fake emotions seems revealed that psychological discomfort through thinking of being
especially important to socially excluded individuals to ensure socially excluded was not particularly strong. Data, material, and
that reaffiliation efforts are maximally distributed toward people the preregistration protocol of the study are available on the OSF1 .
displaying genuine affiliative cues. Therefore, directing resources
toward an individual faking an affiliative display would likely be
a costly error for socially rejected individuals, who already find
Materials
themselves in a perilous situation. Social Status Manipulation
According to their hypothesis, in one study (N = 32), Bernstein Participants were randomly assigned to one of the three
et al. (2008) showed that participants in the exclusion condition experimental conditions (exclusion vs. inclusion vs. control). In
showed a significantly better discrimination ability (M = 1.88, one essay task, participants were asked to write about a time
SD = 0.62) than participants in the control condition (M = 1.05, they felt “rejected or excluded,” “accepted or included,” or “their
SD = 0.56) and participants in the inclusion condition (M = 1.34, morning yesterday.”
SD = 0.56). They found no significant differences between the
control and inclusion conditions. Visual Stimuli
We believe that directly replicating this study is important The facial stimuli were those used in Bernstein et al. (2008)
for several reasons: first, the high estimated prevalence of and were obtained from the BBC science and nature website
questionable practices in past social psychological research (BBC – Science & Nature – Human Body and Mind – Spot The
asks for direct replication of prior studies (John et al., 2012; Fake Smile, 2015). Participants watched 20 videos (approximately
Simonsohn et al., 2014; Schindler et al., 2021)— especially when 4 s each) one at a time, each depicting an individual with an
not preregistered and when having used small samples as in initially neutral expression that shifted to a smiling expression,
the present case (i.e., about 10 participants per cell). Second, that then returned to a neutral expression (10 Duchenne and
the article of Bernstein et al. (2008) can be described as highly 10 non-Duchenne smiles). Thirteen men and seven women were
influential (more than 300 citations on google scholar). Third, the depicted in the videos. The stimuli included three minority-group
idea that social exclusion enhances attention to social cues has individuals. Removing data for these targets from analyses did
important theoretical implications for our basic understanding not change any findings.
of human nature and the role of group affiliation. However,
the evidence on this idea is based on a handful of studies. Need Threat
For example, Bernstein et al. (2010) conceptually replicated the In the study of Bernstein et al. (2008), participants responded to
findings of Bernstein et al. (2008) by showing that participants in a scale assessing the degree to which they felt a threat to their
the social exclusion condition indicated a greater preference to sense of belonging referring to the work of Williams et al. (2000).
work with individuals displaying real (vs. fake) smiles. However, However, Williams and colleagues measured of belongingness
there has not been a direct replication. So, a direct replication of toward other players in a cyberball game. It is obvious that
the study of Bernstein et al. (2008) makes a valuable contribution these measures are not suitable for the exclusion manipulation
by increasing or decreasing confidence in this idea. of Bernstein et al. (2008). Unfortunately, Bernstein et al. (2008)
Parallel to the original study by Bernstein et al. (2008), we did not report the wording of their used scale. Therefore, as a
hypothesized that participants in the exclusion condition will
show an enhanced ability to discriminate between real and fake 1
https://osf.io/paedq/
Frontiers in Psychology | www.frontiersin.org 2 January 2021 | Volume 12 | Article 626087Schindler and Trede Detection of Real and Fake Smiles
manipulation check for social status, we used items of the Actual- because they met the exclusion criteria specified in the pre-
Desired Need State Scale (ADNS; Eck et al., 2017)—a measure registration: eight participants were excluded because they did
consisting of twelve items referring to the difference between an not give a meaningful answer in the essay task manipulation
actual and a desired state regarding four central needs: belonging (i.e., any answer that could not be interpreted in a reasonable
(e.g., “I do not have as strong a sense of belonging as I would way and that could not be plausibly related to the questions
like”), self-esteem (e.g., “I have the feeling that others think worse in the broadest sense; e.g., “Can’t remember an event.”); two
of me than I would like”), control (e.g., “I have a feeling of participants were excluded because they correctly recognized the
having too little control over what is going on around me”), background of the study; five participants were excluded because
and meaningful existence (e.g., “I have a feeling of being less they reported technical problems playing the videos and were
important at the moment than I wish”). The scale ranged from unable to complete the task properly; four participants were
1 (not true at all) to 7 (completely true). Reliability for threat to excluded because they had previously participated in a similar
belonging was acceptable (α = 0.69) and higher for all twelve experiment to distinguish between real and fake smiles.
items (α = 0.89).
Need to Belong RESULTS
As a potential moderator, need to belong was measured with the
German version of Leary et al. (2013) Need to Belong Scale (NBS) Need Threat
by Hartung and Renner (2014). The scale consisted of ten items To examine whether the social status manipulation affected
(e.g., “I have a strong need to belong”) and values ranged from 1 fundamental needs, we conducted a one-way between-subjects
(strongly disagree) to 5 (strongly agree). Reliability was acceptable ANOVA on the belonging threat. Although need for belonging
(α = 0.75). was descriptively higher in the exclusion condition (M = 3.71,
SD = 1.23) compared to the inclusion condition (M = 3.34,
SD = 1.21) and the control condition (M = 3.53, SD = 1.20), the
Procedure three conditions did not significantly differ from each other, F(2,
The survey took about 13 min to complete and could be 198) = 1.41, and p = 0.247. Simple effect analyses also revealed
conducted with a laptop or smartphone. After agreeing to no significant differences, all ps > 0.095. There was further no
informed consent, participants were randomly assigned to one significant effect of the manipulation on the whole ADNS scale,
of the three experimental conditions. Next they answered the F(2, 198) = 1.05, and p = 0.352.
ADNS Items. Finally, participants watched each video in a
random order and indicated, whether the smile was “genuine”
Discrimination Scores
or “fake” by choosing one of these options after each video.
Parallel to Bernstein et al. (2008), we calculated d’, a signal
Upon completion of this task, participants responded to the NBS
detection measure examining the ability to discriminate stimuli—
and demographic questions before being probed for suspicion or
in this case, the ability to discriminate Duchenne smiles from
previous participation in a similar experiment and were thanked.
non-Duchenne smiles. This measure simultaneously considers
hits (correctly identifying a Duchenne smile as genuine) and
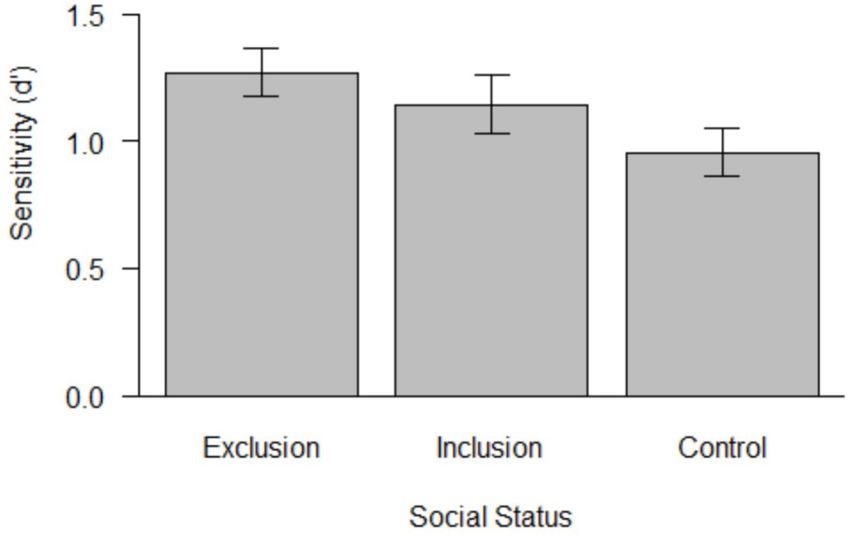
Participants false alarms (incorrectly identifying a non-Duchenne smile as
In the study of Bernstein et al. (2008), the effect sizes of the two genuine) in the calculation (Stanislaw and Todorov, 1999). The
statistical contrasts were large with d = 1.41 (95% CI = [0.45, following scores were obtained (see Figure 1): M excl. = 1.27
2.36], for exclusion vs. control condition) and d = 0.91 (95%
CI = [0.02, 1.81]; for exclusion vs. inclusion condition). The
one-way analysis of variance (ANOVA) revealed an effect size
of d = 1.25 with a p value of 0.009. As small sample studies
are likely to overestimate the true effect and given the large
confidence intervals of the found effects, we decided to assume
a moderate effect of d = 0.5. An a priori power analysis for a one-
way ANOVA (3 groups, alpha = 0.05, and f = 0.25) suggested
including 207 participants to detect a significant effect with
90% power. Participants were randomly assigned to the three
experimental conditions (exclusion vs. inclusion vs. control).
That is, with about 70 participants per cell, we multiplied the
original cell size by seven.
The data collection took place from the beginning of May until
the end of July 2020. Participants were recruited mainly through
social networks (e.g., Facebook) and personal contacts. The final
sample consisted of 201 participants (159 female, M age = 25.72, FIGURE 1 | Mean ability to discriminate (sensitivity, d’) Duchenne and
non-Duchenne smiles as a function of social status condition. Error bars
SD = 6.46, and range: 17–57; 73.1% students). Nineteen of the
indicate standard errors.
original 220 participants were excluded from the data analysis
Frontiers in Psychology | www.frontiersin.org 3 January 2021 | Volume 12 | Article 626087Schindler and Trede Detection of Real and Fake Smiles
(SD = 0.77), M incl. = 1.14 (SD = 0.87), and M control = 0.95 especially because unconscious processes can be assumed that
(SD = 0.84). This basically replicates the descriptive pattern of are difficult to assess with explicit measures (Eck et al., 2020).
Bernstein et al. (2008). The one-way ANOVA on d’ was not It is therefore questionable whether self-report measures on
significant, F(2,198) = 2.69, p = 0.070, and d = 0.33. A Bayesian need threat are generally capable to capture the activation and
analysis revealed a BF10 of 0.56, favoring the null hypothesis operation of the social monitoring system.
(Lee and Wagenmakers, 2013). Additional simple effects analyses Due to missing information in the original article, we used
showed that participants in the excluded condition scored different items to assess need threat. These items referred
significantly better compared to participants in the control to participants’ experience at the present moment, that is,
condition, M diff = 0.32, 95% CI M = [0.04, 0.59], p = 0.023, after they thought and wrote about a respective event. This
d = 0.32, but not compared to participants in the inclusion might be problematic—especially with autobiographic threat
condition, M diff = 0.13, 95% CI = [−0.17, 0.42], p = 0.394, and manipulations, because need threat represents negative feelings
d = 0.12. Participants in the included condition did not differ as a consequence of social exclusion. Thus, one could argue that
significantly in their sensitivity measure from participants the need threat represents a dependent variable rather than a valid
control condition, M diff = 0.19, 95% CI = [−0.09, 0.47], p = 0.190, manipulation check (as labeled by Bernstein et al., 2008). As a
and d = 0.18. more valid manipulation check, we coded participants’ written
answers according to our three experimental conditions: being
Need to Belong excluded, being included, neutral. In the exclusion condition,
Need to belong was not significantly affected by the social status 98.5% of the answers were coded as “being excluded” and 1.5%
manipulation, F(2, 198) = 0.64, p = 0.531. We conducted a as “neutral.” In the inclusion condition, all of the answers were
moderated regression on d’ with the experimental conditions coded as “being included.” In the neutral condition, 83.1% were
(as dummy coded variables with the exclusion condition as coded as “neutral,” 15.6% as “being included” and 1.3% as “being
the reference category), need to belong as continuous predictor excluded.” Accordingly, our manipulation can be regarded as
(z-transformed) and the interaction terms. The moderated successful. Interestingly, 56.1% of the answers in the inclusion
regression again showed a significant main effect of the exclusion condition also referred to some kind of uncertainty (which was
vs. control condition dummy variable, b = −0.33, p = 0.016, then reduced by being included). Thus, the inclusion condition
and no significant main effect of the inclusion vs. exclusion appears to be contaminated by thoughts about negative social
condition dummy variable, b = −0.14, and p = 0.362. There events. The most adequate test for our hypothesis therefore
was no significant main effect of need to belong, b = 0.12, refers to the comparison between the exclusion and the neutral
p = 0.213. Including the two interaction terms revealed no condition—and this comparison revealed a significant result in
significant interaction effects, bincl . = −0.06, p = 0.675, and favor of the hypothesis. Nevertheless, future research should
bcontrol = −0.026, p = 0.849. apply stronger, validated manipulations that are based on an
actually induced exclusion experience (e.g., cyberball; Williams
et al., 2000) rather than remembering a past exclusion experience.
DISCUSSION We further tested the moderation role of need to belong,
because this variable was found to be positively related to
The main goal of this study was to directly replicate the results of distinguishing various facial expressions or vocal tones (Pickett
the study by Bernstein et al. (2008). The main hypothesis being et al., 2004). However, in our study, need to belong was unrelated
tested was that being socially excluded enhances the ability to to discrimination performance and also did not moderate effects
correctly distinguish between real and fake smiles. This was based of social status.
on the assumption that excluded individuals should have a higher Bernstein et al. (2008) did not report specific sample
sensitivity to social cues. The original study showed the expected characteristics but mentioned that their participants were
significant discrimination differences between the exclusion and undergraduates. This might indicate that participants were a little
inclusion condition as well as between the exclusion and neutral younger (about 20 years old) than in the present study (mean
conditions. Both comparisons showed higher discrimination age of about 26 years). Interestingly, there is evidence for age-
scores for participants in the exclusion condition. These results related changes in the effect of being socially excluded. Pharo
were only partially confirmed in the present study. While the et al. (2011), for example, found that adolescents and emerging
descriptive pattern mirrored the findings of Bernstein et al. adults experienced increased sensitivity to social exclusion (i.e.,
(2008), the ANOVA was not significant but only approached a ostracism) relative to older participants (of about the age as in
significant level. Simple effect analyses revealed that participants our study). This would provide another explanation for a lower
in the exclusion condition were significantly better compared effect size in our study compared to the study of Bernstein et al.
to participants in the control condition, but not compared to (2008). At the same time, it seems reasonable to assume that social
participants in the inclusion condition. exclusion does always hurt—independent from the age—so, the
In contrast to Bernstein et al. (2008), there was no evidence role of age remains speculative.
for an effect of the social exclusion manipulation on need threat. Compared to the original study (N = 32), our study (N = 201)
Given that there is some support for the effect of the manipulation included nearly seven times more participants. We had 90%
on the main dependent variable, an effect on self-reported power to detect a moderate effect of d = 0.5. Given that the
need satisfaction may not be required (Sigall and Mills, 1998), original study reported an effect of d = 1.25, our sample size
Frontiers in Psychology | www.frontiersin.org 4 January 2021 | Volume 12 | Article 626087Schindler and Trede Detection of Real and Fake Smiles
seemed as a conservative choice. Nevertheless, it is important to present study makes an important contribution by directly
note that effect sizes are decreased by error variance and there replicating an influential small-N study of Bernstein et al. (2008).
are plausible reasons why there was higher error variance in our Overall, our findings increase rather than decrease confidence
study. First, we collected data online, thus, we had no control in the validity of the investigated idea, but results point to a
under which circumstances participants completed the study (via substantially smaller effect.
smartphone outside vs. at a PC at home). Given that the study
was about recalling an experience of being socially rejected and
on judging short videos, concentration and motivation might be DATA AVAILABILITY STATEMENT
lower in online studies adding error variance. Nevertheless, we
chose to collect data online for several reasons: First, we could The datasets presented in this study can be found in online
obtain larger sample sizes than by recruiting on campus. Second, repositories. The names of the repository/repositories and
online studies have become popular (Sassenberg and Ditrich, accession number(s) can be found below: https://osf.io/paedq/.
2019) and it is important for future research to know if and how
findings can be replicated. Last but not least, data collection in the
lab was currently impossible due to the Corona pandemic.
This points to another potential source for error variance: ETHICS STATEMENT
context effects of the Corona pandemic. One might speculate
Ethical review and approval was not required for the study on
that in these times concerns about being socially isolated are
human participants in accordance with the local legislation and
generally heightened leading to problems regarding a proper
institutional requirements. The patients/participants provided
control condition. However, there is no strong evidence for
their written informed consent to participate in this study.
this claim. First, we checked the answers in the social status
manipulation for the words “Corona” or “pandemic” and there
was only one participant (in the inclusion condition) who
mentioned the word “Corona.” Second, data collection took place AUTHOR CONTRIBUTIONS
from May to July. In this time, the situation was highly under
control in Germany: Kids were going back in school, people went Both authors listed have made a substantial, direct and
on vacation, and patrons visited bars and restaurants. Open-air intellectual contribution to the work, and approved it
baths were accessible, and yet the number of infections remained for publication.
quite stable at a low level, so that highly threatening information
about the pandemic in Germany was rarely present in the news.
Nevertheless, we cannot exclude that data collection during the FUNDING
pandemic did not add some error variance.
So far, only a few studies directly addressed the idea We received funds for open access publication fees from the
that social exclusion enhances attention to social cues. The University of Kassel.
REFERENCES Ekman, P., Friesen, W. V., and O’Sullivan, M. (1988). Smiles when lying. J. Pers.
Soc. Psychol. 54, 414–420. doi: 10.1037/0022-3514.54.3.414
Baumeister, R. F., and Leary, M. R. (1995). The need to belong: desire for Gardner, W. L., Pickett, C. L., and Brewer, M. B. (2000). Social exclusion and
interpersonal attachments as a fundamental human motivation. Psychol. Bull. selective memory: How the need to belong influences memory for social events.
117, 497–529. doi: 10.1037/0033-2909.117.3.497 Pers. Soc. Psychol. Bull. 26, 486–496. doi: 10.1177/0146167200266007
BBC – Science & Nature – Human Body and Mind – Spot The Fake Smile (2015). Gunnery, S. D., and Ruben, M. A. (2016). Perceptions of Duchenne and non-
BBC - Science & Nature - Human Body and Mind - Spot The Fake Smile. Duchenne smiles: a meta-analysis. Cogn. Emot. 30, 501–515. doi: 10.1080/
Available online at: http://www.bbc.co.uk/science/humanbody/mind/surveys/ 02699931.2015.1018817
smiles/ (accessed February 10, 2015) Hartung, F.-M., and Renner, B. (2014). The need to belong and the relationship
Bernstein, M. J., Sacco, D. F., Brown, C. M., Young, S. G., and Claypool, H. M. between loneliness and health. Zeitschrift Für Gesundheitspsychol. 22, 194–201.
(2010). A preference for genuine smiles following social exclusion. J. Exp. Soc. doi: 10.1026/0943-8149/a000129
Psychol. 46, 196–199. doi: 10.1016/j.jesp.2009.08.010 John, K. J., Loewenstein, G., and Prelec, D. (2012). Measuring the
Bernstein, M. J., Young, S. G., Brown, C. M., Sacco, D. F., and Claypool, prevalence of questionable research practices with incentives for truth
H. M. (2008). Adaptive responses to social exclusion: social rejection improves telling. Perspect. Psychol. Sci. 23, 524–532. doi: 10.1177/095679761143
detection of real and fake smiles. Psychol. Sci. 19, 981–983. doi: 10.1111/j.1467- 0953
9280.2008.02187.x Johnston, L., Miles, L., and Macrae, C. N. (2010). Why are you smiling at me? Social
Eck, J., Schoel, C., and Greifeneder, R. (2017). Belonging to a majority reduces the functions of enjoyment and non-enjoyment smiles. Br. J. Soc. Psychol. 49(Pt 1),
immediate need threat from ostracism in individuals with a high need to belong. 107–127. doi: 10.1348/014466609X412476
Eur. J. Soc. Psychol. 47, 273–288. doi: 10.1002/ejsp.2233 Krumhuber, E., Manstead, A. S. R., Cosker, D., Marshall, D., Rosin, P. L.,
Eck, J., Schoel, C., Reinhard, M. A., and Greifeneder, R. (2020). When and why and Kappas, A. (2007). Facial dynamics as indicators of trustworthiness
being ostracized affects veracity judgments. Pers. Soc. Psychol. Bull. 46, 454–468. and cooperative behavior. Emotion 7, 730–735. doi: 10.1037/1528-3542.7.
doi: 10.1177/0146167219860135 4.730
Ekman, P., Davidson, R. J., and Friesen, W. V. (1990). The Duchenne smile: Leary, M. R., Kelly, K. M., Cottrell, C. A., and Schreindorfer, L. S. (2013). Construct
emotional expression and brain physiology. II. J. Pers. Soc. Psychol. 58, 342–353. validity of the need to belong scale: mapping the nomological network. J. Pers.
doi: 10.1037/0022-3514.58.2.342 Assess. 95, 610–624. doi: 10.1080/00223891.2013.819511
Frontiers in Psychology | www.frontiersin.org 5 January 2021 | Volume 12 | Article 626087Schindler and Trede Detection of Real and Fake Smiles Lee, M. D., and Wagenmakers, E.-J. (2013). Bayesian Cognitive Modeling: A Simonsohn, U., Nelson, L. D., and Simmons, J. P. (2014). P-curve: a key to the Practical Course. Cambridge: Cambridge University Press. file-drawer. J. Exp. Psychol. Gen. 143, 534–547. doi: 10.1037/a0033242 Pharo, H., Gross, J., Richardson, R., and Hayne, H. (2011). Age-related changes Stanislaw, H., and Todorov, N. (1999). Calculation of signal detection theory in the effect of ostracism. Soc. Influence 6, 22–38. doi: 10.1080/15534510.2010. measures. Behav. Res. Methods, Instrum. Comput. 31, 137–149. doi: 10.3758/ 525852 BF03207704 Pickett, C. L., and Gardner, W. L. (2005). The Social Monitoring System: Enhanced Williams, K. D. (2009). “Ostracism: a temporal need-threat model,” in Advances Sensitivity to Social Cues as an Adaptive Response to Social Exclusion. New York, in Experimental Social Psychology, Vol. 41, ed. M. P. Zanna (San Diego, CA: NY: Psychology Press. Elsevier Academic Press), 275–314. Pickett, C. L., Gardner, W. L., and Knowles, M. (2004). Getting a cue: the need Williams, K. D., Cheung, C. K. T., and Choi, W. (2000). Cyberostracism: effects of to belong and enhanced sensitivity to social cues. Pers. Soc. Psychol. Bull. 30, being ignored over the internet. J. Pers. Soc. Psychol. 79, 748–762. doi: 10.1037/ 1095–1107. doi: 10.1177/0146167203262085 /0022-3514.79.5.748 Sassenberg, K., and Ditrich, L. (2019). Research in social psychology has changed between 2011 and 2016: larger sample sizes, more self-report measures, and Conflict of Interest: The authors declare that the research was conducted in the more online studies. Adv. Methods Pract. Psychol. Sci. 2, 107–114. doi: 10.1177/ absence of any commercial or financial relationships that could be construed as a 2515245919838781 potential conflict of interest. Schindler, S., Reinhardt, N., and Reinhard, M.-A. (2021). Defending one’s worldviews under mortality salience – testing the validity of an Copyright © 2021 Schindler and Trede. This is an open-access article distributed established idea. J. Exp. Soc. Psychol. 93:104087. doi: 10.1016/j.jesp.2020.10 under the terms of the Creative Commons Attribution License (CC BY). The use, 4087 distribution or reproduction in other forums is permitted, provided the original Sigall, H., and Mills, J. (1998). Measures of independent variables and mediators author(s) and the copyright owner(s) are credited and that the original publication are useful in social psychology experiments: but are they necessary? Pers. Soc. in this journal is cited, in accordance with accepted academic practice. No use, Psychol. Rev. 2, 218–226. doi: 10.1207/s15327957pspr0203_5 distribution or reproduction is permitted which does not comply with these terms. Frontiers in Psychology | www.frontiersin.org 6 January 2021 | Volume 12 | Article 626087
You can also read