Draft Statewide Threat and Risk Assessment (TARA) - presentation 2017
←
→
Page content transcription
If your browser does not render page correctly, please read the page content below
Draft Statewide Threat and Risk Assessment (TARA)

Agenda
    Time            Session                             Lead
    10.00 – 10.05   Welcome and housekeeping            Program Leader

    10.05 – 10.20   Introduction and context            Senior Officer

    10.20 – 11.10   TARA process and outputs            Facilitator

    11.10 – 11.30   Using a risk matrix                 Facilitator

    11.30 – 12.00   Community engagement and making a   Program Leader
                    submission

    12.00 – 12.30   LUNCH

    12.30 – 12.50   TARA findings                       Facilitator

    12.50 – 14.20   Workshop TARA risk matrices         Facilitator

    14.20 – 14.30   Where to from here                  Program Leader
Session 1 – Introduction and Context

Introductory Video
Chair of the Marine Estate Management Authority
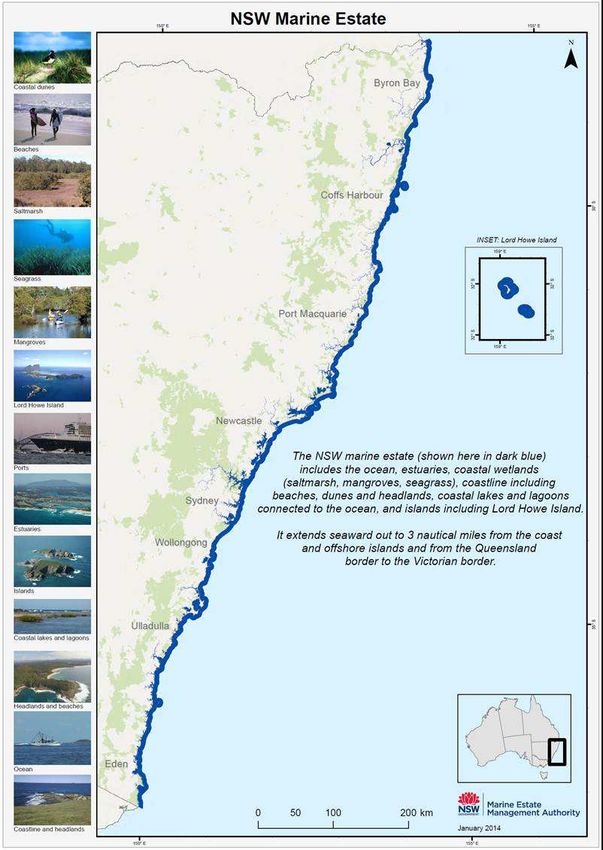
Our Marine Estate
•   1300km of coast extending 5.6km
    offshore
•   184 estuaries
•   Subtropical - temperate influences
•   85% of NSW population live within
    50km of the coast
•   11 coastal Aboriginal nations
•   6 marine parks, 12 aquatic reserves
7.5 million
people live along the NSW coastine
1,250 km
coastline
755
beaches
184
estuaries
1.8 million
people go boating each year
800,000
recreational fishers
$80 million
NSW wild fisheries annual catch
$6.5 billion
ports'' contribution to the NSW economy annually
ports
6
marine parks
12
aquatic reservesContext
• In June 2011 the Independent scientific audit
of marine parks in NSW was commissioned
to inform future Government policy.
• Two overarching recommendations:
• The governance of the NSW Marine Estate
be reorganised by bringing the entire
estate under one legislative and
administrative structure - MEMA was
established.
• Science for the NSW Marine Estate be
reorganised under an Independent
Scientific Committee - MEEKP
established.MEMA Agencies & Reporting
Minister for Primary Industries Minister for the Environment
Marine Estate Management Authority (MEMA)
Independent Chair – Dr Wendy Craik AM
Dept of Industry Office of Dept Planning MEEKP
Transport for NSW
Environment & &
(Primary Industries) (Maritime) Chair
Heritage Environment
Marine Estate Marine Marine Estate
Estate
Agency Steering Committee Expert Knowledge Panel
Secretariat
(MASC) (DPI) (MEEKP)
Interagency Working Groups
(IWG)Legislation
• Marine Estate Management Act 2014
• Marine Estate Management Regulation 2009
• Marine Estate Management (Management Rules) Regulation 1999
The objects of the Act:
(a) to provide for the management of the marine estate of NSW consistent with the principles of
ecologically sustainable development in a manner that:
(i) promotes a biologically diverse, healthy and productive marine estate, and
(ii) facilitates:
• economic opportunities for the people of NSW, including opportunities for
regional communities, and
• the cultural, social and recreational use of the marine estate, and
• the maintenance of ecosystem integrity, and
• the use of the marine estate for scientific research and education,
(b) to promote the co-ordination of the exercise, by public authorities, of functions in relation
to the marine estate,
(c) to provide for the declaration and management of a comprehensive system of marine
parks and aquatic reserves.MEMA Vision
Healthy coast and sea,
managed for the greatest well-being of the
community, now and into the futureMEMA Projects
• Marine Estate Management Act & Regulations
• Marine estate community survey (2014)
• Threat & risk assessment framework (TARA)
• Hawkesbury Shelf Marine Bioregion assessment
• Marine estate threat & risk assessment
• Marine Estate Management Strategy
• Marine Park Pilots
• Social, Economic & Environmental Monitoring
ProgramDraft Statewide TARA
• The statewide TARA is:
• a key commitment of the NSW Government
• requirement under the MEM Act (every 10 yrs)
• Key input to the NSW Marine Estate Management
Strategy
• It’s development and implementation is a multi-
agency approach
• It is based on evidence (over 600 scientific reports) and
informed by community, industry and stakeholders
through various mechanisms
• Guided by MEMA and Expert Knowledge PanelFive step decision making process
Other Government reforms
There are several coastal and marine reforms underway in NSW at present. An integrated
approach is facilitated through various mechanisms including MEMA agency partnerships

•   Coastal reforms

•   Commercial fishing reforms

•   Biodiversity legislation review

•   Boating and infrastructure in NSW

•   Regional ports strategy development
Purpose of Workshops
•  Engage with stakeholders on the draft Statewide TARA report
•  Provide the community and stakeholders with:
       – an understanding of the TARA; and
       – the opportunity to :
       i. identify omissions or inaccuracies within the draft
       ii. review the evidence base used
       iii. give additional evidence to inform the finalisation of the TARA
       iv. provide local & regional examples where available
• Provide the community and stakeholders with an understanding of how to provide a
  submission and how their feedback will be used
• Outline timeframes for engagement
Session 2 – The TARA Process and Outputs
Introductory Video
TARA Risk Assessment Facilitator – Greg Fisk
What is a Threat and Risk Assessment?
Key Messages

• Process designed to identify, assess and prioritise
  threats and their associated risks to community
  benefits
• The output of the TARA is a risk register (threat vs
  benefits) that will be used to inform future
  management
Why has the TARA been done?
• Step 2 of the 5 Step Process - required by the Marine Estate
  Management Act (2014)
• Needed a tool for determining management priorities for the
  marine estate in a strategic and transparent way
• Evidence based approach highlights where knowledge is
  lacking and further information is needed
• Evidence can relate to both natural and social science
• Risk processes are useful for identifying and dealing with
  uncertainty – a significant issue for the marine estate
What is the difference between a
‘Threat’ and a ‘Risk’?
• A threat is an activity, event or process that poses a potential
  level of risk to an environmental asset or social or economic
  benefit.
• A stressor is a consequence of a threat activity that causes an
  adverse effect on an asset or benefit.
• A risk is the chance of something happening that will have an
  impact on achieving environmental, social or economic
  objectives.
Example of the Relationship between Threat
Activities, Stressors, Assets and Benefits in the TARA
How was the TARA developed?
•   MEMA developed the TARA Framework
    document to formalise the process
•   Drew on models from elsewhere –
    including the Great Barrier Reef Marine
    Park Outlook Report
•   TARA places a stronger emphasis on social
    and economic benefits
•   Underpinned by ISO 31000 – international
    standard for risk assessment
•   The Framework was run as a pilot in the
    Hawkesbury Shelf marine bioregion
•   It has now been applied across the State
    (the draft Statewide assessment)
Benefit Categories
Environmental Assets
Environmental Assets separated between:
• Estuaries
• Open Coasts and Marine Waters
Assets include:
• Clean Water
• Habitats (corals, seagrass, beaches, etc.)
• Protected species and communities (including protected
fish species, bird species, turtles and marine mammals)Benefit Categories Social Benefits • Participation • Safety, health and wellbeing including relaxation • Socialising and sense of community • Enjoyment • Enjoying the biodiversity and beauty of the marine estate • Consumptive use (catching a fish) • Cultural Heritage • Tangible • Intangible
Benefit Categories
Economic Benefits
• Indirect economic benefits (intrinsic and bequest values)
• Affects business viability (employment and value of
  production)
• Direct economic benefits (individual enjoyment value –
  consumer surplus)
Threats that affect the flow of benefits
•   Resource use (fishing, dredging, tourism activities, etc.)
•   Environmental stressors such as land-based water pollution
•   Conflicts between or among users
•   Climate change
•   Access
•   Public safety
•   Effects of Regulation
Risk Assessment Process in TARA
1. A threat to a benefit ‘actually being realised’
2. The risk assessment was completed based on a perception of
   the effectiveness of the current regulations
How were the risks determined?
• A series of workshops with experts
• At the workshops the MEMA and independent experts:
   – reviewed and agreed on categories of threats and benefits
      (across environment, social and economic)
   – formally assessed the consequence and likelihood for each
      threat to each benefit
   – assigned a risk level to that threat (minimal, low,
      moderate, high)
• Risks had to be justified by reviewing the evidence base
  contained in the background reports and from expert opinion
Evidence-Based Approach • Over 600 scientific references reviewed • Outputs of the Marine Estate Community Survey (2014) • Environmental TARA Background Report (2016) • Social and economic background information report on the NSW marine estate (Vanderkooi Consulting, 2015) • Sea countries of New South Wales: a benefits and threats analysis of Aboriginal people’s connections with the marine estate (Feary, 2015) • Subject matter expert opinion from independent experts that participated in the assessment
Example of the Output – Environmental TARA
Risk Matrix
Evidence Table – Environmental TARA
Seagrass in Estuaries
Example of the Output –
TARA Risk Matrix for Social Benefits
Evidence Table – Social and Economic TARA
‘Conflicts over resource access’ on the social benefit of ‘Safety,
health & wellbeing (including relaxation)’
Consequence
Spatial extent
Overall risk
Confidence
Decreasing
Local (site)
Likelihood
Increasing
Statewide
Temporal
1-2 years
A, L, I (?)
Regional
10 years
20 years
Cell no.
(C x L)
Stable
rating
Trend
(C)
(L)
Justification narrative/evidence
1 Moderate Possible Low Conflict between sectors relating to resource access and use is common L Local but 1-2 years Stable
across the state. While highly localised and sectoral (rather than common
community wide) these issues were considered to be of a moderate across the
consequence because they occur with sufficient frequency and regularity state in
to justify consideration at a state wide spatial scale. Specific examples localised
including the possible impacts to safety, health and wellbeing include: settings
• Safety: anecdotal reports of physical threats assaults and
intimidations between competing sectors or between individuals
within a sector and links between high value resources (esp.
abalone) and organised crime (expert opinion). Danger from
competing activities such as powered vessels and passive uses
(swimmers) [1]
• The Marine Estate Community Survey results identified danger to
swimmers from watercraft as the third priority social threat for the
NSW general population (31%) and the South East (36%) region.
Intercept survey participants in Hawkesbury / Pittwater shared this
third priority (23%). Impacts of fishing on snorkeling and Scuba
diving were identified as a lower priority threat [1].
• Health: implications for mental and physical health associated with
above mentioned conflict and dispute, especially within the
commercial fishing sector. FRDC study by King et al. highlighted the
impact of conflict between recreational and commercial fishers on
the mental health of fishers. In addition lack of bonding social capital
within the industry is having a detrimental impact on fisher health
and ability to engage with the community and policy makers [2, 3]
• Wellbeing (including relaxation): the relaxation benefits associated
with use of the coast can be threatened by competing use of coastal
land (e.g. development of the coastal zone) and restriction of public
access (e.g. through area closures, physical barriers, changes to
access arrangements such as roads etc.). An upcoming report into
recreational fishing motivations highlights the importance of
relaxation and escape as a key motivation of the vast majority of
recreational fishers throughout the state. Barriers identified through
this study included concerns associated with conflict with
commercial fishing and loss of access through MPAs [4].Limitations of the draft Statewide TARA �
• � Lack of basic information and evidence – knowledge gaps about
baseline extent and conditions, about how the estate is being used
and enjoyed
• � Lack of applied knowledge about the effect of threats on benefits
including for example the carrying capacity or resilience of systems
to change
• � Subjective in terms of the issues, what people value about the
marine estate and the effectiveness of management controls
• � Is a starting point to be improved over time as it continues and
more knowledge and expertise is developed (10 yearly assessment
legislated)Additional Information Collected About Risks �
1. Assessed if the identified risks were occurring -
• Now - currently or in the short term (1-2 years)
• In the longer term future (e.g. in 20 years)
• For climate change - considered risks at 50 years from the current
time (2066)
2. Trend in the risk – Was it Increasing, Decreasing or Stable?
3. The geographic extent of the risk of the threat being realised –
• Highly localised
• Local
• Regional
• Region specific
• StatewideSpatial Extent of Risks �
Term Definition Example
Highly Localised Risk Occurring at a site/premises scale or • Impacts of thermal discharges from an
otherwise only occurring at a very small industrial facility
number of defined locations along the
coast
Localised Risk Occurring within or across regions but at • Impacts on the marine environment from
a localised scale (e.g. effecting parts of port and shipping operations
an estuary) or otherwise at a limited • Impacts from 4WD on beaches
number of locations (operating in a small
number of estuaries)
Regional Risk Generally occurring across the whole or • The majority of impacts will be in this
large parts of a region but does not category
constitute a Statewide risk
Statewide Risk A regional risk that is occurring in a • Water pollution associated with urban
widespread manner at a similar scale stormwater runoff
and intensity across all three regionsWhat is our level of confidence in the risk rating based on the evidence? • Adequate – there is adequate, high quality evidence in the region (A) • Limited – there is limited evidence, for example, there may be limited evidence for the region but evidence for other parts of the state (L) • Inferred – there is very limited evidence, for example, there may be limited evidence for the state, but evidence from elsewhere (I) • MEMA has identified ‘inferred risk ratings’ as key knowledge gaps
So what comes
next?
Step 2 – Draft TARA provided for public
comment and collection of additional
evidence

Step 3 – MEMA agencies ‘Assess current    Next
management’ prior to developing           Step

management responses
Risk Tolerance �
Risk Levels   Description                          Likely Management Action
              Risk currently acceptable but        Existing control measures (if any) are
              trend in the risk to be tracked      suitable
Minimal       over time                            Monitoring of risk likelihood and
                                                   consequence over time to identify if risk is
                                                   increasing, decreasing or staying the same
              Risk likely to be acceptable but     Existing control measures are suitable at the
              trend in the risk to be tracked      current time
Low           over time                            Monitoring of risk likelihood and
                                                   consequence over time to identify if risk is
                                                   increasing, decreasing or staying the same
              Risk may be acceptable with          Review of existing management controls or
              suitable risk control measures in    activities for the risk
Moderate      place                                Increased or different management controls
                                                   or activities may be needed
              Risk less likely to be acceptable;   Review of existing management controls or
              additional risk control measures     activities for the risk
High          may be needed to be                  Increased or different management controls
              considered                           or activities likely to be needed
Issues to be looked at in Step 3 – Current Management • Reason for high risk rating may be lack of implementation rather than a need for new regulation (new regulation not the only solution) • Future management will seek to prioritise cost-effective initiatives that have a tangible risk reduction i.e. from ‘High’ to ‘Moderate’, or ‘Moderate’ to ‘Low’. • Government cannot manage all threats to a ‘Low’ or ‘Minimal’ risk; accept that some will need to be managed at ‘Moderate’ Level but with the aim to monitor risk and trend over time • It may also be possible that MEMA agencies may not be able to manage some risks – need a new approach or multi-agency approach (to prevent falling through the cracks) or referral to another agency or regulator • Recognise need to link with other initiatives where practicable (Coastal Reforms and other Government initiatives)
Session 3 – Using a Risk Matrix
Scenario Activity – Doing a Risk Assessment
Using a framework similar to the TARA
STEP 1: INFORMATION and CONTEXT
What are the hazards or issues you are assessing?

STEP 2: CONSEQUENCES
Use the information to assess the most probable/common consequences of the
hazard. This could include -
•    Fatality
•    Major injuries (significant long term effects)
•    Minor injuries (usually requiring several days off work)
•    Negligible injuries (maybe first aid)

STEP 3: LIKELIHOOD
• Think about how people are likely to be exposed to each hazard and for how long �

STEP 4: RATING THE RISK
• Use the risk table to work out the risk associated with each hazard
RISK RATING TABLE (adapted from Australian/New Zealand Standard 4360:1995 – Risk Management)
LIKELIHOOD                                 CONSEQUENCE of any injuries or harm to health
of Injury or
Harm to
health

               Insignificant e.g.   Minor e.g. first aid   Moderate e.g.       Major e.g. extensive Catastrophic e.g.
               no injuries          onsite only            medical treatment   injuries             fatalities

Very likely    MODERATE             MODERATE               HIGH                HIGH                 HIGH

Likely         LOW                  MODERATE               MODERATE            HIGH                 HIGH

Possible       MINIMAL              LOW                    MODERATE            HIGH                 HIGH

Unlikely       MINIMAL              MINIMAL                LOW                 MODERATE             HIGH

Highly unlikely MINIMAL             MINIMAL                LOW                 MODERATE             MODERATE
(rare)
Scenario Context
Assess the risks of injury from two common recreational activities on the
coast -
1. walking on a public beach along an estuary and stepping on something
sharp
2. fishing on a rocky foreshore on the open coast and falling into the surf
Activity Steps (work with a partner in the audience) -
A. Assess the most probable/common level of consequence from the
activity/hazard?
B. Assess how likely it is that the level of consequence would be reached?
C. Combine the consequence and the likelihood using the matrix to assign a
risk score
D. What are some factors not provided in the context that could affect the
risk scores?Answers Walking on a public beach: • Consequence – stepping on something sharp on the beach – ‘Minor’ consequence (first aid needed) • Likelihood of a stepping on sharp object on the beach and needing first aid – ‘Unlikely’ likelihood • Minor x Unlikely = Minimal risk rating
Answers
Fishing on a rocky foreshore with waves
breaking below: �
• Consequence – Falling off the rocks –
  ‘Moderate’ consequence (requiring medical
  treatment)
• Likelihood of a fall – ‘Unlikely’
• Moderate x Unlikely = Low risk rating
Answers
Other factors that could affect the risk score
could include, for example: �
• External to the person (weather conditions,
  distraction by catching a fish, lots of rubbish or other
  sharp objects at the location such as oysters/coral)
• Internal to the person (have a high experience level
  with the activity, know the area well, wearing
  appropriate footwear, wearing a lifejacket)
Example of a Consequence Table from the Draft Statewide TARA �
Consequence     Consequence of impacts on clean waters
level

Insignificant   No measurable negative impacts on water quality are or will be possible against natural
                variations.

Minor           Barely measurable negative impacts on water quality outside of natural variation are or
                will be evident, and any impacts identified have not or will not substantially affect
                environmental processes.

Moderate        Measurable and on-going negative impacts on water quality are or will be evident in
                one or more locations. Nevertheless, the level, duration and/or the proportion of area
                affected have not or will not influence the overall recovery capacity, and the
                environmental processes in most of the affected location(s) are or will be maintained.

Major           Substantial measurable and on-going negative impacts on water quality are or will be
                evident in one or more locations, and the level, duration and/or the proportion of area is
                such that environmental processes are or will be adversely affected.

Catastrophic    Substantial measurable on-going negative impacts on water in one or more locations
                are or will be evident that are or will endanger environmental processes and their
                underlying ecological assets in the long-term.
Example Likelihood Table from the Draft Statewide TARA �
Likelihood level Likelihood of impacts in the bioregion
Rare Never reported in this situation, but still plausible within the timeframe (< 5%)
Unlikely Uncommon, but has been known to occur elsewhere. Expected to occur in the
bioregion only in specific circumstances within the timeframe (5-30%)
Possible Some clear evidence exists to suggest this is possible in this situation within the
timeframe (30-50%)
Likely Expected to occur in this situation within the timeframe (50-90%)
Almost certain A very large certainty that this will occur in this situation within the timeframe (>90%)Risk Matrix used in the Draft Statewide TARA
Session 4 – Engagement and How to
Make a Submission
Engagement
•   Public exhibition 18 January – 31 March

•   Six general workshops - February
                • Newcastle, Coffs Harbour, Ballina
                • Kiama, Narooma, Sydney

•   Aboriginal focus group workshops – March
               • Byron Bay, Coffs Harbour, Port Macquarie, Newcastle
               • Bega, Ulladulla, Nowra, Wollongong, Sydney

•   Mail out to stakeholders / media release / articles

•   NSW marine estate website – www.marine.nsw.gov.au

•   Online interactive tool to interrogate data and provide a submission
Supporting information
• Draft statewide TARA Report
• Environmental TARA Background Information Report
• Social and Economic Background Information Report
• Social and Economic TARA reference list
• Sea countries of NSW: a benefits and threats analysis of Aboriginal people’s
connections with the marine environment
• Frequently Asked Questions
• Fact Sheet
• GlossaryWe need your feedback
Key things to provide feedback on:
• Do you agree with the risk levels assigned to threats?
• If no, provide additional evidence to assist us to reconsider the risk
rating
• Are there any gaps in information or threats not identified?
• Are there additional studies or research you are aware of to assist us to finalise the
TARA?
• Are there local examples of threats to either the environmental assets or to the
social and economic benefits you derive from the marine estate?What is evidence? Evidence provided in submissions should be: • Scientific research or reports • Unpublished data/research • Supporting background reports Public opinion is not considered evidence All feedback will be considered, however the provision of evidence is most likely to influence changes to risk levels
How will your feedback be used? �
• � Workshop feedback, online submissions and additional evidence provided will be
    analysed by MEMA agency staff

• � A submission report will be completed that includes a summary of submissions
    and a summary of workshop outcomes

• � An interagency working group will review disputed risk levels and/or additional
    evidence to determine if a risk level should change (e.g. from a moderate risk to a
    high risk, or vice versa)

• � Proposed changes to risk levels following this process will be reviewed by the
    independent Marine Estate Expert Knowledge Panel and recommendations
    provided to MEMA for further consideration

• � The Statewide TARA will be finalised and inform the development of the Marine
    Estate Management Strategy and marine park pilots
TARA online interactive tool video demonstration
Session 5 – Findings of the Draft Statewide TARA
Draft Statewide TARA Report
                    • Introduction
                    • Methodology
                    • Key Findings of Environmental
                      TARA
                    • Key Findings of the Social and
                      Economic TARA
                    • Evaluation by the Marine Estate
                      Expert Knowledge Panel
                    • Priority threats for
                      consideration in future steps
Regions
• Northern Region (Tweed Heads
to southern Stockton Bight)
• Central Region (Stockton to
Shellharbour - Hawkesbury Shelf
marine bioregion)
• Southern Region (Shellharbour to
the Victorian border)
Shallow soft Deep soft
Beaches sediments sediments
Central
Central
Central
North
South
North
South
North
South
Minimal
Minimal
HighEnvironment Findings
• Higher and greater risks in the
estuaries
• Greater influence of land based
activities
• Distribution of risks similar
across geographic regions but
notably:
– Greater and higher risks in
Central region estuaries
– Slightly greater and higher
risks in Southern region
open coasts and marine
areasStatewide Priority Threats –
With ‘High’ and ‘Moderate’ Risks to Environmental Assets
Priority Threats to Estuaries Priority Threats to Open Coasts and Marine AreasRegional Variation of Priority Threats - Environmental
Social and Economic Findings
               • Higher proportion of
                 ‘moderate’ and ‘low’ risks
               • Results indicative of knowledge
                 gaps and uncertainty
               • Distribution of risks:
                  – Greater and higher risks in
                     Central region (>
                     population base)
                  – Similar between Northern
                     region and Southern region
Dependencies between environmental assets
and social and economic benefitsStatewide Priority Threats – With ‘High’ and ‘Moderate’ Risks to Social and Economic Benefits
Regional Variation of Priority Threats -
        Social and Economic
MEEKP Evaluation – Cumulative Impact Issues and Key Knowledge Gaps • Need better understanding of how reduction in fish assemblages (from all types of fishing) affect marine food webs and ecosystems - not just individual stock assessments • Water quality in estuaries – multiple sources of impact in a finite waterbody • Climate change can affect the marine estate as a whole – how do we start to build resilience?
Relationship with the Hawkesbury
Shelf Marine Bioregion Assessment
                  • A TARA process was also used
                    to inform the Hawkesbury
                    Shelf Marine Bioregion
                    Assessment
                  • These outputs used to inform
                    the Draft Statewide TARA –
                    ‘Central Region’ results
                  • A small number of risk ratings
                    re-assessed and changed
                    when comparing to use levels
                    in other regions
Session 6 – Breakout Sessions on Risk Matrices
Objectives of the Activity �
• Look at the outputs of the Draft Statewide TARA in detail
• Improve people’s understanding of linkages between risk ratings
  and evidence
• Opportunity to give MEMA agencies direct feedback about where
  evidence is supported/not supported
• Opportunity to provide information and identify additional
  evidence and studies that may inform a re-evaluation of
  consequence and/or likelihood
• Identify local examples of where risks are occurring
• Assist people to make a submission and maximise its usefulness �
Set Up – Two 45 minute Sessions
    Table Colour Code   Session 1 – Environmental TARA       Session 2 – Social and Economic TARA

    Blue Table          Resource uses that affect the        Resource uses that affect the Social and
                        environmental assets of Estuaries    Economic benefits derived from the
                                                             marine estate
    Yellow Table        Resource uses that affect the        Governance of the marine estate
                        environmental assets of Coasts and   including public safety and access
                        Marine Waters                        availability that affect the Social and
                                                             Economic benefits derived from the
                                                             marine estate

    Red Table           Land based impacts (including        Environmental threats (including climate
                        climate change) that affect the      change) that affect the Social and
                        environmental assets of Estuaries    Economic benefits derived from the
                                                             marine estate

    Black Table         Land based impacts (including        Environmental threats (including climate
                        climate change) that affect the      change) that affect the Social and
                        environmental assets Coasts and      Economic benefits derived from the
                        Marine Waters                        marine estate
Participant Instructions
Materials –
• At your table you will each get a handout with a section of the TARA matrix from the
draft Statewide TARA Report and accompanying evidence table
Instructions -
• Familiarise yourself with the risk ratings and the evidence (15 minutes)
• Following your review, consider three questions -
1. � Are there any particular risk ratings in the matrix you would question or change?
(e.g. not high enough/too high?)
2. � Is the evidence supplied for that risk deficient or insufficient? Are there other �
studies or evidence that can be provided to the MEMA agencies about the issue �
that would affect the risk score? �
3. � Can you provide any local examples in your region about where the risk is being �
demonstrated for the MEMA agencies to follow up? �
• MEMA staff facilitator will engage across the table group to capture this information
on a template (20 minutes)
• The table will report back to the broader group in a debrief at the end (2 minutes �
each) �Risk Matrix used in the Draft Statewide TARA
Session 7 – Summary
• � Important project - please review the draft statewide TARA

• � Visit www.marine.nsw.gov.au for more information & view videos �

• � Submission can be provided via the online interactive tool at the
    above web address (threat specific or general comment).

• � Types of evidence preferred:
    • Scientific research or reports
    • Unpublished data/research
    • Supporting background reports

• � Online tool demonstrations are available after the session

• � Consultation closes 31 March 2017

• � Feedback form completed
You can also read