Your Research based Consulting Partner - Powered by
←
→
Page content transcription
If your browser does not render page correctly, please read the page content below
Research Report

    Your Research based Consulting Partner
    Powered by

1
Executive Summary                                    1

              Social Media Usage and Attitude                      3

              Usage of Social Media platforms
              Perception of Social Media Platforms
              Reasons for usage
              Instagram Usage and Attitude                        11

              Frequency of Usage
              Time Spent
              Instagram Features used
              Content format upload preference

    Table
              Content category consumption preference
              Drivers for engagement actions

    of
              Attitude towards Instagram Influencers              21

              Influencer categories followed
              Reasons for following Influencers

    Content
              Influencer category - driver matrix
              Advertisements and E-Commerce: Usage and Attitude   27

              Instagram e-commerce users
              Perception of ads
              Action taken on Ads
              Likelihood of contest participation
              Likelihood of shopping on Instagram
              Drivers to shopping on Instagram
              Shopping Experience on Instagram
              Research Methodology                                38

              Research Methodology and Profile
              Research Team for this Report
              Copyright and Disclaimer
1

Executive Summary                                                                      Instagram Usage in India
    The Indian social media space has been witnessing substantial growth
    thanks to the increasing base of internet users in the country. With the           Monthly                 Average                    Frequency
    growing popularity of Instagram, there is a need to understand how users           Active                  Time Spent                 of Usage
    perceive and use the platform.
                                                                                       Users                   Per User                   51%
                                                                                       117.1*                  45*                        At least once
                                                                                       Million                 Minutes                    a day
    According to our research, the usage of the social media platform
    Instagram is one of the highest amongst the respondent base. Users
                                                                                       Time of the Day                     Likelihood of shopping
    perceive Instagram to be the least boring as compared to other social
                                                                                       maximum usage                       on Instagram
    media platforms. Moreover, they see it as informative, cool, fun and
    creative. Another primary reason for its popularity is the entertainment and
                                                                                       Early morning Evening
                                                                                       (6-9am)       (4-8pm)
                                                                                                                           63%
                                                                                                                            Very likely to shop
    the creative content from famous celebs and the freedom to express views.

    Instagrammers prefer to upload experiential content of travelling, food,         Instagram Perception                 Reasons for Usage
    leisure in the form of images, videos, and stories. The younger group of
    Instagrammers enjoy and use various formats the platform offers.                        Cool                          Entertainment
                                                                                         Interesting                       Follow Celebs
    Instagrammers follow celebrity influencers who they perceive to be popular
    and attractive. They engage with their content by liking and sharing. The               Trendy                           Get inspired
    influencers’ content, recommendations and brand collaborations have a                   Popular                       See Creative Content
    positive effect on the users about their likelihood of participating in
                                                                                            Youthful                          Stay updated
    contests and making product purchases.

    Perception of advertisements on Instagram is different and varied                 Content Category                   Influencer Category
    depending upon the categories of ads and users take actions based on                  followed                             followed
    these categories. Advertisements that are perceived to be appealing leads         Photography                           Celebrities
    to users searching for more information online for the products or services
                                                                                          Fashion                          Photography
    that are offered. They are also more likely to drive the users to shop for the
    said product/service.                                                                  Humour                              Fashion

                                                                                          Educational                           Sports
    More than 75% of the shoppers have had satisfactory experience while
    shopping from Instagram and a majority are likely to shop in the future.               Celebrities                      Movies / Shows
1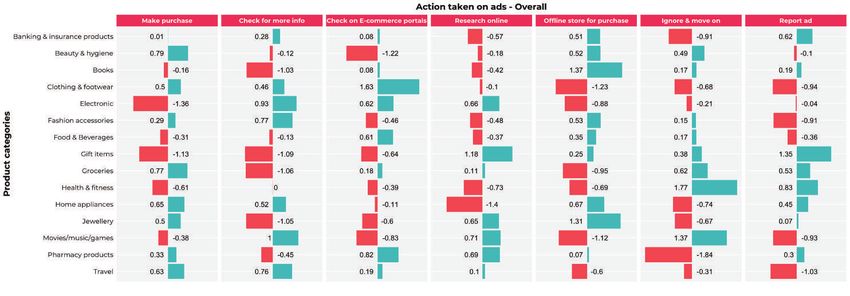
3
Usage of Social Media
                                                                             platforms
                                                                             There is a substantial level of growth in the user base of social media platforms
                                                                             worldwide. In India, more than half a billion of the population is now using the
    Instagram                                      98%                       internet for social media platforms like Facebook, Twitter, Instagram and other
                                                                             platforms with ByteDance’s TikTok leading the market with the most
                                                                             downloads. In just a few years social media has become an integral part of our
                                                                             lives with users consuming content on the platform, connecting, networking with
       TikTok                         92%
                                                                             other users. They also like to follow social media celebrities on these platforms as
                                                                             these celebrities are influencers acting as a bridge between customers and
                                                                             brands. Brands reach their audience by collaborating with influencers and
       Twitter                        92%                                    encourage customers to be more engaged by participating in contests,
                                                                             giveaways and explore the brand experience on social platforms. Customers are
                                                                             much more likely to be active listeners and participants when they have already
    Snapchat                  89%                                            made an emotional connection with that brand.

                                                                             With a focus on user perception, reasons for usage, experiences on these social
                                                                             media platforms, this report also considers the users’ preference for liking and
    Facebook          85%
                                                                             disliking a category of advertisement, the action was taken on ads and the
                                                                             features that they use and content they upload. Content management,
                                                                             presentation and communication via advertisements play an important role in
                                                                             engaging customers and expanding the base. This report goes deeper into the
                 Base: Overall respondents, Source: Recogn, Primary Survey   Indian Instagrammer’s mind and seeks to act as a guiding light for brands to help
                                                                             in strategizing the communication message on Instagram.

5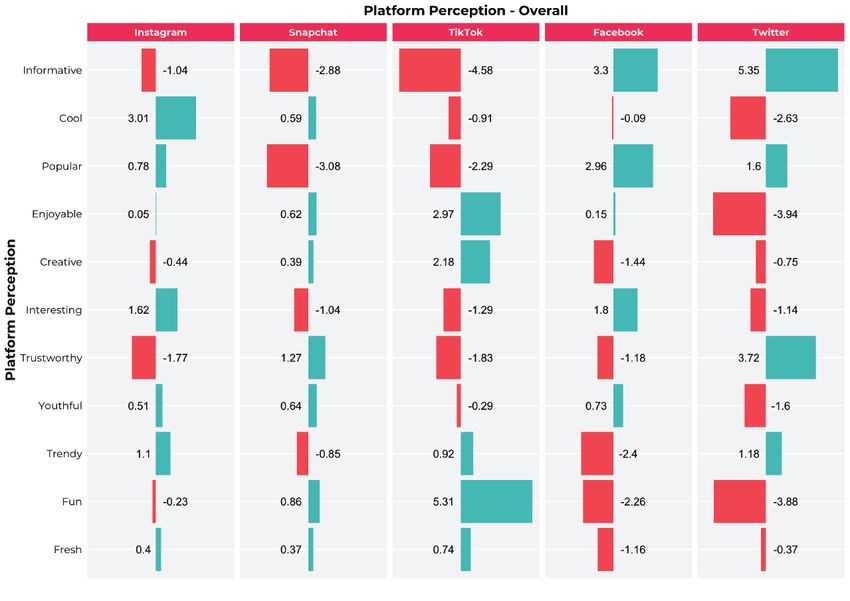
Base: Overall respondents, Source: Recogn, Primary Survey
This graph represents the strength of association / affinity of the rows with the columns and can be read both horizontally and vertically. Highest positive deviation
row wise implies that the particular column has the highest affinity with the particular row compared to all other columns. Highest positive deviation column wise
implies that the row has highest affinity with the particular column.
Here, we have identified the factors which have significant effect on perception basis on the importance of the parameters & are arranged in decreasing order.
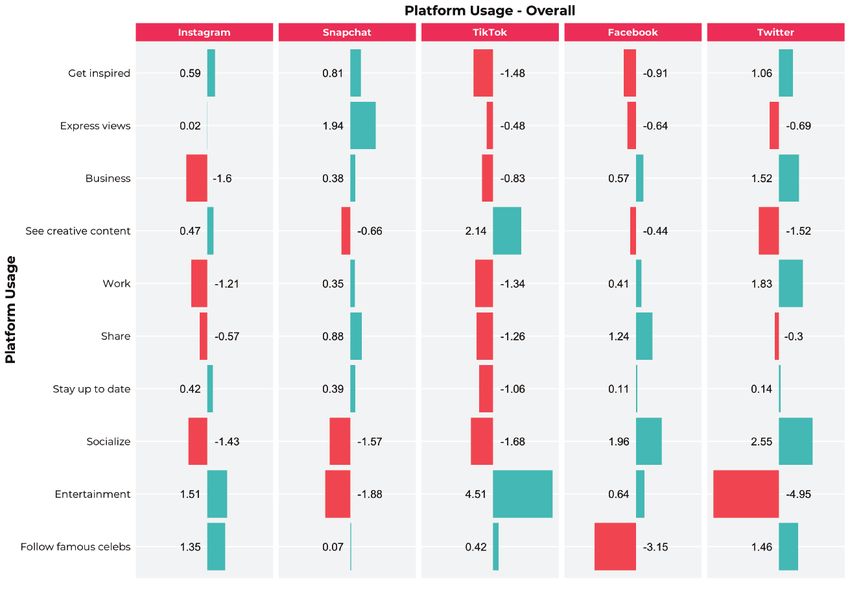
6Perception of Social Media
platforms
Among the social media platforms, Instagram has the strongest On an overall level, the respondents prefer to use the social media platforms
perception of being cool, trendy and somewhat interesting owing to which are primarily informative, followed by being cool, enjoyable, popular and
the fresh content it offers. Because of this perception, Instagram draws creative. Females like social media platforms which are primarily fresh, followed
a large user base. by being informative, cool, creative and youthful.
Snapchat has the weakest association with being popular, informative, The heavy users prefer using creative, cool and trendy platforms. The regular
interesting and trendy. It has stronger association with being trustworthy. users prefer the ones which are primarily fresh and informative while the light
TikTok has the strongest association with being fun and enjoyable among users go for the most informative ones.
all social media platforms thanks to the features that allow users to easily
connect, socialize, and collaborate with others. People also perceive it to
be quite fresh and young.
People perceive Facebook to be informative among the social media
platforms, it has the strongest association with being popular and
interesting. It has weak associations with being fun and trendy.
Twitter is the most trusted social media platform and people perceive it
to be the most informative among all. The content on the platform is one
of the primary sources to obtain information and get updates on
happenings around the world. People perceive it to be less interesting
and youthful.
"...I use both Facebook and Instagram, but I'm more of an
Instagram person. Facebook has become quite boring & I only
update my profile if required..."
- Female, 25 years, Top 9 Metros
"...All my friends are on Instagram which made me join it. I use it for
chatting and following food-related content...”
- Male, 16 years, Top 9 Metros
7Base: Overall respondents, Source: Recogn, Primary Survey
This graph represents the strength of association / affinity of the rows with the columns and can be read both horizontally and vertically. Highest positive deviation row
wise implies that the particular column has the highest affinity with the particular row compared to all other columns. Highest positive deviation column wise implies
that the row has highest affinity with the particular column.
Here, we have identified the factors which have significant effect on perception basis on the importance of the parameters and are arranged in decreasing order.
8Importance of
Reason on Usage
Users access Instagram to get entertained and update themselves with Respondents prefer to use social media platforms primarily to get inspired and
the latest trends. They like to follow celebrities and influencers on the then to express their views, view creative content and for business.
platform. Previously, brands relied heavily on communicating about the
product and its message through advertisements on the platform. Males use social media mainly to get inspired while females use it to share
Nowadays, consumers have greater faith in these famous influencers content. Users below 18 years use it for entertainment, those between 18 - 24
and celebrities than brand advertisements. The platform usage to years use it to share content, 25 - 34 year olds for socializing, 35 - 44 year
socialize and use for business purposes isn’t prominent. olds to share content and the older age groups to get inspired. Users in the top
9 metros use it to get inspired, those in the small metros for staying up-to-date,
Users use Snapchat to express their views and opinions through the and in small towns to share content.
platform and share them with the world. TikTok is used to primarily get
entertained and watch creative content on the platform. Facebook is The light users access social media for entertainment and to socialize, regular
majorly used by the users to socialize and share content on the platform. users for work and socializing while the heavy users access it for business and to
The users aren’t interested in following celebrities and influencers on get inspired.
Facebook. Users prefer to access Twitter primarily to socialize with the
world apart from work and business. They don’t use Twitter for
entertainment.
“… I use the platform to stay updated with fashion, celebrities and
influencers whom I follow. I also like content related to technology
and gadgets, music and food. I like to watch funny videos and
memes. I feel that the platform is a source of entertainment.”
- Female, 25 years, Top 9 Metros
911
Frequency of use
     51% of the Instagrammers access it at least once a day with a large
     proportion of them accessing it multiple times in a day (32%). This is
     followed by 16% of the users accessing it at least 4 to 6 times a week.

     Males use the platform more frequently and access the platform multiple
                                                                                                   Less than
     times in a day than females. Users belonging to the younger age group
                                                                                                 once a month
     access the platform more frequently than the older age group.
                                                                                                   10%                                   Multiple times
                                                                                                                                           in a day
                                                                                  Once a month
                                                                                                                                            32%
                                                                                      8%

                                                                                 2-3 times
                                                                                in a month

                                                                                10%

                                                                                  Once in
                                                                                  a week

                                                                                   5%

                                                                                                                                    Once in a day
                                                                                             4-6 times
        "...I surf and browse the platform 7 - 8 times a day and use it                      in a week
                                                                                                                                      19%
        randomly for an hour or so each time...I use it during morning,                      16%
        afternoons... evenings when I have free time, commuting or during
        breaks..."
        - Female, 22 years, Top 9 Metros
                                                                                                           Base: Instagram users, Source: Recogn, Primary Survey

        "...I am usually online all the time...mostly early in the morning...
        afternoon and late nights..."
        - Male, 16 years, Small Towns
13
Time Spent
Instagrammers spend most of the time on the platform in the evening between 4-8 PM. Instagram users check for updates and notifications waking up
early in the morning. Majority of the users prefer to access it towards the evening and night due to the availability of leisure time. Most of the working
professionals prefer to browse through their feed during their evening commute.
30%
27%
25%
21%
13%
10%
Early morning Morning Afternoon Evening Night Late night
(6-9am) (9-12am) (12-4pm) (4-8pm) (8-11pm) (11-6am)
14 Base: Instagram users, Source: Recogn, Primary SurveyInstagram Features used Like Post 18%
Instagrammers interact with the platform’s features such as liking posts,
uploading stories / images / videos etc. and sharing content with Stories 15%
their family and friends.
Upload Image 15%
A majority of the users prefer to like posts, upload and watch stories,
followed by uploading images. The stories feature filters, boomerangs, Share post 13%
GIFs, stickers and especially polls are used frequently.
Follow Post 13%
A lesser percentage of users repost content that they like on their profile.
IGTV video content upload is very low as many users are yet to get used Save Post 12%
to this recently introduced feature. Polls and quizzes put forward by the
brands and online influencers encourage users to participate in contests Polls and quizes 11%
and giveaways.
Discover 11%
At an overall level, users who follow a page are also likely to like posts
and view stories. Those who upload images are likely to chat, socialize,
Emojis 11%
save and share posts and discover new content.
Stickers 11%
The younger users are very likely to use IGTV and discover new content.
They also are very likely to chat, socialize, stories, GIFs and emojis.
Chat and socialize 11%
"...I check out bloggers and other fashion pages...I like to browse, Face filter 10%
discover new pages and use Instagram just to make myself aware of
the trends. I post once in a while, maybe upload 1 - 2 pictures in a GIFs 9%
month..."
- Female, 25 years, Top 9 Metros IGTV 7%
"...I like to watch videos on YouTube, but I don't mind watching IGTV Repost on profile 3%
when compared to Facebook because there are no ads on IGTV..."
- Male, 16 years, Small Towns
15 Base: Instagram users, Source: Recogn, Primary SurveyContent format upload preference
Users prefer to upload images and videos that they find interesting and the content categories they resonate with. 29% of the users prefer to upload images in
the experiential categories or upload images of travelling, food etc. 26% of the users like to upload videos and 24% of the users upload stories, followed by
using features likes filters, stories, stickers, emojis, etc.
Content related to food, travel are prominent categories that most of the users upload. The users belonging to the younger age group prefer to upload stories
and videos on the platform. They like to use filters, boomerangs and stickers on their stories.
The younger age groups are more likely to upload IGTV videos, stories, videos and GIFs. The older age group is more likely to upload images and videos.
29%
26%
24%
19%
17%
15%
11%
IG TV Infographics GIFs Audio Stories Videos Images
16 Base: Instagram users, Source: Recogn, Primary SurveyContent category consumption
15%
preference
Photography
Fashion 14%
Instagrammers like to view content related to photography and fashion the
Humour- comedy 13% most. Users like to engage with the content that they find humorous and funny.
Educational 13% The younger audience is inclined towards viewing content related to education.
When it comes to content related to sports (13%) users follow cricket, football
Celebrities 13%
and wrestling players on the platform. Overall, users prefer to watch and share
content uploaded from famous online influencers, sportspersons, and celebrities
Technology & gadgets 13%
like Virat Kohli, Ranveer Singh, Rohit Sharma, Will Smith, Alia Bhatt, etc.
Sports 13%
News 12%
Movies & shows 12%
Music 12%
Food 11%
Games 11%
Spiritual 10%
Politics 10%
Videography 10%
Memes 9%
Art 4%
17 Base: Instagram users, Source: Recogn, Primary SurveyBase: Instagram users, Source: Recogn, Primary Survey
This graph represents the strength of association / affinity of the rows with the columns and can be read both horizontally and vertically. Highest positive deviation
row wise implies that the particular column has the highest affinity with the particular row compared to all other columns. Highest positive deviation column wise
implies that the row has highest affinity with the particular column.
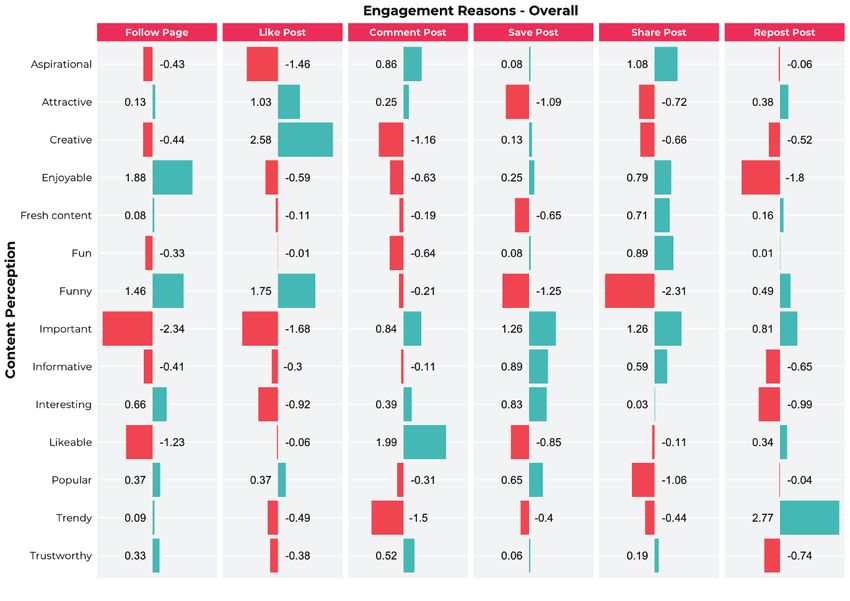
18Drivers for Engagement Actions
The users follow accounts / influencers on the platform who post content that is funny and enjoyable, such as @thescribbledstories, @yeahitschill,
@sarcasm_only, etc. Users will not follow a page if the content is not likeable or important. They prefer to like a post if the content is funny, fresh and creative.
The users will comment on a post if they find the content likeable. Users save posts for later viewing and referring when they seem to be interesting, informative
and important. Posts having an element of humour have higher chances of getting saved to be viewed later. Users like to share important and aspirational posts
with their circle on Instagram and would repost content that they find trendy.
“...I forward funny memes and posts that I like to my friends and near ones... If Ilike something interesting and appealing, I share and re-post it. I like to
skim through my feed most of the time...”
- Female, 25 years, Top 9 Metros
1921
Influencer Categories Followed
     Users prefer to follow Instagram celebs
     the most. The celebrity influencers like
     @amitabhbachchan,         @Alia    Bhatt
     @iamsrk,    @beingsalmankhan,        etc.            Salman Khan                            10%                      Celebrities                                     14%
     have a large follower base by the users                                                                            Photography                                     13%
     on the platform. Photography, fashion
                                                              Virat Kohli                      8%                            Fashion                                    13%
     accounts and sports influencers are
                                                                                                                               Sports                                   13%
     followed    by     the   users.   Fashion
                                                             M S Dhoni                     7%
     accounts    like   @manishmalhotra05,                                                                       Movies and shows                                       13%
     @sabyasachiofficial       and     fashion                                                                           Educational                                11%
     content creators like @sejalkumar1195
                                                          Rohit Sharma                    6%
                                                                                                           Technology and gadgets                                   11%
     are followed by the users.
                                                        Shahrukh Khan                 4%                                       Music                                11%

     In the category of sports influencers /                                                                                  Politics                              11%
     personalities accounts like @virat.kohli,      Amitabh Bachchan                3%                             Humour- comedy                                 10%
     @mahi7781 and @rohitsharma45 are                                                                                         Games                               10%
     followed by the users and they like to              Akshay Kumar               3%                                  Videography                               10%
     engage with their content whenever
                                                                                                                                News                           9%
     they upload a post on their account. In
                                                    Deepika Padukone                3%
     the category of movies and shows the                                                                                    Spiritual                         9%
     users follow accounts belonging to                                                                                       Memes                            9%
                                                        Narendra Modi             2%
     @marvel_india and @marvelstudios.
                                                                                                                                Food                         8%
     @byjus_app, @khanacademy and the
                                                              Alia Bhatt          2%                                               Art           3%
     similar educational content creators are
     followed by the school and college
     students.
                                                                                                                           Base: Instagram users, Source: Recogn, Primary Survey

      "...I like Marvel India's content about the movies. I check their updates regularly. I trust them since their account is the official page..."
       - Male, 17 years, Top 9 Metros
23
Reasons for following
Influencers Popular 14%
Attractive 14%
Popularity and attractive content are some of the main reasons for which
the users of the platform follow famous influencers, celebrities and
Enjoyable 13%
sports personalities. The content put up by these influencers are
enjoyable. The influencers are trendsetters and the content they upload
Trendy 12%
is fresh, likeable and interesting.
Fun 12%
Users like to follow content that is humorous and funny, similarly and
influencers like Bhuvan Bam, Ashish Chanchalani, etc. They create
Interesting 12%
content that is creative in terms of writing and scripting, presenting and
distinguishable characterization of their fictional characters.
Fresh content 12%
Likeable 12%
Funny and 12%
humorous
Creative 11%
Important 10%
"...if the verified influencers are using, recommending or suggesting
some product, I would read about them more and somewhere it Informative 10%
would influence my decision such that I might want to use / try the
product..." Aspirational 9%
- Female, 25 years, Top 9 Metros
Trustworthy 9%
"...The influencer collaboration with the brand will only get Fashionable 5%
strengthened by trust...I would only purchase if the product quality
is better and the influencer doesn't matter much..."
- Male, 25 years, Small towns
24 Base: Instagram users, Source: Recogn, Primary SurveyInfluencer Category - Influencer Content Category followed
Driver Matrix - Reasons for following- Overall
At an overall level, Instagrammers follow
celebs and fashion pages as they see them
to be fashionable, attractive and interesting.
They follow photography pages for fresh
content. They follow videography and games
as they find these aspirational. Meme pages
are followed by most since they are funny and
humorous. Technology, gadgets and food
/
content is followed as users feel they are
trendy and informative. /
The users in the top nine metros follow /
celebs, movies and shows because they find
them fashionable, popular and attractive. The /
users in the small metros follow them because
they find them informative, attractive and
likeable. Those in the small towns follow
photography and celeb pages because they
find them to be fun, interesting, creative and
fresh content.
Legend: Drivers Category
Base: Instagram users, Source: Recogn, Primary Survey
The Influencer category matrix helps us evaluate the drivers for users to follow a certain influencer category. The
terms in red are the influencer categories and those in blue denote the drivers for following them. The proximity of
25 the influencer category to a driver denotes strong affinity.27
Instagram
     e-commerce users
     More than half of the respondents have shopped on Instagram. Close to
     three fourth of the users from small metros and small towns have

                                                                                                     No
     shopped on Instagram. The presentation of the product / service and the
     content of the post will turn into a purchase only if the brand or the

                                                                                                    40%
     supplier is trusted and is reputed.

                                                                                                                                  Yes
                                                                                                                                  60%

                                                                                                                     Base: Instagram users, Source: Recogn, Primary Survey

        "...I have shopped a couple of times from Instagram and received a good quality product...The experience was fine as the brand was a trusted one..."
        - Female, 25 years, Top 9 Metros

        "...I have seen ads on Instagram...but I go e-commerce websites like Amazon to check more about it and make the purchase there..."
        - Male, 27 years, Top 9 Metros
29
Base: Instagram users, Source: Recogn, Primary Survey
This graph represents the strength of association / affinity of the rows with the columns and can be read both horizontally and vertically. Highest positive deviation row wise implies
that the particular column has the highest affinity with the particular row compared to all other columns. Highest positive deviation column wise implies that the row has highest
affinity with the particular column.
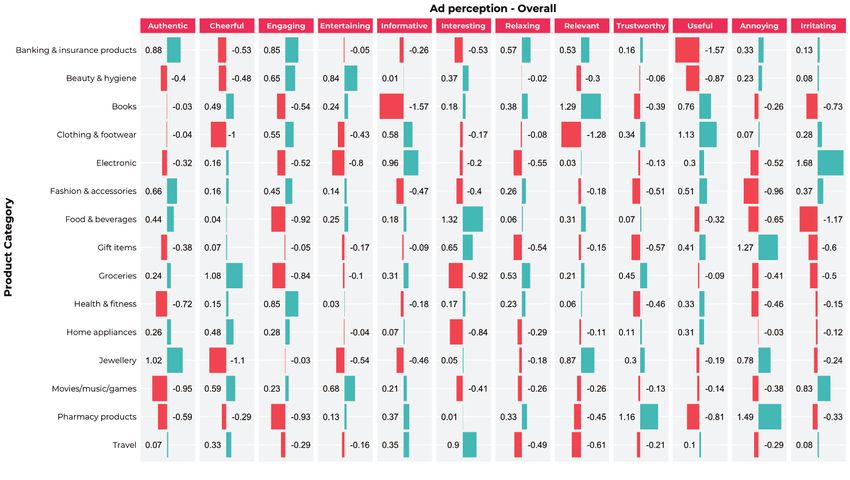
30Perception of ads
The ads on Instagram for electronic items are perceived to be informative. The consumers with keen interest in lifestyle category perceive the clothing and
footwear ads to be very useful, however, they find them to be less relevant. The ad communication messaging need to be made more relevant to the TG which
will increase the sales. Ads for movies, video games and music are entertaining, for fashion and accessories it is perceived as authentic and home appliances
are considered to be simply irritating. Moreover, health and fitness advertisements are seen to be engaging due to their visual representation, while grocery ads
are less engaging.
Pharmacy related products are perceived to be trusted according to the users of the platform although the level of engagement with this category is low, due to
the less appealing visuals.
The users perceive the travel ads to be interesting, but the relevancy depends upon the type of offering the travel brands are providing and how significant are
the ads to the consumers as per their present or future travel plans.
"...if I find the ad to be attractive and interesting...I click on them to "...sometimes these ads are interesting and sometimes they
know more..." become quite annoying and look quite forced..."
- Female, 26 years, Top 9 Metros - Male, 25 years, Small Towns
31Base: Instagram users, Source: Recogn, Primary Survey
This graph represents the strength of association / affinity of the rows with the columns and can be read both horizontally and vertically. Highest positive deviation row wise implies
that the particular column has the highest affinity with the particular row compared to all other columns. Highest positive deviation column wise implies that the row has highest
affinity with the particular column.
32Action taken on Ads
Users prefer to purchase electronic products offline and an immediate
online purchase is less likely as people check for more information about
these products after watching an online advertisement.
`
Similarly, for purchasing footwear and clothing products the consumers
check and seek more information online after seeing the ads.
Health and fitness advertisements are ignored by the consumers as they
don’t take any action on them and prefer to move on. In the category of
gift items, the users do not make an online purchase as they tend to
question the authenticity, the product’s condition and the delivery time.
The users prefer Food and Beverages ads which are interesting, and
they like to check more details on those. The ads of banking / finance
and pharmacy products are ignored by the users. Users like to check for
more information upon seeing the Travel ads.
"...I pay attention to the ads that are interesting and related to my
choice of content, else I ignore them as they are a wastage of my
time..."
- Female, 22 years, Top 9 Metros
"...I like funny ads. I also like ads regarding music and acting..."
- Male, 16 years, Small Towns
33Likelihood of contest participation
66% of the users of the platform would be quite likely to participate in Instagram contests and giveaways. The older age group is more likely to participate in
contests than the younger age groups. The contests and giveaways hosted by influencers and brand collaborations attract users.
29% 37% 23% 8% 3%
Extremely likely Very likely Somewhat likely Very unlikely Extremely unlikely
Base: Instagram users, Source: Recogn, Primary Survey
"...if my favourite influencer is collaborating with a brand, I would definitely participate in such contests and giveaways..."
- Female, 22 years, Top 9 Metros
34Likelihood of shopping on Instagram
Instagram as a shopping platform allows brands and local vendors to directly connect with their customers either using messages or links in their bio. 63% of
the users are influenced by the platform resulting in higher likelihood to shop via Instagram. The heavy users are extremely likely to shop on Instagram than the
other users. Users from the small metros and towns are quite likely to shop on Instagram. The users of the platform consider the authenticity of the brands while
deciding on making a purchase.
35% 28% 21% 12% 4%
Extremely likely Very likely Somewhat likely Very unlikely Extremely unlikely
Base: Instagram users, Source: Recogn, Primary Survey
35Drivers to Shopping on Instagram
At an overall level, Instagrammers are very likely to shop based on the ads they find entertaining, interesting, useful and engaging. They are likely to shop
primarily for movies / music / games and electronic items on Instagram.
It is the same for Instagrammers in small metros and towns for electronic items and fashion accessories. While those in the top nine metros are likely to shop for
health / fitness products and gift items that they find trustworthy, interesting and engaging. On the other hand, light users opt to shop for movies / music /
games, regular users purchase gift items and heavy users shop for travel items and more based on things they find authentic and interesting.
Ad Perception Vs. Likelihood Ad Category Preference Vs. Likelihood
of Shopping on Instagram Overall of Shopping on Instagram Overall
Interesting Movies / Music / Games 4.87
3.59
Electronic 4.37
Useful 3.55 Clothing & Footwear 4.1
Banking Insurance Products 4.1
Entertaining 3.55
Fashion Accesories 4.03
Product Categories
3.13
Perception Parameters
Engaging Food & beverages 3.97
Health & Fitness 3.9
Trustworthy 2.92
Books 3.87
Authentic 2.87 Groceries 3.77
Jewellery 3.74
Relaxing 2.77
Pharmacy Products 3.68
Relevant 2.75 Gift Items 3.53
Travel 3.41
Cheerful 2.66
Beauty & Hygiene 3.29
Informative 2.53 Home Appliances 3.16
Importance Likelihood of Shopping
36 Base: Instagram users, Source: Recogn, Primary SurveyShopping Experience on Instagram
A large majority of the users are extremely satisfied with shopping on Instagram of which the users from the smaller metros and towns are the most satisfied.
30% 46% 21% 2%1%
Extremely likely Very likely Somewhat likely Very unlikely Extremely unlikely
Base: Instagram users, Source: Recogn, Primary Survey
3738
Research methodology and respondent profile
        Gender       Overall   Instagram
                                 users     Town Class                                               Definition                                                  Overall Instagram
                                                                                                                                                                          Users
        Female        566        537
         Male                              Small Metros                      Cities with population between 1 million to 4 million                                475        386
                      1351      1068
                                           Small Towns                              Cities with population below 1 million                                        491        373
         Total        1917      1605
                                           Top 9 Metros        Mumbai, Delhi, Kolkata, Chennai, Bangalore, Pune, Hyderabad, Ahmedabad, Surat                      951        846
                                              Total                                                                                                               1917       1605

                                                Heaviness of                                                                       Occupation                  Overall Instagram
       Age Group      Overall Instagram          Instagram                                          Instagram                                                            users
                                Users                                       Definition                users
                                                   Usage
                                                                                                                                    Housewife                    185          174
          Under         244        183           Heavy users         More than 10 hours of use          364                   Not working currently               94          73
         18 years
                                                 Light users            4 - 10 hours of use             327                Professional with less than           283         253
       18-24 years      649        497                                                                                       10 years of experience
       25-34 years      309        236          Regular users         less than 4 hours of use          914               Professional with more than            317         306
       35-44 years      367        347                                                                                      10 years of experience
                                                      Total                                             1605
       45-54 years      216        214                                                                                            Self-employed                  338         283
        55+ years       132        128                                                                                               Student                     700          516
          Total        1917       1605                                                                                                 Total                    1917         1605

     Qualitative Research                                                                Quantitative Research

     In-depth interviews were conducted with 25 respondents across age                   Survey was conducted among a sample size of 1917 respondents across age

     groups, gender, occupation and town class to identify the qualitative               groups, gender, occupation and town class using stratified random sampling to

     aspects of social media and Instagram usage.                                        gather the required data.

                                                                                         * The figures for monthly active users and average time spend per user
     Research duration: June - August 2019                                               have been taken from SimilarWeb

                                                                                         For detailed demographics insights, please visit - http://recogn.in/watinsights/instagram.php

40
Research Team for this Report
Abheek Biswas, AVP Consumer Insights (abheek@watconsult.com)
Prabhupreet Singh Ahuja, Sr. Research Executive
Sumit Bansode, Lead Creative Designer
Shweta Kadam, Sr. Creative Designer
About Recogn About WATConsult
Recogn, research-based consulting division of WATConsult, Ranked as the second-best digital agency in the country as per the Agency
complements the agency’s knowledge of digital media over a period of Reckoner by Brand Equity, WATConsult is seasoned true hybrid full-service
10 years with the understanding of the digital audience. Recogn digital agency. The agency works with over 120 large Indian and global brands.
provides marketers with deeper insights into the minds of consumers Part of the Dentsu Aegis Network, it has a 340+ member team spread across
and help create more focused marketing strategies. Recogn provides Mumbai, Delhi & Bangalore.
end-to-end research services like customized primary research into the
domains of marketing strategy, brand strategy, product and Catering to the industry's diverse and ever growing needs, WATConsult has
communication strategies, among others. specialized divisions like Social CRM 24/7 for ORM, In-Depth Analysis, and
Social Listening, Recogn for consumer research and consulting, InnoWAT - the
Find more about Recogn at: www.recogn.in agency's very own tech innovation lab, Ecommencify for an end to end
eCommerce solution for brands & The Alter Project, the agency's most recent
venture into cause marketing and delivering campaigns for the greater good.
Contact details
WATConsult
1076, Parijat House, Worli Naka, Mumbai – 400 018
Phone : +91 22 6709 9200 | Website : http://www.watconsult.com
41COPYRIGHT DISCLAIMER
All material contained in these Inter-Research Journals, including WAT Media Pvt. Ltd. (WATConsult) has, to the best of its commercial ability, taken
without limitation text, logos, icons, photographs and all other artwork, care to compile the information and material contained in this research work.
is the absolute and exclusive property of the WAT Media Pvt. Ltd. Provided however, WATConsult does not warrant that the information and
(WATConsult) and all rights, including any and all intellectual property material contained in the research work, or any part thereof, is designed to, or will
rights and without limitation all copyright, vests absolutely and meet any person’s requirements, or that it will be error free or free from any
exclusively in WATConsult, unless otherwise specifically stated. No use inadequacies, incorrectness, incompleteness, inaccuracies, or bug free.
shall be made of this material without the prior express permission in WATConsult hereby disclaims any warranty, express or implied, including, without
writing from WATConsult as the copyright holder thereof. Any and all use limitation, any warranty of non-infringement, merchantability or fitness for a
of this material is expressly prohibited and shall be an offence under the particular purpose, in respect of any information and / or material contained in the
Copyright Act, 1957, unless specifically authorized previously in writing research work. WATConsult will not be held responsible for any loss, damage or
by WATConsult. inconvenience caused to any person as a result of any inadequacies,
incorrectness, incompleteness, inaccuracies, or errors contained in these
Without prejudice to the forgoing any material provided by any third research reports. WATConsult holds and processes personal data, if any, in
party to WATConsult, including any non-proprietary material of accordance with applicable law in force.
WATConsult, obtained through links to other sites, which is a part of the
Inter-Research Journals, or is displayed on WATConsult web pages, is
the property of the original author (as may be disclosed in such
material), or such third party, as the case may be, and a prior written
permission for the use such material in any manner, must be obtained
from the author or such third party, as the case may be.
42Insights
You can also read