Drug-induced psychosis and neurological effects following nitrous oxide misuse
←
→
Page content transcription
If your browser does not render page correctly, please read the page content below

December 2019: 61:10
                                             Pages 369–408

                                                    IN THIS ISSUE
                            The influence of breast density
                                on breast cancer diagnosis
                                       Canada’s revolutionary
                                             new food guide
                                                      The age of
                                                    mushrooms is
                                                        upon us
Drug-induced
psychosis and
neurological
effects
following
nitrous oxide
misuse

                                                         bcmj.org
                BC Medical Journal vol. 61 no. 10 | december 2019 369
December 2019
         Volume 61 | No. 10
         Pages 369–408

Psychedelic medications, including mushrooms, are on the verge of becoming mainstream practice. Article begins on page 390.

The BCMJ is published by Doctors of BC. The
journal provides peer-reviewed clinical and review
                                                                  372 Editorials                                                 Clinical
articles written primarily by BC physicians, for                             My selfish Christmas wish,
BC physicians, along with debate on medicine                                 David R. Richardson, MD                             376 The influence of breast density
and medical politics in editorials, letters, and
essays; BC medical news; career and CME listings;                            New research on hormones and                                on breast cancer diagnosis:
physician profiles; and regular columns.                                     breast cancer: The headlines                                A study of participants in the
Print: The BCMJ is distributed monthly,                                      don’t convey what women need                                BC Cancer Breast Screening
other than in January and August.
                                                                             to know, Caitlin Dunne, MD,                                 Program, Colin Mar, MD, Janette
Web: Each issue is available at www.bcmj.org.
                                                                             Timothy Rowe, MBBS                                          Sam, MRT, Colleen E. McGahan,
Subscribe to print: Email journal@doctorsofbc.ca.
Single issue: $8.00                                                                                                                      MSc, Kimberly DeVries, MSc,
Canada per year: $60.00
Foreign (surface mail): $75.00                                    375 President’s Comment                                                Andrew J. Coldman, PhD
Subscribe to notifications:                                                  Strength in numbers: The power of
To receive the table of contents by email, visit                             cooperation, Kathleen Ross, MD                      385 Drug-induced psychosis and
www.bcmj.org and click on “Free e-subscription.”
                                                                                                                                         neurological effects following
Prospective authors: Consult the
“Guidelines for Authors” at www.bcmj.org                                                                                                 nitrous oxide misuse: A case
for submission requirements.
                                                                                                                                         report, Matthew Mo Kin Kwok,
                                                                                                                                         MD, Jane de Lemos, PharmD,
                                                                                                                                         Mazen Sharaf, BSc Pharm

                                  On the cover                                Editor                    Managing editor            Proofreader                     Printing
                                  Drug-induced psychosis and                  David R. Richardson, MD   Jay Draper                 Ruth Wilson                     Mitchell Press
                                  neurological effects following              Editorial Board           Associate editor           Web and social media            Advertising
                                  nitrous oxide misuse                        Jeevyn Chahal, MD         Joanne Jablkowski          coordinator                     Kashmira Suraliwalla
                                  Nitrous oxide is becoming a popular         David B. Chapman, MBChB                              Amy Haagsma                     604 638-2815
                                                                                                        Senior editorial and
                                  recreational drug all over the world.       Brian Day, MB
                                                                                                                                   Cover concept and
                                                                                                                                                                   or journal@doctorsofbc.ca
                                                                                                        production coordinator
                                  Users can easily obtain it by puncturing    Caitlin Dunne, MD
                                                                                                        Kashmira Suraliwalla       art direction, Jerry Wong,      ISSN: 0007-0556
                                  small cannisters used in whipped            David J. Esler, MD
                                                                                                                                   Peaceful Warrior Arts           Established 1959
                                                                              Yvonne Sin, MD            Copy editor
                                  cream dispensers. Our case study on
                                                                              Cynthia Verchere, MD      Barbara Tomlin             Design and production
                                  drug-induced psychosis following
                                                                                                                                   Laura Redmond, Scout Creative
                                  its misuse begins on page 385.

370 BC Medical Journal vol. 61 no. 10 | december 2019
n Celebrating a family medicine
milestone and 1969 trailblazers
n Naloxone kits encouraged for those
who smoke or snort
n New international exercise guidelines
for cancer survivors
n Patients with mood, anxiety disorders
share abnormalities in brain’s control
circit
n New DNA “clock” could help
measure development in young
children
399 Obituaries
Dr Donald Wilson Lang
Dr Pascualito Aquino Seminiano
Mr James ( Jim) Edward Gilmore
401 GPSC
The current role of genomics/genetics in medicine and possible future applications and implications. Article begins PSP supports for quality
on page 388. improvement activities: Refreshed
compensation policy, simplified
certification process, Alana Godin
388 BCMD2B 394 BC Centre for Disease Control
The role of genetics in medicine: Shared decision making and
A future of precision medicine, breastfeeding: Supporting families’ 402 Council on Health Promotion
Yue Bo Yang, BSc informed choices, Sarah Munro, Canada’s revolutionary new food
PhD, Cynthia Buckett, MBA, guide, Michael Lyon, MD
390 Premise Julie Sou, MSc, Nick Bansback,
The age of mushrooms is upon us PhD, Henry Lau, RD 403 WorkSafeBC
in medicine, Mark Elliott, MD Workplace exposure to rabies,
395 News Geetha Raghukumar, MBBS,
Book review: Essential Caregiving Olivia Sampson, MD
392 SSC n
Physician engagement gains Guide: How to optimize the extended
traction across BC, Sam care your loved one needs 404 CME Calendar
Bugis, MD, Cindy Myles
n BC’s top family physician of 2019
n Hear from patients: New GPSC
Patient Experience Tool
405 Classifieds
n Mushroom poisonings on the rise in
BC 407 Club MD
Environmental impact Postage paid at Vancouver, BC. Canadian Publications Mail, Product Sales Agreement #40841036. Return undeliverable copies
The BCMJ seeks to minimize its negative impact on the to BC Medical Journal, 115–1665 West Broadway, Vancouver, BC V6J 5A4; tel: 604 638-2815; email: journal@doctorsofbc.ca.
environment by:
Advertisements and enclosures carry no endorsement of Doctors of BC or BCMJ.
• Supporting members who wish to read online with an
e-subscription to bcmj.org © British Columbia Medical Journal, 2019. All rights reserved. No part of this journal may be reproduced, stored in a retrieval system, or trans-
• Avoiding bag use, and using certified-compostable plant-based mitted in any form or by any other means—electronic, mechanical, photocopying, recording, or otherwise—without prior permission in
bags when needed writing from the British Columbia Medical Journal. To seek permission to use BCMJ material in any form for any purpose, send an email to
• Working with Mitchell Press, ranked third in North America for journal@doctorsofbc.ca or call 604 638-2815.
sustainability by canopy.org Statements and opinions expressed in the BCMJ reflect the opinions of the authors and not necessarily those of Doctors of BC or the
• Printing with vegetable-based inks institutions they may be associated with. Doctors of BC does not assume responsibility or liability for damages arising from errors or omis-
• Using FSC-certified paper sions, or from the use of information or advice contained in the BCMJ.
• Printing locally in British Columbia The BCMJ reserves the right to refuse advertising.
BC Medical Journal vol. 61 no. 10 | december 2019 371
Editorials

My selfish Christmas wish

C
          hristmas is a magical time for a child.       reflected through a gift well chosen warms the           Our journal’s circulation is roughly 14 000,
          Does anyone else remember the long-           heart. I would rather watch a loved one’s reaction   which includes practising and retired physicians,
          anticipated arrival of the Sears cata-        to opening a gift than open one myself. Being        students, and residents. I have heard that every
logue? My brothers and I would pour over the            with family, sharing food and drink during this      person has at least one good novel in them. I
pages circling desired toys for my parents’ later       time, is about as perfect as it gets.                would prefer to think that each of you has at
perusal. Unable to sleep on Christmas morning,                                                               least one good essay, opinion piece, scientific
we would lie in bed tortured by the slow move-           “All I want for Christmas is you!”                  study, theme issue, letter, or back-page feature
ment of time until the anointed hour arrived                                                                 floating around in your consciousness. So, for
and we were free to empty stockings and open                As another Yuletide approaches, I find my-       Christmas, that is what I want. Write them
presents. My parents seldom bought any of               self in an interesting position. My children are     down, type them up, finish that last paragraph,
the circled items, explaining they looked cheap         grown and my parents have passed on. Grand-          and send them in. Don’t be intimidated. Our
and wouldn’t last. I am sure there was a lesson         children are awesome and I love spoiling them        journal is written by the physicians of BC for
in there somewhere. Regardless, I was blessed           on Christmas; however, I find myself restless        the physicians of BC, so that means you. Please
to grow up in a home that could afford all the          and longing for the good old days. Therefore, I      do your part to make this aging editor’s dream a
trappings of the holidays.                              have decided that this Christmas should once         reality this Christmas. You all have something
    Over the years Christmas has become less            again be all about me and my wants (don’t            valuable to share and I want to read it.
about receiving and more about giving. The focus        judge me). So, what does an editor desire for            Happy Holidays. n
shifted to shopping for my spouse and children.         the year ahead? To paraphrase Mariah Carey,          —David Richardson, MD
This can be stressful, but the joy and happiness        “All I want for Christmas is you!”

                                                                                       2,300 BC pedestrians are injured
                                                                                                   in car crashes every year.
                                                                                      Doctors of BC has launched a safety campaign to
                                                                                     help make the province’s roadways a safer place for
                                                                                                        pedestrians.

                                                                                     BE SEEN        KEEP YOUR         USE                    EYE
                                                                                                    HEAD UP           CROSSWALKS             CONTACT
                                                                                                                                             IS KEY

                                                                                     Let British Columbians know that the province’s
                                                                                     physicians care about their safety by hanging a

                                                                                     armbands for your patients.

                                                                                                                    To get posters and armbands for
                                                                                                                                your practice, email:
                                                                                                                   communications@doctorsofbc.ca

372 BC Medical Journal vol. 61 no. 10 | december 2019
editorials

New research on hormones
and breast cancer:
The headlines don’t convey
what women need to know

R
         esearchers in the UK recently pub-             As doctors, we are continually challenged to      estrogen, normally produced by the ovaries, and
         lished the results of a worldwide analy-   interpret scientific research and then distill the    the body’s struggle to re-equilibrate. Although
         sis on menopausal hormone therapy          relevant parts into language that our patients        they are not life threatening, these complaints
and breast cancer risk in the Lancet.1 The anal-    understand. Sometimes, however, we are merely         should not be dismissed as trivial.
ysis included 58 studies, published between         a second opinion to the media. Like it or not, Dr         For example, menopause in one of our pa-
1992 and 2018, of over 100 000 postmenopausal       Google has become the most accessible medi-           tients, a lawyer, led to unpredictable sweats that
women with breast cancer. They found that           cal resource in the world. So when our patients       caused her to appear distracted and nervous
women who had ever taken hormone therapy            get bad information online before they see us,        in the courtroom. She chose to take hormone
had a higher incidence of breast cancer than        it makes our job that much harder and, more           therapy to help ease her body through the tran-
those who had not.                                  importantly, it compromises their health care.        sition and credited it with keeping her fast-
    Now, these findings are significant and pub-        A brief history of menopause and hormone          paced career on track. Another professional, a
lished in a reputable journal, but they are no-     therapy is required to understand the impact          surgeon, could not practise because sweat from
where near as astonishing as the news media         of these recent titles. Menopause is a normal         her face would drip into patients’ open incisions.
portrayed them to be.                               stage of life for women. A girl is born with a        She also chose hormone therapy to allow her
    Immediately after the results, sensational      finite number of eggs that decrease over her          career to continue.
and fear-provoking interpretations appeared         lifetime until there are none left, and she enters        Hormone therapy mitigates menopausal
in the headlines. The Telegraph reported, “HRT      menopause. On average this happens around 51          symptoms by giving back a small dose of estro-
raises breast cancer risks by a third, major Ox-    years old, but anywhere from 45 to 55 is normal.      gen. Contemporary regimens most commonly
ford study finds,” and the Guardian read, “Breast       While some women navigate this major life         involve an estrogen patch, gel, or tablet. Doc-
cancer risk from using HRT is ‘twice what was       event without issue, 60% to 80% of women will         tors individualize the amount to find the low-
thought.’” The Independent conveyed, “Meno-         encounter symptoms that worsen their qual-            est effective dose for each woman. Unless the
pausal hormone therapy linked to greater breast     ity of life.5,6 Hot flushes, night sweats, trouble    woman has had a hysterectomy, she would also
cancer risk for more than a decade after use.”2-4   sleeping, memory problems, and depressed              be prescribed progesterone to limit the growth
    These headlines might entice readers, but       mood are some of the most common concerns.            of the uterine lining, which could otherwise
they certainly do not help women.                   These symptoms stem from the abrupt loss of           cause bleeding.

Dr Dunne is a co-director at the Pacific
Centre for Reproductive Medicine in
Vancouver and a clinical assistant
professor at the University of British
Columbia. She serves on the BCMJ
Editorial Board. Dr Rowe is an associate
professor at the University of British
Columbia, former Editor-in-Chief of the
Journal of Obstetrics and Gynaecology
Canada, and a former BCMJ Editorial
Board member. He is a recognized expert
in menopause and hormone therapy.

                                                                                                         BC Medical Journal vol. 61 no. 10 | december 2019 373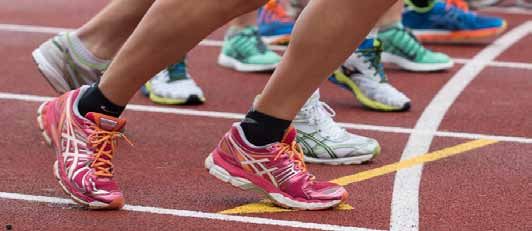
EDITORIALS

    In the 1990s hormone therapy was common.                illustrate with a simple example, a headline that     quote a recent statistician’s words in the New
After the results of the Women’s Health Initia-             reads, “double the risk of dying” (a relative risk    Yorker, “How impressed should we be by very
tive (WHI) study in 2002 and 2004, however,                 of 2.0) might actually be referring to an absolute    strong evidence for a very weak effect?”12 n
the number of women starting hormone therapy                risk of 1% going up to 2%.                            —Caitlin Dunne, MD
dropped from 1 in 12 to 1 in 20.7-9 Further-                    In this UK study, the relative risk conveys       —Timothy Rowe, MBBS, FRCSC, FRCOG
more, of the women already taking hormones                  how often the event (i.e., breast cancer) hap-
when the WHI study was released, one in five                pened in the hormone therapy group versus the         References
stopped them. Among the main reasons they                   group that did not take hormones. Women 50            1.  Collaborative Group on Hormonal Factors in Breast
did so was media reporting.9                                to 54 years old currently using hormones had              Cancer. Type and timing of menopausal hormone
                                                                                                                      therapy and breast cancer risk: Individual participant
    It is imperative that we step back and ex-              a relative risk of 2.1, which can be interpreted
                                                                                                                      meta-analysis of the worldwide epidemiological evi-
amine how we explain medical research to the                as being twice as likely to get breast cancer. That       dence. Lancet 2019;394(10204):1159-1168.
public. Framing the results of a study with the             sounds pretty scary to most people. Fortunately,      2. Bodkin H. HRT raises breast cancer risk by third, major
appropriate context and magnitude can drasti-               doctors are trained to rely on the absolute risk.         Oxford study finds. Telegraph. Accessed 8 October
                                                                                                                      2019. www.telegraph.co.uk/science/2019/08/29/hrt
cally change how people read them.                          It is much more meaningful as it refers to the
                                                                                                                      -raises-breast-cancer-risk-third-major-oxford-study
    When we teach medical students about re-                probability of breast cancer in a population of           -finds.
search, one of the most important principles                women exposed to hormone therapy.                     3. Boseley S. Breast cancer risk from using HRT is ‘twice
of critical appraisal is interpreting the real-life             The authors of the Lancet study actually did          what was thought.’ Guardian. Accessed 8 October 2019.
risk. In statistical terms this is referred to as the       an excellent job of stating the absolute risks on         www.theguardian.com/science/2019/aug/29/breast
                                                                                                                      -cancer-risk-from-using-hrt-is-twice-what-was-thought.
absolute risk versus the relative risk. Relative            the front page. Unfortunately, media headlines        4. Massey N, Crew J. Menopausal hormone therapy linked
risk is usually the less useful but more dramatic           did not focus on that paragraph. The conclu-              to greater breast cancer risk for more than a decade
statistic—the one often cited in headlines. To              sion was that taking estrogen and progesterone            after use. Independent. Accessed 8 October 2019.
                                                            for 5 years was associated with one additional            www.independent.co.uk/news/health/menopausal
                                                                                                                      -hormone-therapy-breast-cancer-risk-decade-after
                                                            breast cancer in every 50 women.1 To put things           -use-a9084661.html.
                                                            in perspective, that is actually a smaller risk       5. Gallagher J. Breast cancer: Menopausal hormone ther-
                                                            increase than drinking alcohol, not breastfeed-           apy risks ‘bigger than thought.’ BBC News. Accessed 8
                                                            ing, or being overweight.5 Furthermore, as the            October 2019. www.bbc.com/news/health-49508671.
                                                                                                                  6. Reid R, Abramson BL, Blake J, et al. Managing meno-
                                                            North American Menopause Society empha-
                                                                                                                      pause. J Obstet Gynaecol Can 2014;36:830-833.
                                                            sized, these results are observational associa-       7. Rossouw JE, Anderson GL, Prentice RL, et al. Risks and
  BC Medical Journal                                        tions rather than cause-and-effect conclusions,
  @BCMedicalJrnl
                                            Follow                                                                    benefits of estrogen plus progestin in healthy post-
                                                            which are normally restricted to randomized               menopausal women: Principal results from the Wom-
  The BC Medical Journal provides continuing medical                                                                  en’s Health Initiative randomized controlled trial. JAMA
  education through scientific research, review articles,
                                                            controlled trial.4,10
                                                                                                                      2002;288:321-333.
  and updates on contemporary clinical practice.                The problem, as with our periodic “pill           8. Anderson GL, Limacher M, Assaf AR, et al. Effects of con-
  #MedEd                                                    scares” related to birth control pills, is that bad       jugated equine estrogen in postmenopausal women
           Reducing physician #burnout: Clinic              news grabs a reader’s attention but good news             with hysterectomy: The Women’s Health Initiative ran-
                                                                                                                      domized controlled trial. JAMA 2004;291:1701-1712.
           support for patients’ social issues can          does not. In emphasizing an arguably small (and
           help. The @CMA_Docs Statement                                                                          9. Crawford SL, Crandall CJ, Derby CA, et al. Menopausal
                                                            previously known) risk of breast cancer when              hormone therapy trends before versus after 2002: Im-
           on Physician #Health and #Wellness
           identifies physician health as a #quality        framing a story about hormone therapy, we are             pact of the Women’s Health Initiative Study Results.
           indicator in the overall functioning of          missing the big picture. Menopausal women                 Menopause 2018;26:588-597.
           health systems.                                                                                        10. Faubion SS. NAMS Responds - Lancet article on tim-
                                                            take hormone therapy because it makes their
           Read the article: bcmj.org/gpsc/reducing-                                                                  ing of HT and breast cancer risk. Accessed 8 Octo-
           physician-burnout-clinic-support-patients-       lives tolerable and their careers manageable, not         ber 2019. www.menopause.org/docs/default-source/
           social-issues-can-help                           because they really want to take it.                      default-document-library/2019-08-30-lancet-article
                                                                The commentaries that have appeared in                -on-timing-of-ht-and-breast-cancer.pdf.
                                                            response to this recent report all stress the im-     11. Kauntiz AM. Menopausal hormone therapy: Let the
                                                                                                                      women decide. Medscape. Accessed 8 October 2019.
                                                            portance of individualized decisions for women            www.medscape.com/viewarticle/919243?nlid=1319
                                                            considering hormone therapy, and that’s as it             42_904&src=WNL_mdplsfeat_191008_mscpedit_ob
                                                            should be.10,11 No menopausal woman should                gy&uac=212025CG&spon=16&impID=2123360&faf=1.
                                                            take hormone therapy without a careful assess-        12. Fry H. What statistics can and can’t tell us about our-
                                                                                                                      selves. New Yorker. Accessed 8 October 2019. www
                                                            ment of her individual risk and the potential
                                                                                                                      .new yorker.com/magazine/2019/09/09/what
                                                            benefit, conducted with a knowledgeable care              -statistics-can-and-cant-tell-us-about-ourselves.
                                                            provider. Women and health care professionals
  Follow us on Twitter for regular updates                  should not be alarmed by the latest news. To

374 BC Medical Journal vol. 61 no. 10 | december 2019
president’s comment

                               Strength in numbers:
                               The power of cooperation
                               “We must use collegiality not to level people down, but to bring
                                 together their strength and creativity.” —Andy Hargreaves

A
          s my year as Doctors of BC President       very different interpretations of the same events. patient access to quality care. I have noticed the
          reaches the halfway mark, I am re-         Maintaining and fostering this sense of profes- positive impact on relationships with our gov-
          flecting on my mandate to date. In my      sionalism and collegiality becomes even more erning bodies, allied health, and public not-for-
inauguration speech, I spoke about leadership,       crucial in this context.                           profits in improving on-the-ground resources
professional culture, connectivity, change in our        When I sat down to write this column, I and access to care.
rapidly evolving world, and the need for cour-       reflected on how I could best define collegiality.    I would like to challenge you all to take
age. I am committed to supporting and building       The Merriam-Webster Dictionary defines the a moment, look at the work your colleagues
courage in physicians across our province. This      word colleague as, “an associate or co-worker do every day, and ask, “What can I do in my
courage enables them to lead the changes our         typically in a profession or                                             work that will improve
health care system needs to be both compre-          in a civil or ecclesiastical                                             the day-to-day work of
hensive and sustainable moving into the future.      office and often of simi-
                                                                                              If we can respect               my colleagues and foster
To meet these goals I outlined back in June, I       lar rank or state: a fellow             each other’s work,               a better system for all of
have been traveling across the province to begin     worker or professional.”            viewpoints, and ideas,               us?” If you see nothing,
to understand how my colleagues are defining,        I would suggest that the             we can cooperate and                then I encourage you to
meeting, and resolving these challenging issues,     active definition of colle-                                              reach out and ask, as you
                                                                                           provide the support
and learning how Doctors of BC can support           giality encompasses much,                                                may in fact not have the
their work.                                          much more and includes                   needed to make                  full picture.
    Those of us who have traveled, volunteered,      the principles of respect,             necessary changes.                    There is no room for
or worked abroad understand that traveling and       commitment to moral                                                      empire building or ego in
sharing experiences changes who we are at a          principles, and valuing the                                              this type of collegial work.
fundamental level that can be hard to define.        work of others. Collegiality builds trust. If we No matter how you as an individual apply the
We understand that listening to stories and          can respect each other’s work, viewpoints, and professional skills you have acquired to date,
attempting to understand the experiences of          ideas, we can cooperate and provide the support we are all an invaluable part of a much greater
others is transformative and goes a long way         needed to make necessary changes. If we are all whole. There is power in supporting each other,
toward breaking down barriers. There is much         committed to the same basic moral principles and exploring new ways to deliver care that we
we can glean through exposure to different           and values as physicians, and we understand simply cannot achieve working in silos. We are
methods of studying, coping, and ultimately          the goals of our health care system, it makes truly Better Together. n
addressing problems.                                 it easier to work as a team where everyone is —Kathleen Ross, MD
    Being invited to attend local meetings with      valued. Our shared commitment to understand- Doctors of BC President
grassroots physicians and Doctors of BC staff        ing each other’s perspectives gives us the power
who provide local support has been transforma-       to lead change.
tive for me personally. I have gained an amazing         I have witnessed firsthand the incredible
amount of direct knowledge in my engagement          collegiality of our colleagues across the prov-
work, but what has been most striking to me is       ince, as they truly value the professional skills
the power of collegiality, particularly in smaller   they each bring to the table. I have seen their
communities. Our personal life experiences and       devotion to solving local issues in a way that
(often unconscious) biases alter our interpreta-     supports, rather than tears down relationships
tion of what we learn from every new encounter.      across specialities, as they build processes that
In fact, people will often leave meetings with       improve both the individual’s working life and

                                                                                                       BC Medical Journal vol. 61 no. 10 | december 2019 375
Clinical

Colin Mar, MD, Janette Sam, MRT, Colleen E. McGahan, MSc, Kimberly DeVries, MSc,
Andrew J. Coldman, PhD

The influence of breast
density on breast cancer
diagnosis: A study of
participants in the BC Cancer
Breast Screening Program
A screening participant’s risk of being diagnosed with an interval
breast cancer following a normal screening mammogram was found
to increase with age and density, and to be roughly similar at 1 year
for women at higher-than-average risk (first degree family history of
breast cancer) to that at 2 years for women at average risk.

ABSTRACT                                                much research, but the results are often summa-        2015. Data from this period were used to examine
Background: Normal fibroglandular tissue appears        rized in ways that do not facilitate understanding     the influence of density on the risk of breast can-
white on a mammogram and is described as dense;         for referring physicians and screening participants.   cer development (Objective 3) and the effect of
fatty tissue appears dark and is described as non-      An analysis of data from the BC Cancer Breast          density on prognostic factors such as tumor size
dense. Increased breast density is associated with      Screening Program was proposed to assess the           and lymph node involvement (Objective 4). The
greater breast cancer risk. Increased breast density    influence of breast density on the risk of cancer      2011 to 2015 data collection period was chosen
also reduces the sensitivity of mammography to          and on breast cancer prognostic factors.               so that notification of any cancer cases to the BC
reveal changes associated with cancer, a concern                                                               Cancer Registry was complete and 5 years of data
referred to as masking. Interval breast cancers are     Methods: Although density scores were not              could be analyzed. The screening history of each
those diagnosed between screening visits and are        required prior to 2018, many BC Cancer Breast          participant in Sample 2 was assessed by screening
more common in women with dense breasts. The            Screening Program centres assigned and recorded        rounds. Screening rounds that followed an abnor-
effects of breast density have been the subject of      this information. Two study samples were abstract-     mal result were excluded from the analysis as par-
                                                        ed from the Breast Screening Program database          ticipants were likely subject to further testing prior
                                                        to achieve four study objectives. Sample 1 data        to returning to screening, and their cases would
Dr Mar is medical director of the BC                    included mammograms of participants age 40 to 74       not necessarily reflect the influence of density on
Cancer Breast Screening Program.                        obtained in 2017 using digital mammography and         mammography performance. A breast cancer was
Ms Sam is operations director of the                    assigned density categories according to the Breast    defined as screen-detected if it was diagnosed in
BC Cancer Breast Screening Program.                     Imaging-Reporting and Data System (BI-RADS):           the 12 months following an abnormal screening
Ms McGahan is director of Cancer                        A (least dense), B, C, or D (most dense). Sample       mammogram. All breast cancers not classified as
Surveillance and Outcomes, BC Cancer.                   1 data were used to describe the distribution of       screen-detected were defined as interval cancers.
Ms DeVries is a biostatistician in Cancer               BI-RADS breast density in the screening popula-        Rates of screen-detected breast cancer and interval
Surveillance and Outcomes, BC Cancer.                   tion (Objective 1). A subset of Sample 1 data was      cancer were calculated and rates were estimated
Dr Coldman is an emeritus scientist in                  used to examine the stability of BI-RADS density       for participants at average risk and higher-than-
Cancer Control Research, BC Cancer.                     categories assigned (Objective 2). Sample 2 data       average risk (i.e., having a family history of breast
                                                        included mammograms performed from 2011 to             cancer in a first-degree relative).
This article has been peer reviewed.

376 BC Medical Journal vol. 61 no. 10 | december 2019
Mar
   C, Sam J, McGahan CE, DeVries K, Coldman AJ                                                                                                           Clinical

Results: Breast density data analyzed for 208 925         to that at 2 years for women at non-elevated risk.outcomes are considerably better than would
BC Cancer Breast Screening Program participants                                                             pertain if they were diagnosed later.
                                                          Further research is needed to elucidate the specific
were seen to vary by age, with a declining propor-        benefits of the increased cancer detection afforded   Screening participants diagnosed with inter-
tion of mammograms assigned BI-RADS C and D               by supplemental testing for screening participantsval cancers have not benefited from screening
scores at increasing ages. Density also varied by         found to have dense breasts.                      since their time of diagnosis and stage of disease
ethnic group, with East Asian participants hav-                                                             at diagnosis are unchanged by participation in
ing denser breasts and First Nations participants         Background                                        screening. In many United States jurisdictions,
the least dense breasts. Density did not vary by          Breasts are composed of varying amounts of legislation mandates the reporting of breast
risk status. When 62 887 mammogram pairs from             fibroglandular and fatty tissue. Normal fibro- density to the referring health care provider
2017 and earlier were compared, concordance was           glandular breast tissue appears white on a mam- and screening participant,8 and supplemental
lowest for mammograms with a BI-RADS score of             mogram and is described                                                  testing is offered to those
D. The majority of participants did not have both         as dense, while fatty breast                                             with denser breasts (iden-
mammograms read by the same radiologist and               tissue appears dark and is              Increased breast                 tified as BI-RADS C or
concordance was lower when different radiolo-             described as non-dense.                                                  D). Currently in British
                                                                                               density is associated
gists read the mammograms than when the same              At the population level                                                  Columbia, breast density
radiologist read both mammograms. Cancer risk             the average amount of                 with greater breast                is reported to screen-
was evaluated by looking at 649 393 screening             dense tissue declines              cancer risk. Density also             ing participants and their
rounds for 388 576 participants. Predicted rates          with increasing age and             reduces the sensitivity              physicians. In Canada,
of interval and screen-detected cancer were cal-          varies by ethnic group.1,2                                               the organization Dense
                                                                                                 of mammography
culated for women of average risk screened on a               Radiologists of the BC                                               Breasts Canada advocates
biennial (currently recommended) basis and for            Cancer Breast Screening                  to demonstrate                  for increased knowledge
women of higher-than-average risk screened on             Program (BCCBSP) as-                  changes associated                 and awareness of the ef-
an annual (currently recommended) basis. Risk of          sess breast composition               with breast cancer.                fects of breast density.9
screen-detected cancer was seen to increase with          using the Breast Imag-                                                       Although the effects
age and to vary with BI-RADS density for both             ing-Reporting and Data                                                   of breast density have
average-risk and higher-than-average-risk women.          System (BI-RADS).3 A breast density category been the subject of much research, the re-
Risk of interval cancer also increased with BI-RADS       of A, B, C, or D is assigned based on the amount sults are often summarized in ways that do
density and with age for average-risk and higher-         of fibrous and glandular tissue that appears on not facilitate understanding for referring physi-
than-average-risk women. Prognostic factors were          a mammogram, with A being least dense (most cians and screening participants. Consequently,
tabulated separately for biennial screen-detected         fatty) and D being most dense (has highest we proposed an analysis of BCCBSP data on
cancers and interval cancers. Screen-detected             proportion of non-fatty tissue). Quantitative density and subsequent breast cancer diagnoses
cancers were smaller than interval cancers and less       scales that assess the proportion of the breast with four objectives:
likely to have nodal involvement. Similarly, tumor        that is dense4 are also common, and automated 1. To describe the distribution of BI-RADS
size increased among interval cancers with increas-       systems producing volumetric density estimates        density categories within the population
ing density, but the likelihood of nodal involvement      are available.5 The BCCBSP currently provides         presenting to BCCBSP for routine breast
did not.                                                  BI-RADS breast density scores with all screen-        screening.
                                                          ing mammography results.                          2. To assess the stabilit y of BI-R ADS
Conclusions: Other studies report similar findings            Increased breast density is associated with       density categories assigned to screening
to those described here, with density declining with      greater breast cancer risk.6 Density also reduces     participants.
age, higher density seen in screening participants of     the sensitivity of mammography to demonstrate 3. To examine the influence of density on
East Asian heritage, instability in density categoriza-   changes associated with breast cancer, a concern      the risk of breast cancer in screening
tion on consecutive mammograms, and instability           referred to as masking.1                              participants.
increasing when mammograms are interpreted                    There is considerable interest in the influ- 4. To examine the effect of density on breast
by different radiologists. When discussing breast         ence of breast density on mammography screen-         cancer prognostic factors.
screening, breast density alone should not be seen        ing performance. Increased risk and masking
as the primary determinant of breast cancer risk.         act synergistically to increase rates of interval Methods
Following a normal screening mammogram, a                 breast cancer that occur between screening The BC Cancer Breast Screening Program
screening participant’s risk of being diagnosed           visits after a normal screening mammogram.7 maintains records of all examinations per-
with an interval breast cancer over the next screen-      The primary objective of breast screening is to formed. Although density scores were not re-
ing round increases with age and density, and is          reduce the risk of breast cancer death in par- quired prior to 2018, many screening centres
roughly similar at 1 year for women at elevated risk      ticipants by diagnosing cancers when treatment assigned BI-RADS density scores and this

                                                                                                                 BC Medical Journal vol. 61 no. 10 | december 2019 377
Clinical                                                                                            The influence of breast density on breast cancer diagnosis

information was recorded in the BCCBSP                  rounds commenced following a normal screen-              interval cancer for participants at average risk
database. This database contains details on the         ing mammogram in the study period.                       and higher-than-average risk.
mammogram performed, including the result,                  A breast cancer was defined as screen-                   The study was approved by the British Co-
and information on the participant (age, self-          detected if it was diagnosed in the 12 months            lumbia Cancer Agency Research Ethics Board
reported ethnic group, etc.). The British Colum-        following an abnormal screening mammogram.               approval number H19-02530.
bia Cancer Registry (BCCR) records all cancers          All breast cancers not classified as screen-de-
diagnosed in British Columbia residents, and            tected that occurred within specified rescreening        Results
it is routinely linked with the Breast Screening        intervals (annual, biennial, or triennial) were          Breast density data were analyzed for 208 925
Program database so that all breast cancers oc-         designated as interval cancers.                          BC Cancer Breast Screening Program par-
curring in screening participants are identified.           Rates of screen-detected breast cancer and           ticipants age 40 to 74 who had a digital mam-
     Two study samples were used to achieve the         interval cancer were calculated and analyzed.            mogram in 2017 [Figure 3]. Density was seen
four study objectives.                                  Rates were estimated for screen-detected and             to vary by age, with an increasing proportion
     Sample 1 data included mammograms of
participants age 40 to 74 obtained in 2017 us-
ing digital mammography and reporting BI-
RADS density [Figure 1]. Sample 1 data were                  Eligibility requirements:                               Data abstracted for Objective 1:
used to describe the distribution of BI-RADS                 • Digital screening mammogram was                       • BI-RADS density, age, ethnic group, risk
                                                                performed in 2017                                      status, mammography result, reporting
breast density categories in the screening popu-                                                                       radiologist on 2017 mammogram
                                                             • Participant was age 40 to 74 at time of
lation (Objective 1). A subset of Sample 1 data                 mammogram
[Figure 1] was used to examine the stability of              • BI-RADS density was reported                          208 925 eligible mammograms identified
BI-RADS density categories assigned (Objec-
tive 2). The interval of 18 to 30 months between
screening rounds was selected to encompass the               Eligibility requirements as above, plus:                Data abstracted for Objective 2:
usual range of rescreening times in participants             • Participant had a digital screening                   • BI-RADS density on each mammogram,
recommended for biennial screening.                             mammogram performed 18–30 months                       age on 2017 mammogram, reporting
     Sample 2 data included mammograms per-                     earlier than the one in 2017                           radiologist on earlier mammogram
                                                             • BI-RADS density was reported on
formed from 2011 to 2015 [Figure 2]. Sample                                                                          62 887 eligible mammogram pairs
                                                                preceding mammogram                                  identified
2 data were used to examine the influence of
density on the risk of breast cancer (Objective
3) and the effect of density on prognostic fac-
                                                        Figure 1. Sample 1 data used to examine BI-RADS breast density categories (Objective 1) and the stability of
tors such as tumor size, whether less than or           BI-RADS categories (Objective 2) in BC Cancer Breast Screening Program population.
more than 15 mm, and lymph node involvement
(Objective 4). The 2011 to 2015 data collection
period was chosen so that notification of any
cancer cases to the BCCR was complete and                    Eligibility requirements:                               Data abstracted for Objective 3:
5 years of data could be analyzed.                           • One or more screening mammograms                      • BI-RADS density, age, ethnic group, risk
     The screening history of each participant                  (digital or analog) performed from                     status, image type, cancer diagnosis, age
                                                                1 January 2011 to 31 December 2015                     at diagnosis
in Sample 2 was assessed by screening rounds.
                                                             • Participant was age 40 to 74 at time of
A screening round started immediately after a                   mammogram
                                                                                                                     649 393 eligible screening rounds
                                                                                                                     identified
mammographic examination and ended with                      • BI-RADS density was reported
the next screening visit, a diagnosis of can-
cer, or the end of the data collection period
(31 December 2015). Each screening round                     Eligibility requirements as above, plus:                Data abstracted for Objective 4:
had factors associated with it taken from the                • Participant diagnosed with an invasive                • BI-RADS density on preceding
preceding screening visit. Screening rounds                     breast cancer                                          mammogram, designation of cancer
                                                             • Participant was screened biennially                     identified (screen-detected or interval),
that followed an abnormal result were excluded                                                                         tumor size, nodal involvement
from the analysis as participants were likely                                                                        1300 eligible cases of breast cancer
subject to further testing prior to returning to                                                                     identified
screening and their cases would not necessarily
reflect the influence of density on mammogra-
phy performance. Consequently, all screening            Figure 2. Sample 2 data used to examine the influence of density on the risk of breast cancer (Objective 3)
                                                        and breast cancer prognostic factors (Objective 4) in BC Cancer Breast Screening Program population.

378 BC Medical Journal vol. 61 no. 10 | december 2019
Mar
C, Sam J, McGahan CE, DeVries K, Coldman AJ Clinical
of BI-RADS A and B mammograms and a BI-RADS category A (5.3%) than category designated D subsequently [Table 1]. Con-
declining proportion of BI-RADS C and D B (9.4%), category C (10.5%), and category cordance overall was 68.7% (same BI-RADS
mammograms at increasing ages. Density also D (10.7%). density on both mammograms) and 82.5%
varied by ethnic group, with East Asian par- When 62 887 mammogram pairs from 2017 for categories C and D combined. The major-
ticipants having the densest breasts and First and earlier were compared, concordance was ity of participants (73.5%) did not have both
Nations participants the least dense. Density lowest for mammograms designated BI-RADS mammograms read by the same radiologist and
did not vary by risk status. Mammograms category D, with only 50.9% of mammograms concordance was lower when different radi-
interpreted as abnormal were less likely in designated as D on the first mammogram being ologists read the mammograms (65.5%) than
Table 1. BI-RADS breast density categories reported on 2017 mammograms compared with categories reported on earlier mammograms.
Result on earlier
Result on 2017 mammogram
mammogram
Category Number BI-RADS D BI-RADS C or D
BI-RADS C
BI-RADS D Same on both (%) on both on both
or D
(% of D on earlier) (% of C or D on earlier)
5872 894 4858
Age 40–49 8742 1520 5564
(67.2%) (58.8%) (87.3%)
14 729 1034 8708
Age 50–59 21 453 2119 10 587
(68.7%) (48.8%) (82.3%)
16 168 585 6531
Age 60–69 23 318 1254 8109
(69.3%) (46.7%) (80.5%)
5623 148 1795
Age 70–74 8165 340 2269
(68.9%) (43.5%) (79.1%)
Same reporting 12 913 769 6285
16 690 1241 7234
radiologist (77.4%) (62.0%) (86.9%)
Different reporting 30 297 1913 15 840
46 197 4031 19 599
radiologist (65.5%) (47.5%) (80.8%)
43 210 2682 22 125
All 62 887 5272 26 833
(68.7%) (50.9%) (82.5%)
BI-RADS density by BI-RADS density by
BI-RADS density by age risk status ethnic group
60 60 60
50 50
40 40 40
% by density
% by density
% by density
30 30
20 20 20
10 10
0 0 0
40–44 45–49 50–54 55–59 60–64 65–69 70–74 No Yes East First Other
Age Family history of Asian Nations
breast cancer in
BI-RADS A BI-RADS B BI-RADS C BI-RADS D first-degree relative
Figure 3. Breast density of participants screened in 2017 by age, risk status, and ethnic group.
BC Medical Journal vol. 61 no. 10 | december 2019 379Clinical The influence of breast density on breast cancer diagnosis
Table 2. Screening round factors considered, including participant risk status, age, ethnic group, BI-RADS when the same radiologist read both mam-
density category, and mode of detection for invasive breast cancers identified. mograms (77.4%).
Cancer risk was evaluated by looking at
Factor Number %
649 393 screening rounds for 388 576 partici-
No 582 337 89.7 pants [Table 2]. The use of screening rounds
First screening visit prior to round
Yes 67 056 10.3 resulted in the data being weighted by par-
No 531 587 81.9 ticipants who attended screening more fre-
Higher-than- average risk quently. Within the study period, 3117 breast
Yes 117 806 18.1
cancers were identified, of which 547 were
40–44 70 532 10.9 ductal carcinoma in situ (DCIS). Most BC-
45–49 106 729 16.4 CBSP screening centres (37 of 41 or 90%)
50–54 109 482 16.9 recorded BI-RADS density for some screen-
ing rounds. Predicted rates of interval and
Age at beginning of screening round 55–59 112 096 17.3
screen-detected cancer were calculated for
60–64 105 262 16.2 average-risk women screened on a biennial
65–69 87 763 13.5 (currently recommended) basis [Figure 4] and
70–74 57 529 8.9 for higher-than-average-risk women screened
on an annual (currently recommended) ba-
Analog 275 044 42.3
Image type of preceding mammogram sis [Figure 5]. Risk of screen-detected can-
Digital 374 349 57.7
cer was seen to increase with age and to vary
East/Southeast Asian 90 077 13.9 with BI-RADS density for both average-risk
Ethnic group First Nations 13 349 2.1 women and higher-than-average-risk women.
Other 535 949 82.5
Risk of interval cancer also increased with
BI-RADS density and with age for average-
A 170 958 26.3
risk and higher-than-average-risk women. For
B 243 738 37.5 women with BI-RADS category D density,
BI-RADS density at preceding mammogram
C 183 487 28.3 however, a change from biennial screening
D 51 210 7.9 to annual screening was found to have only
a modest effect on the predicted proportion
Mode of detection for invasive breast cancer Screen-detected 1513 58.9
of interval cancer found at the next screening
identified Not screen-detected 1057 41.1 visit: a change from 58% (biennial) to 54%
Interval cancer: Age 40–49 Interval cancer: Age 50–59 Interval cancer: Age 60–74
6 6 6
Rate per 1000 women
Rate per 1000 women
Rate per 1000 women
5 5 5
4.3
4 4 4
3 2.6 3 2.8 3 2.8
2 1.7 2 1.8 2 1.6
1.1 1.1
1 0.7 1 1 0.7 1
0 0 0
A B C D A B C D A B C D
BI-RADS density BI-RADS density BI-RADS density
Screen-detected cancer: Age 40–49 Screen-detected cancer: Age 50–59 Screen-detected cancer: Age 60–74
Rate per 1000 women
6 7 7
Rate per 1000 women
Rate per 1000 women
5 6 6 5.7 6.1
5 5.2
4 5 4.2
4 4
3 3 3.2 2.7
2.1 2.2 1.9 3
2.2 3
2 1.5 2 2
1 1 1
0 0 0
A B C D A B C D A B C D
BI-RADS density BI-RADS density BI-RADS density
Figure 4. Predicted rate by age and density for average-risk women to be diagnosed with interval cancer in the next 2 years or screen-detected cancer at the next
biennial screening visit following a normal mammogram.
380 BC Medical Journal vol. 61 no. 10 | december 2019
Interval cancer: Age 40–49 Interval cancer: Age 50–59 Interval cancer: Age 60–74
7 7 7
men
men
men
6 6 6Mar
C, Sam J, McGahan CE, DeVries K, Coldman AJ Clinical
(annual) for women age 40 to 49, from 51% breast cancers were found to vary with age and Other studies
(biennial) to 46% (annual) for women age 50 risk status. Rates of screen-detected cancer var- Other studies report similar findings to those
to 59, and from 45% (biennial) to 40% (an- ied with density, although rates did not increase demonstrated here, with density declining with
nual) for women age 60 to 74. uniformly with increased density. In contrast, age10 and higher density seen in East Asians.11
Prognostic factors were tabulated separately rates of interval cancer increased progressively Similarly, other studies report instability in
for biennial screen-detected cancers and interval with increasing density. Tumor size at diagnosis density categorization on consecutive mam-
cancers [Table 3]. Tumors in screen-detected increased with increasing density, but the like- mograms12 and instability increasing when
cancers were smaller than in interval cancers lihood of nodal involvement did not change.
(P < 10-5) and less likely to have nodal involve-
ment (P < 10-5). Within the screen-detected Table 3. Prognostic factors (tumor size and nodal involvement) for screen-detected, at 18–30 months, and
cancers, tumor size increased with increasing interval, within 24 months, invasive breast cancers compared by BI-RADS density category.
density (test for trend, P = .005), but the like-
Mode of detection
lihood of nodal involvement did not increase
(P = 0.06). Similarly, among interval cancers, Overall rates*
Screen-detected cancer Interval cancer
tumor size increased with increasing density diagnosed 18–30 months diagnosed < 24 months
(P = .0002), butInterval
the likelihood of 40–49
cancer: Age nodal involve- Interval cancer: Age 50–59
% % %
Interval cancer: Age 60–74
% % %
ment did 65not (P = .19). 6 6
Rate per 1000 women
Rate per 1000 women
Rate per 1000 women
Density Number > 15 mm + node Number > 15
5
mm + node > 15 mm + node
5
4 4
(95% CI) (95% CI) (95%
4 CI) (95% CI ) (95% CI) 4.3 (95% CI)
2.8 2.8
Conclusions
3
1.7
2.6 3
25.61.8 11.6
3
50.0 20.6
1.6
2 A 2 2 1.1
The analysis
1 of0.7digital 1screening mammograms 1 0.7207 1.1 (20–32) (8–17)
102
(40–60)
1 (14–29)
32 14
performed0 by the BC Cancer Breast Screening
A B C D
0
A B
0
28.4C D
18.0 58.4 A B
32.6 C D
Program in 2017 showed that breast density
BI-RADS density B 317 BI-RADS density
(24–34) (14–23)
190
(51–65)
36
BI-RADS density
(26–40)
22
decreased with age, was lower in First Nations
and higherScreen-detected
in East Asiancancer:
participants, and did
Age 40–49 Screen-detected 38.4 Age 50–59
cancer: 19.5 65.7 33.3 cancer: Age 60–74
Screen-detected
C 190 201 49 25
(32–46) (14–26) (59–72) (27–40)
not vary by
6 risk status. Examination of consecu-
Rate per 1000 women
7 7
Rate per 1000 women
Rate per 1000 women
5 6 6 5.7 6.1
tive digital4 mammograms found that recorded 5 38.5 15.4 576.1 4.2 28.4 5.2
D 4 26 67 58 22
density was
3 not stable and that concordance
2.1 2.2 3 3 (22–57)
3.2 (6–34)
2.7 (65–85)
4 (19–40)
2 1.5 1.9 2.2 3
(the same1BI-RADS density reported on both 2
30.5 16.5
2
All 740 1
560 161.6 30.2
mammograms)
0 was less likely when different (27–34)
0 (14–19) (58–66)
0 (27–34)
A B C D A B C D A B C D
radiologists interpreted the density
BI-RADS two mammograms. BI-RADS
*Obtained by weighting density and interval cancer rates per 1000 as shown
screen-detected BI-RADS density
in Figure 4.
Rates of screen-detected and interval invasive
Interval cancer: Age 40–49 Interval cancer: Age 50–59 Interval cancer: Age 60–74
7 7 7
Rate per 1000 women
Rate per 1000 women
Rate per 1000 women
6 6 6
5 5 5
4 4 4 3.7
3 2.3 3 2.4 3
2 2 2 1.8
0.6 1.1 0.7 1.2 1
1 0.3 1 0.3 1 0.5
0 0 0
A B C D A B C D A B C D
BI-RADS density BI-RADS density BI-RADS density
Screen-detected cancer: Age 40–49 Screen-detected cancer: Age 50–59 Screen-detected cancer: Age 60–74
Rate per 1000 women
Rate per 1000 women
Rate per 1000 women
7 7 7
6 6 6 5.6
5 5
5.2 4.7
5
4 4 4 3.8
3 3 2.7 2.9 2.5 3
2 1.9 2 1.7 2 2 2
1.4
1 1 1
0 0 0
A B C D A B C D A B C D
BI-RADS density BI-RADS density BI-RADS density
Figure 5. Predicted rate by age and density for higher-than-average-risk women to be diagnosed with interval cancer in the next year or screen-detected cancer at the
next annual screening visit following a negative mammogram.
BC Medical Journal vol. 61 no. 10 | december 2019 381Clinical The influence of breast density on breast cancer diagnosis
mammograms are interpreted by different radi- Digital mammography has been found to show results presented in Figure 4 and Figure 5 be-
ologists.13-15 An increase in the rates of screen- higher sensitivity in the presence of density,21 cause the rate of screen-detected cancer is from
detected and interval cancer with the length of suggesting that the relationships with interval the following screen and not the current screen.
the screening interval (annual, biennial, and tri- cancers reported here could change if all screen- Nevertheless, the ratio of screen-detected to
ennial) is commonly observed.16 Other studies ing for this study had been conducted using screen-detected-plus-interval cancer declines
have also found that rates of screen-detected7 digital mammography. The breast cancer risk with increasing density as has been seen else-
and interval17 cancer vary with reported density. portion of this study used data from 2011 to where. It must also be kept in mind that the
In reporting relationships with screen-detected 2015. During this period the BI-RADS density rates presented in Figure 4 and Figure 5 do not
cancers, studies7 have used density recorded on assessment system was updated to its fifth edi- include in situ breast cancers or breast cancers
the mammogram leading to screen detection tion,3 a change that is reported to have resulted detected at a first screening visit; inclusion of
rather than the preceding mammogram as done in differential classification of mammographic such cases would increase the ratio of screen-de-
in this study. The reason for using the preceding density.22 tected to screen-detected-plus-interval cancers.
mammogram here is so that reported rates of
both screen-detected and interval cancers relate Study implications
to the likelihood of future events in participants Breast density The relationship between higher density and
who have had a normal screening mammogram. decreased with age, was future interval cancer risk is of concern because
it suggests that screening participants with the
lower in First Nations
Risk densest breasts may benefit less from screen-
Many factors other than age, family history, and higher in East Asian ing. On an absolute scale, those with the lowest
and breast density have been found to influence participants, and did density likely benefit the least from screen-
breast cancer risk. These include ethnicity, age not vary by risk status. ing since they have the lowest rate of breast
at menarche, menopause status, history of preg- cancer detected at screening. However, those
nancy, body mass index, activity level, alcohol with the highest density have elevated inter-
consumption, tobacco consumption, and his- Prior to February 2014, British Columbia val cancer rates before the next screening visit
tory of benign breast disease.18 Individual risk is screening policy recommended annual screening and may thus represent the greatest opportu-
not indicated by a single factor alone and tools for women age 40 to 49 and biennial screening nity for potential cancer detection improve-
have been developed to provide estimates using for women age 50 to 79. After 2014, biennial ment. Importantly, though, all age, risk, and
some of these factors.19,20 Using single factors to screening was recommended for average-risk density subgroups are diagnosed with screen-
predict risk is further complicated by negative women age 50 to 74 and 40 to 49 (if electing detected and interval cancers. There is no na-
correlations between some risk factors (e.g., screening), and annual screening for women tional standard defining what risk threshold, if
breast density and body mass index).When with a family history of breast cancer in a first- any, is sufficient to consider altering screening
discussing breast screening, breast density alone degree relative. Consequently, many of the rates recommendations. Indeed, mammography re-
should not be seen as the primary determinant presented in Figure 4 and Figure 5 represent mains the primary screening tool regardless of
of breast cancer risk. screening practice not recommended for part breast density. Current Canadian breast screen-
of the data collection period, and observed rates ing recommendations do not indicate further
Study challenges may have been influenced by factors not cap- breast screening in addition to routine mam-
Although breast density reporting was not re- tured in the analysis. mography.25 In the United States, where most
quired by the screening program during the Sensitivity is commonly used to measure the screening is performed annually, it has been
study, the majority of BC screening centres did accuracy of diagnostic tests. However, as usually suggested17 that an annual interval cancer risk
report density voluntarily and provided these defined, this sensitivity measure cannot be as- threshold of 1 per 1000, which is exceeded for
data to the program. BI-RADS density was sessed in screening participants because of the women with BI-RADS D, is an appropriate
not reported to physicians or patients under- absence of an accepted gold standard for iden- threshold to consider additional screening inter-
going screening and was not used for routine tifying breast cancer in asymptomatic women. ventions. However, the US Preventive Services
clinical care, meaning that the results may not Consequently, alternate measures are used. The Task Force considers evidence to be insufficient
be representative of density when reported for most common of these is period sensitivity,23 to recommend any adjunctive screening on the
use in clinical care. which is equal to the ratio of screen-detected to basis of breast density alone.26
For the evaluation of density category sta- screen-detected-plus-interval cancer rates over In Europe and Australia, breast screening
bility, only digital mammography results were the screening period. Several studies have re- policy does not vary with breast density. In
used. This was not the case for evaluation of ported period sensitivity with density and have Canada, several provinces increase the mam-
breast cancer risk, where 42% of the studies found that it declines with increasing density.24 mography frequency from biennial to annual
were performed using analog mammography. Period sensitivity was not calculated using the for average-risk participants with the densest
382 BC Medical Journal vol. 61 no. 10 | december 2019Mar
C, Sam J, McGahan CE, DeVries K, Coldman AJ Clinical
breasts (generally those categorized BI-RADS disadvantageous. Reported false-positive rates Following a normal screening mammogram,
D). However, our results for women with BI- for breast ultrasound are variable27 and can be a screening participant’s risk of being diag-
RADS category D density show that a change comparable to those associated with screening nosed with an interval breast cancer over the
from biennial to annual screening has only a mammography. In the J-START trial, where next screening round increases with age and
modest effect on the predicted proportion of participating centres received specific train- breast density, and is roughly similar at 1 year
interval cancers. In the US, despite the absence ing on the performance and interpretation of for women at elevated risk to that at 2 years for
of supporting guidelines, it is common to offer screening ultrasounds, 6.6% of participants women at non-elevated risk.
breast ultrasound and possibly breast magnetic had an abnormal screening mammogram re- These findings are intended to facilitate a
resonance imaging to women with BI-RADS C sult. Among those with a normal screening discussion of breast density, breast cancer risk,
or D breast density following a normal screen- mammogram, 5.7% had an abnormal screen- the role of mammography in screening, and the
ing mammogram. Many studies have shown ing ultrasound result. The positive predictive role of supplemental testing. Breast density is
that the addition of breast ultrasound results in one of multiple breast cancer risk factors to be
the identification of mammographically occult considered, and its greatest impact is on the
breast cancer and a recent systematic review27 Rates of interval cancer risk of interval cancer. While women age 40
concluded that it increases the screen-detection to 74 with the densest breasts (BI-RADS D)
increased progressively
rate by an average of 40% of that detected at but of otherwise average risk may benefit the
mammography. A randomized clinical trial with increasing most from additional testing, annual mam-
in Japanese women aged 40 to 49 is currently density. Tumor size at mography was not found to offer a significant
comparing adding ultrasound to mammogra- diagnosis increased improvement.
phy and clinical breast examination.28 The first The benefits and limitations of supplemen-
with increasing density,
round of this study found a 55% increase in tal ultrasound should always be considered.
screen-detected cancer with a similar propor- but the likelihood of Evidence indicates that ultrasound does detect
tional increase across breast densities,29 and a nodal involvement additional cancers but is accompanied by the
37% reduction in interval invasive breast cancer did not change. additional probability of false-positive studies
in those receiving ultrasound screening. While and the need for biopsy.
it is unlikely that screening can produce further Further research is needed to elucidate the
reductions in breast cancer mortality among ex- value for breast cancer detection was 4.8% for specific benefits of the increased cancer de-
isting participants without substantially reduc- the screening mammogram and 3.6% for the tection afforded by supplemental testing for
ing interval cancer rates, reductions in interval screening ultrasound.28 screening participants found to have dense
cancers alone do not guarantee a reduced risk breasts. n
of death. Reductions would also be required Summary
in the overall frequency of advanced cancers Based on findings reported in the literature and Competing interests
(screen-detected-plus-interval). the data presented here, physicians with patients All authors are affiliated with the BC Cancer Breast
The previous discussion concerns the de- enrolled in the BC Cancer Breast Screening Screening Program. Dr Coldman serves as a consul-
tection of invasive breast cancer, but overall Program can expect the following: tant for the BC Cancer Breast Screening Program
approximately 22% of cancers detected on • Younger patients are more likely to have and was paid for drafting this report.
screening mammography are DCIS, which in denser breasts since breast density tends
BC is seen to decline with age. In 2017 DCIS to decrease with age. References
represented 33% of cancer diagnoses in partici- • Women of East Asian heritage are more 1. Price ER, Hargreaves J, Lipson JA, et al. The California
breast density information group: A collaborative re-
pants aged 40 to 49 and only 15% of those 70 likely than other screening participants to
sponse to the issues of breast density, breast cancer
to 79.30 The proportion of DCIS detected by have denser breasts, although their risk of risk, and breast density notification legislation. Radi-
breast ultrasound following a normal mammo- breast cancer is lower on average. ology 2013;269:887-892.
gram is lower than that for mammography. For • Screening participants with a first degree 2. Maskarinec G, Meng L, Ursin G. Ethnic differenc-
es in mammographic densities. Int J Epidemiol
example, in the J-START trial, 37% of cancers family history of breast cancer are not more
2001;30:959-965.
detected by mammography were DCIS versus likely to have dense breasts. 3. D’Orsi CJ, Sickles EA, Mendelson EB, et al. ACR BI-RAD
16% of cancers detected by breast ultrasound in • The breast density categorization of many Atlas, Breast Imaging Reporting and Data System. Res-
those with a normal screening mammogram.28 screening participants will change on ton, VA: American College of Radiology; 2013.
4. Boyd NF, Martin LJ, Sun L, et al. Body size, mam-
Given an estimated conversion rate of DCIS consecutive mammograms.
mographic density, and breast cancer risk. Cancer
to invasive disease of less than 1% per year31 a • Other factors (e.g., body mass index) will Epidemiol Biomarkers Prev 2006;15:2086-2092.
lower proportion of cancers detected by breast influence both breast density and breast 5. Jeffers AM, Sieh W, Lipson JA, et al. Breast cancer risk and
ultrasound than by mammography may not be cancer risk. mammographic density assessed with semiautomated
BC Medical Journal vol. 61 no. 10 | december 2019 383You can also read