Dynamic bacterial community response to Akashiwo sanguinea (Dinophyceae) bloom in indoor marine microcosms
←
→
Page content transcription
If your browser does not render page correctly, please read the page content below
www.nature.com/scientificreports
OPEN Dynamic bacterial community
response to Akashiwo sanguinea
(Dinophyceae) bloom in indoor
marine microcosms
Seung Won Jung1*, Junsu Kang1,2, Joon Sang Park1, Hyoung Min Joo3, Sung‑Suk Suh4,
Donhyug Kang5, Taek‑Kyun Lee6 & Hyun‑Jung Kim1
We investigated the dynamics of the bacterial composition and metabolic function within Akashiwo
sanguinea bloom using a 100-L indoor microcosm and metagenomic next-generation sequencing. We
found that the bacterial community was classified into three groups at 54% similarity. Group I was
associated with “during the A. sanguinea bloom stage” and mainly consisted of Alphaproteobacteria,
Flavobacteriia and Gammaproteobacteria. Meanwhile, groups II and III were associated with the “late
bloom/decline stage to post-bloom stage” with decreased Flavobacteriia and Gammaproteobacteria
in these stages. Upon the termination of the A. sanguinea bloom, the concentrations of inorganic
nutrients (particularly PO43−, NH4+ and dissolved organic carbon) increased rapidly and then decreased.
From the network analysis, we found that the A. sanguinea node is associated with certain bacteria.
After the bloom, the specific increases in NH4+ and PO43− nodes are associated with other bacterial
taxa. The changes in the functional groups of the bacterial community from chemoheterotrophy to
nitrogen association metabolisms were consistent with the environmental impacts during and after
A. sanguinea bloom. Consequently, certain bacterial communities and the environments dynamically
changed during and after harmful algal blooms and a rapid turnover within the bacterial community
and their function can respond to ecological interactions.
The marine bacterial community is a fundamental component contributing to decomposition and primary pro-
duction within marine ecosystems and is a major driver of nutrient cycling in coastal w aters1. The interactions
between phytoplankton and the bacterial community play important roles in shaping the environment by influ-
encing the biogeochemical c ycles2. In particular, the phycosphere (the environment around the phytoplankton
cells where bacteria feed on the carbohydrate sources released by the p hytoplankton2) and the phytoplankton
rely on the bacteria to remineralise organic matter into inorganic substrates that enhance g rowth3. Therefore,
the relationships between bacteria and phytoplankton communities, particularly harmful algal blooms (HABs),
are a promising research field in bacterial ecology because they provide insights into the functional traits of
individual populations and how bacterial communities are controlled by HAB growths, as well as how these
communities are i nterlinked4.
Diverse marine microbial communities interacted with other marine organisms; specifically, they have the
potential to affect HABs5. Importantly, interactions between HABs and bacteria shape their environment6. Yang
et al.7 described how abundances of heterotrophic bacteria rapidly increased after A. sanguinea HABs and DO
concentration dropped as a result of bacterial decomposition. Recently, specific bacterial phylotypes have been
identified as associated with different microalgae. Yang et al.8 reported species-specific relationships between
bacterial communities and A. sanguinea bloom. Our collaborated s tudy9 discussed that certain bacterial com-
munities were closely related to A. sanguinea bloom. In particular, Polaribacter marinivivus may have a symbi-
otic association with A. sanguinea bloom, while Marinovum algicola may be inhibited in HABs. Therefore, it is
important to elucidate the ecological role of specific bacteria associated with HABs.
1
Library of Marine Samples, Korea Institute of Ocean Science and Technology, Geoje 53201, Republic of
Korea. 2Department of Oceanography, Pukyoung National University, Busan 48513, Republic of Korea. 3Division
of Polar Ocean Science, Korea Polar Research Institute, Incheon 21990, Republic of Korea. 4Department of
Bioscience, Mokpo National University, Muan 58554, Republic of Korea. 5Maritime Security Research Center, Korea
Institute of Ocean Science and Technology, Busan 49111, Republic of Korea. 6Risk Assessment Research Center,
Korea Institute of Ocean Science and Technology, Geoje 53201, Republic of Korea. *email: diatoms@kiost.ac.kr
Scientific Reports | (2021) 11:6983 | https://doi.org/10.1038/s41598-021-86590-8 1
Vol.:(0123456789)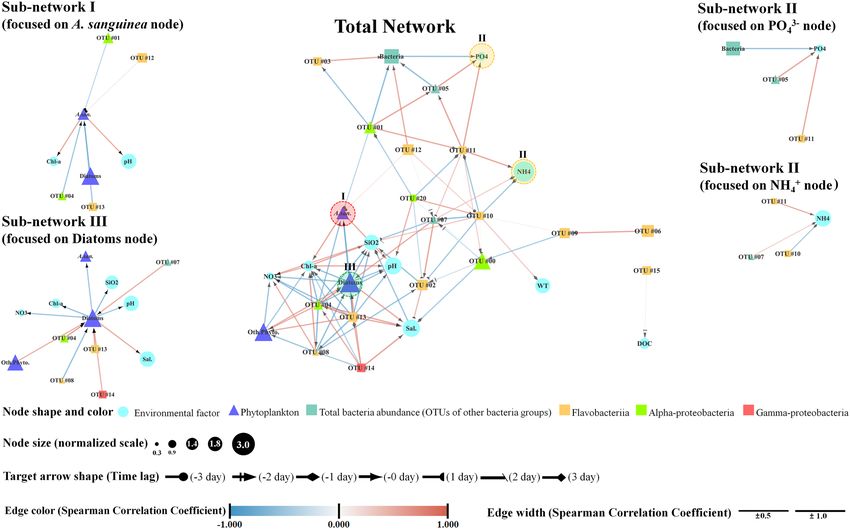
www.nature.com/scientificreports/
The environmental changes and their interactions with bacteria and HABs can increase our understanding
of the microbial ecology. With the advancement of metagenomic next-generation sequencing (mNGS), a big
data (large volume of sequencing) has been analysed. Recently, molecular ecological studies have used mNGS to
estimate changes in population and community dynamics10. In addition, new technologies for studying aquatic
microbial diversity require smaller volumes and nanograms of DNA11. Microcosm or mesocosm experiments
mimic real e cosystems12,13, and can clarify the effects of changes in biotic and abiotic factors, providing an
important link between laboratory and field d ata14,15. Our previous research revealed how bacterial composi-
tion changed with A. sanguinea blooms, similar to natural ecosystem e nvironments9. In this study, we explored
the genetic dynamics of the bacterial community during A. sanguinea bloom and after its termination using
indoor 100-L microcosms. We also investigated bacterial community distributions and their functions as major
decomposers in microcosms following the termination of an A. sanguinea bloom.
Results
Changes in environmental parameters correlated with A. sanguinea abundance. At the ini-
tiation of the experiment, A. sanguinea cells bloomed with a mean abundance of 920 cells mL-1 at the average
water temperature of 18 °C. After decreasing the water temperature to 16 °C on day 4, the abundance rapidly
decreased, and A. sanguinea cells disappeared on day 9 (Supplementary Fig. S1). The pH, dissolved oxygen and
nitrate concentrations decreased similarly with the number of A. sanguinea cells. After the rapid decrease in
A. sanguinea abundance, the NH4+ concentration increased rapidly for 7 days, peaked at 204 ± 12 μM on day
14, and then gradually decreased. A similar pattern occurred with PO43−. Conversely, the SiO2- concentrations
remained between 7.85 and 8.39 μM and did not vary significantly throughout the experimental period. The
dissolved organic carbon (DOC) concentration decreased with decreasing A. sanguinea abundance and then
slightly increased with the termination of the HABs. The chlorophyll a concentration showed similar changes
with the A. sanguinea abundance and significantly correlated with changes in the HABs.
Microbial succession patterns during and after A. sanguinea bloom. In the indoor microcosm,
the total bacteria abundance increased rapidly for the first 7 days, decreased, increased again, and remained
constant until the end of the experiment (Supplementary Fig. S1). The number of operational taxonomic units
(OTUs) and alpha diversity showed similar trends similar to the read counts (Fig. 1a). The bacterial community
was classified into three groups at 54% similarity using non-metric multidimensional scaling (nMDS) analysis
(Fig. 1b). Group I was associated with “during A. sanguinea bloom stage” comprising communities of Alp-
haproteobacteria (48.51%), Flavobacteriia (47.32%), and Gammaproteobacteria (3.43%). Groups II and III were
associated with “late bloom / decline stage to post-bloom stage”, respectively. Flavobacteriia and Gammaproteo-
bacteria decreased in Group II but increased again to 41.05% and 5.85% in Group III, respectively. The result-
ing Venn diagrams showed that bacterial species in Groups I, II, and III represented 147, 234 and 188 taxa,
respectively. In all groups, the common bacteria overlapped in 82 taxa (28.0% of the total number of bacteria)
(Fig. 1c). Groups II and III had the largest OTU overlap of 160 taxa, whereas Groups I and III had the smallest
OTU overlap of 87 taxa.
The common bacterial species in each group displaying a relative abundance of > 1% in at least one sample
included 18 taxa. The accumulated relative abundance of these 18 common bacteria had a mean of 92.50%
(Fig. 2). “During A. sanguinea bloom stage” (Group I), 10 bacterial OTUs were common taxa, and OTUs # 00
(Marinovum algicola), #03 (Polaribacter marinivivus), #08 (Fluviicola taffensis) and #10 (Polaribacter huang-
hezhanensis) in Flavobacteriia were dominant with the mean relative abundances of 39.72%, 15.55%, 6.82% and
7.87%, respectively. Particularly, OTUs #00, #03 and #08 were clustered in one group with 79% similarity. In
Group II (“late bloom/decline stage”), nine bacterial OTUs were common taxa. In particular, OTUs # 00 and #01
(Magnetospira thiophila, Alphaproteobacteria) rapidly increased with 61.13% and 17.17%, respectively. In Group
III (“post-bloom stage”), 12 bacterial OTUs were common taxa. Interestingly, OTU # 00 (the most dominant OTU
in Groups I and II) decreased in Group III to 11.81%. The following OTUs newly and/or rapidly increased: #02
(Cellulophaga tyrosinoxydans, 18.53%), #13 (Paracoccus mangrove, 9.80%), and #09 (Polaribacter atrinae, 5.19%)
in Flavobacteriia; #14 (Pseudohongiella spirulinae, 4.25%) in Gammaproteobacteria; # 04 (Marivita roseacus,
16.92%) and #06 (Tenacibaculum aestuariivivum, 8.26%) in Alphaproteobacteria; and #07 (Halobacteriovorax
marinus, 5.51%) in Deltaproteobacteria. The Venn diagram indicated that bacterial species in Group I, II and
III represented 147, 230 and 188 taxa, respectively. In all samples, the common bacteria overlapped in 82 taxa
(28.0% of the total number of bacteria) (Fig. 1c). In particular, during the A. sanguinea bloom stage (Group I), the
numbers of bacterial OTUs consisted of only 35 taxa. Although these taxa were rare at < 1%, four taxa of OTUs
including #57 (Fluviicola hefeinensis), #74 (Bizionia arctica) and #48 (Tenacibaculum jejuense) in Flavobacteriia
and #43 (Litoricola marina) in Gammaproteobacteria were detected at a relative abundance of 1–0.1%.
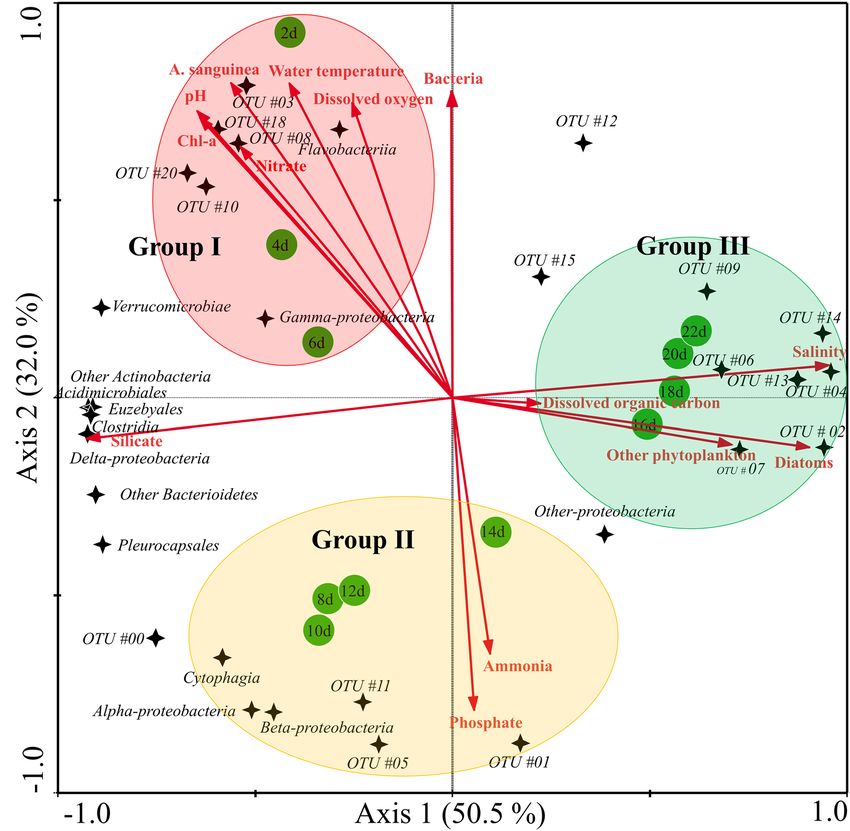
Impact of common bacteria in relation to environmental factors. On the Redundancy analysis
(RDA) biplot in Fig. 3, the lengths of the arrows indicate the relative importance of the variables in explaining
the data set of environments and phytoplankton communities. The angle of the arrows relative to the axes and
to each other indicate the strength of their correlation (Fig. 3). The common bacteria–environment relationship
represented in the plot includes 14 variables that accounted for 50.5% (first axis) and 32.0% (second axis). In
Group I, the cluster in the upper-left quadrant of OTUs #3, #8, #10, #18 (Nereida ignava) and #20 (Thalassobacter
stenotrophicus) were strongly associated with the arrows of A. sanguinea, chlorophyll a, pH, water temperature,
dissolved oxygen and nitrate factors. This cluster reflects the influence of the A. sanguinea bloom. In Group II,
the cluster in the lower-left quadrant the OTUs #00, #01, #05 (Methylotenera versatilis) and #11 (Owenweeksia
hongkongensis) were associated with the P O43− and N
H4+ arrows. This cluster reflects their rapid increases with
Scientific Reports | (2021) 11:6983 | https://doi.org/10.1038/s41598-021-86590-8 2
Vol:.(1234567890)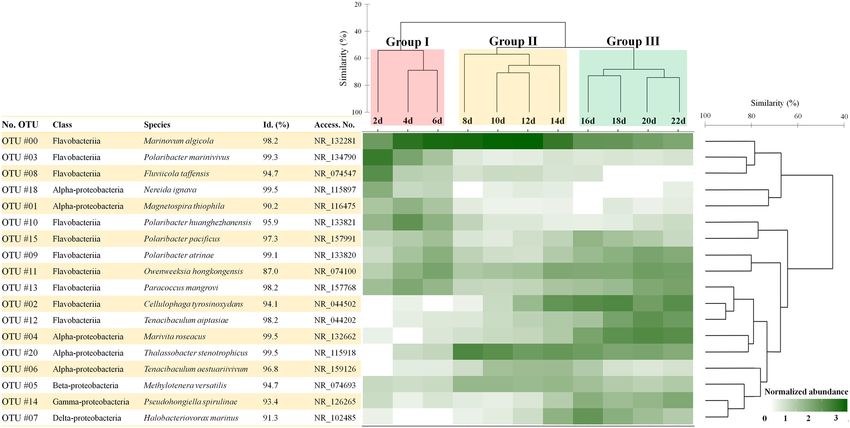
www.nature.com/scientificreports/
Figure 1. Alpha diversity and the distribution of operational taxonomic units (OTUs) in the bacterial
community during Akashiwo sanguinea bloom (Group I) and late/decline stage (Group II) to post-bloom stage
(Group III)” within an indoor microcosm. (a) Box plots of alpha diversity (median, min and max) showing the
numbers of OTUs, Shannon diversity, Chao1 richness and Simpson evenness. (b) Non-metric multidimensional
scaling plot using the Bray–Curtis similarity method. The pie charts indicate the high-ranking taxonomic
distribution at the class level of the bacterial community. (c) Venn diagram showing the shared and unique
bacterial operational taxonomic units. Figure 1c was generated with Veeny v2.1.0 (https://bioinfogp.cnb.csic.es/
tools/venny).
decreasing A. sanguinea bloom. In the Group III cluster in upper-right quadrant the OTUs #02, #04, #06, #07,
#09, #13 and #14 were associated with DOC, diatoms (common species, Pseudo-nitzschia delicatissima, and
Cylindrotheca closterium) and other phytoplankton (autotrophic nanoflagellates) arrows. The Group three clus-
ter reflects the succession of other phytoplankton communities after the termination of the A. sanguinea bloom.
The network analyses involving the common bacterial OTUs, environmental factors, and A. sanguinea bloom
exhibited distinct interactions with specific bacteria communities and environmental factors (Fig. 4, Supplemen-
tary Tables S1 and S2). The network significantly correlated bacterial species and environmental factors with
25 nodes and 90 edges. Environmental factors, including pH and chlorophyll a, were significantly associated
with A. sanguinea bloom, and the HABs had strong negative associations with OTUs #13 (SCC = –0.86, delay
time = 0 day) and #04 (–0.85, 0 day). The abundance of the diatom communities negatively correlated with chlo-
rophyll a and the A. sanguinea bloom. OTUs #07 (0.81, 0 day), #04 (0.98, 0 day), #13 (0.97, 0 day) and #14 (0.80,
0 day) possessed strong positive correlations with diatom abundance. Conversely, #08 was negatively correlated
(–0.94, 0 day) with diatom abundance. N H4+ showed strong positive correlations with OTU #11 (0.88, 0 day),
whereas it was negatively correlated with OTU #10 (–0.77, –1 day). P O43− had strong positive correlations with
OTUs #11 (0.91, 0 day) and #05 (0.91, 0 day).
Functional prediction for presented bacterial community. A total 494 bacterial OTUs were iden-
tified using the pipeline of functional annotation of prokaryotic taxa (FAPROTAX) to evaluate the potential
functional differences among stages (Fig. 5). The functional profiles of stage I showed increases in chemohet-
erotrophy, aerobic chemoheterotrophy, methylotrophy, methanol oxidation, nitrate reduction, fermentation,
phototrophy, photoheterotrophy and aerobic anoxygenic phototrophy. In particular, the functions of chemohet-
erotrophy and aerobic chemoheterotrophy were the most abundant, averaging 30.51% and 27.86% of the total
functional groups, respectively. In stages II and III, the major functional group chemoheterotrophy and aerobic
chemoheterotrophy decreased relatively. The phytotrophy, photoheterotrophy and aerobic anoxygenic phototro-
phy also decreased. Conversely, functional groups associated with the transformation of sulphur, nitrogen and
hydrocarbon sources (i.e., dark oxidation of sulphur compounds, dark thiosulfate oxidation, nitrogen fixation,
Scientific Reports | (2021) 11:6983 | https://doi.org/10.1038/s41598-021-86590-8 3
Vol.:(0123456789)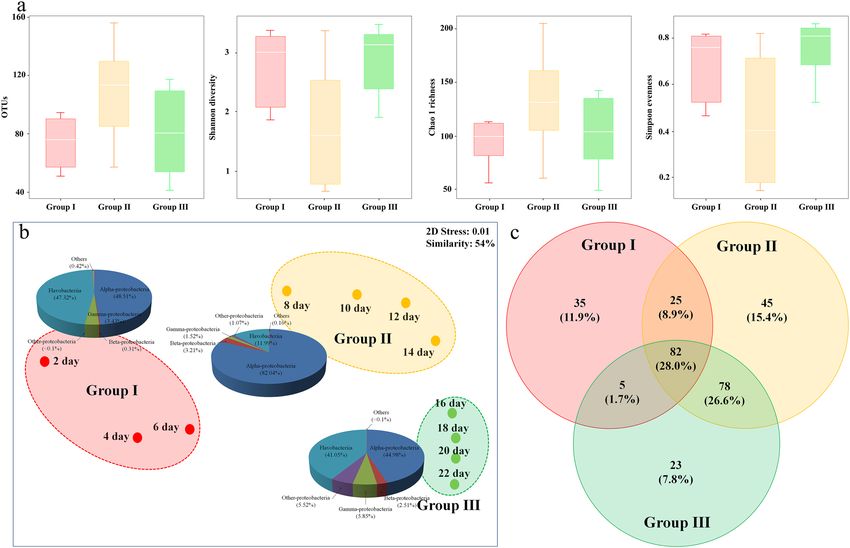
www.nature.com/scientificreports/
Figure 2. Heatmap showing the most abundant bacterial operational taxonomic units (OTUs). Each OTU
displayed a relative abundance of > 1% in at least one sample. The heatmap displayed the fourth root-normalized
data at the range of 0.0 to 3.0. Hierarchical agglomerative clustering using the group average of the most
abundant bacterial OTUs using the Bray–Curtis similarity method. This figure was generated with RStudio
v.1.2.5042 (https://rstudio.com).
nitrogen respiration, nitrite denitrification, hydrocarbon degradation and aromatic hydrocarbon degradation)
increased in abundance when compared to stage I.
Discussion
HABs are a common global ecological issue in coastal waters7,16. In this study, we demonstrated that environ-
mental parameters change with the destruction of A. sanguinea in a closed artificial ecosystem, increasing bac-
terial abundances. PO43− and NH4+ concentrations strongly increased with decreased A. sanguinea abundance.
In our previous mesocosm study, we identified strong correlations between phosphorus and nitrogen sources,
and inorganic nutrient concentrations increased significantly after the lysis of H ABs14. Thus, the increase in
specific inorganic nutrients is the result of the degradation of the released substrates from the destruction of A.
sanguinea cells by specific bacteria. Field monitoring research9 demonstrated that A. sanguinea blooms rapidly
decreased when water temperature was below 16 °C (Fig. 1). Our microcosm experiment results proved that A.
sanguinea growth was inhibited at water temperature below approximately 15 °C. Du et al.17 reported the growth
of a A. sanguinea bloom was inhibited in temperatures below 12 °C. Lee et al.18 suggested HABs are inhibited in
water temperatures below 16 °C in the neighbouring Southern sea of Korea. Previous research has suggested the
optimum growth temperature for A. sanguinea is quite diverse. For example, in the Xiamen Sea of East China, A.
sanguinea grew in a wide temperature range of 18–30 °C19. In the laboratory, the growth temperature of HABs
were relatively higher (over 20 °C) than those obtained in field studies20,21. Therefore, both microcosm studies and
our previous field r esults8 suggest temperature may be a limiting factor for the growth of A. sanguinea blooms.
It appears variations in population growth depend on the regional habitats and temperatures below 16 °C limits
growth in the Southern sea of Korea.
Rapid changes in the structure of the bacterial community reflected the changes in the environmental condi-
tions as demonstrated by the distinct response stages of the A. sanguinea bloom. We identified two stages, namely
“during A. sanguinea bloom stage” (Group I) and “late bloom / decline stage to post-bloom stage” (Groups II and
III). During the A. sanguinea bloom (Group I), Alphaproteobacteria (44.00%) and Flavobacteriia (41.68%) were
the dominant bacterial groups. Other natural or mesocosm phytoplankton studies have revealed specific bacterial
taxa (e.g., Roseobacter in Alphaproteobacteria and Flavobacterium in Flavobacteriia) are commonly associated
with the b looms22,23. Their ecological functions include nutrient provision, release of organic compounds and
competition with algae for a specific ecological niche24–27. Furthermore, many researchers believe that bacterial
community structure affects phytoplankton through mutualistic and parasitic interactions that regulate the
initiation, duration and disappearance of H ABs28–32.
In this stage (Group I), Marinovum algicola (OTU #00, Flavobacteriia) is the pre-dominant taxon. The trend
in changes in OTU #00 was opposite to A. sanguinea cells, with dramatic decreases in OTU #00 levels after the
A. sanguinea bloom terminated. This indicates that the bacterium has algicidal activity or inhibitory effects on
the host A. sanguinea. Further, in this stage, the investigated environmental factors (PO43−, NO3−, DOC, pH
and chlorophyll a) all rapidly decreased, whereas the total bacterial abundance rapidly increased. These rapid
Scientific Reports | (2021) 11:6983 | https://doi.org/10.1038/s41598-021-86590-8 4
Vol:.(1234567890)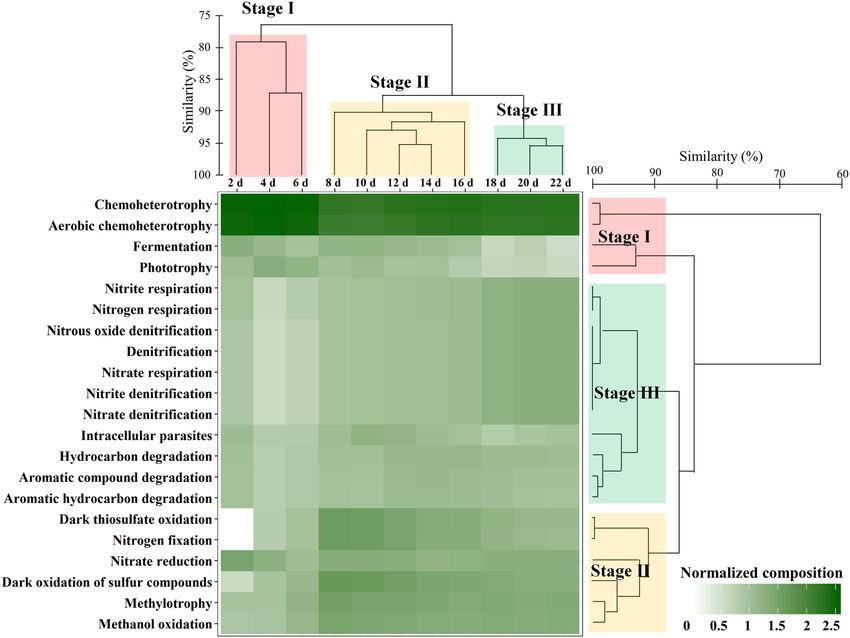
www.nature.com/scientificreports/
Figure 3. Redundancy analysis (RDA) ordinations of the most abundant bacterial operational taxonomic units
(OTUs) associated with environmental and phytoplankton factors. Each OTU displays a relative abundance
of > 1% in at least one sample. The lengths and angles of the arrows represent the correlations between the
environmental and phytoplankton factors (red lines) and the first two RDA axes. The sampling day and the
common bacterial OTUs (at the class level) are indicated green circles and black stars, respectively. Groups I − III
are obtained from the nMDS analysis presented in Fig. 1b. The identified bacterial species with OTU numbers
are displayed in the heatmap in Fig. 2. This figure was generated with CANOCO program v4.55 (http://www.
canoco5.com).
decreases in PO43−, NO3− and DOC concentrations may be due to the increased uptake as energy sources by
the bacteria33. Our findings showed similar changing patterns as Gao et al.34 and Jung et al.13, in which the Alp-
haproteobacterial abundance negatively correlated with NH4+, PO43− and DOC concentrations. The change in
the relative abundances of OTUs #03 (Polaribacter marinivivus) and #08 (Fluviicola taffensis) in Flavobacteriia
strongly correlated with the number of A. sanguinea cells. These bacteria did not appear after the A. sanguinea
bloom termination. Algal extracellular products may select for specific bacterial taxa35, and this may explain the
similarities in the specific bacterial species during the A. sanguinea bloom progression. HABs rely on bacteria
to remineralise organic matter back to its inorganic s ubstituents3.
When the A. sanguinea bloom was decreased (Group II) and terminated (Group III), the NH4+ and PO43− con-
centrations increased rapidly, whereas that of DOC slightly increased and then decreased. These observations
were consistent with the findings of Jung et al.15, their outdoor mesocosm showed the increases in inorganic
nutrients were caused by the release of intercellular substrates from the destruction of HABs. Cell destruction
releases organic substrates that are decomposed by bacterial conversion into mineralised nutrients causing
bacterial population i ncreases33. In this study, the pattern changes in the total bacterial abundance time-lagged
with the HABs changes, indicating that organic matter was decomposed, and that bacterial activity remained
high during this stage7. In these stages, both Flavobacteriia and Gammaproteobacteria decreased in Group II but
Scientific Reports | (2021) 11:6983 | https://doi.org/10.1038/s41598-021-86590-8 5
Vol.:(0123456789)www.nature.com/scientificreports/
Figure 4. Network analysis derived from the most abundant bacterial operational taxonomic units (OTUs)
and the environmental and phytoplankton factors with statistically significant correlations with bacterial OTUs
(P < 0.01; false discovery Q < 0.05). Zoomed images are the sub-networks (I-III) are associated with A. sanguinea,
NH4+, PO43−, diatom nodes and selected adjacent edges. The identified bacterial species with OTU numbers are
displayed in the heatmap on Fig. 2. This figure was generated with Cytoscape v3.7.2 (https://cytoscape.org).
increased again in Group III. OTUs #02, #13 and # 09 in Flavobacteriia, and OTU #14 in Gammaproteobacteria
are important common taxa in Group III. A greater number of certain bacterial species were adapted to highly
eutrophic conditions. Thus, we conclude that specific bacterial diversity is influenced by bacterial lifestyles36.
The relatively higher abundances of Cellulophaga (OTU #02), Paracoccus (#13), Polaribacter (#9) and Pseudo-
hongiella (#14) could be attributed to their eutrophic and specific environmental adaptations. Many researchers
have reported that various specific taxa of Gammaproteobacteria and Flavobacteriia are abundant at the post-
HABs stage37–39. Therefore, the increases in certain taxa of the Gammaproteobacteria population indicate their
adaptation to eutrophic conditions or the presence of eutrophic ecotypes.
Network analysis elucidates the significant associations between host–parasite, host–bacteria and bacte-
ria–environmental factors40,41. For example, Needham et al.32 revealed the profiles and the relationship of the
bacteria and virus to identify interconnectivities. In this study, the A. sanguinea node was associated with specific
bacterial OTUs, and after the bloom, increases in specific environmental nodes (such as N H4+ and PO43−) were
associated with other bacterial OTUs. In particular, fewer bacterial–phytoplankton interactions were observed
compared with those of bacteria–bacteria. This result is consistent with the finding of Cui et al.36. The interac-
tions between bacteria are more complicated than those between the hosts are (here, HABs) and bacteria. Our
network analysis results are consistent with those of the RDA. Thus, certain bacteria specifically respond in
the HABs phycosphere, and after the termination of HABs, the changes in the environment due to the released
substances from the destruction of HAB cells cause changes in other specific bacteria.
Despite this limitation, predicting the putative functional groups using FAPROTAX remains a useful alterna-
tive when metagenomic or meta-transcriptomic data are not available42. We revealed that the functional profiles
of the groups were significantly different. During the A. sanguinea bloom (stage I), there was a high number of
sequences assigned to chemoheterotrophy and aerobic chemoheterotrophy. These functions are categorized as
broad ecosystem functions because they perform many activities and are performed by most m icroorganisms43.
In particular, Amblard et al.44 reported that phytoplankton blooms were associated with chemoheterotrophic
and photoheterotrophic metabolisms. In contrast, the proportions of chemoheterotrophy and aerobic chemo-
heterotrophy decreased in stages II and III, but the functional groups related to nitrogen and hydrocarbon
sources were increased. These increases are consistent with the increase in inorganic nitrogen sources in the
indoor microcosm. Chun et al.45 reported that the functional groups involved in fermentation, nitrate reduc-
tion, ureolysis, hydrocarbon degradation and aerobic ammonia oxidation were increased because of the urea
introduced from the land. In addition, nitrous oxide can be produced directly by the bacterium from ammonium,
nitrate and nitrite46. The ability to degrade and/or utilize hydrocarbon substrates is exhibited by a wide variety of
Scientific Reports | (2021) 11:6983 | https://doi.org/10.1038/s41598-021-86590-8 6
Vol:.(1234567890)www.nature.com/scientificreports/
Figure 5. The time-series heatmap showing the metabolic functions during the changes in bacterial community
composition using functional annotation analysis of the prokaryotic taxa (FAPROTAX). The heatmap displays
the fourth root-normalized data of the bacterial read counts. The time series and functional groups of the
bacterial operational taxonomic units are clustered using the Bray–Curtis similarity method. This figure was
generated with RStudio v.1.2.5042 (https://rstudio.com).
bacteria. In particular, in areas containing oil spills there are metabolic increases in hydrocarbon and/or aromatic
hydrocarbon degradation of specific bacterial p opulations47. Therefore, the changes in the functional groups of
specific bacterial populations are consistent with the environmental impacts during and after A. sanguinea bloom.
Based on this result, we proposed two stages of interactions between the environmental characteristics and
bacterial community in an A. sanguinea bloom. In the first stage termed “during A. sanguinea bloom”, there were
marked changes in the environmental characteristics, i.e., uptake of inorganic nutrient sources (such as nitrate
and phosphate) from the surrounding waters and harbouring of specific bacterial populations. In the second
stage, called “late bloom / decline stage to post-bloom”, the water temperature was below 16 °C and most envi-
ronmental characteristics showed dynamic changes, particularly N H4+ and PO43−. We observed the succession
in phytoplankton species from A. sanguinea to diatoms, particularly pennate diatoms, such as Pseudo-nitzschia
delicatissima and Cylindrotheca closterium. Changes in the bacterial community were also observed. There were
relatively rapid increases in Flavobacteriia and Gammaproteobacteria that remineralised the extracellular prod-
ucts from A. sanguinea. These bacteria participate in biogeochemical cycling, playing an important role in the
dynamics of microbial communities. Therefore, certain bacteria taxa were adapted to more eutrophic conditions.
Moreover, bacteria also change, not just the metabolic functions are consistent with the changes in environmental
factors, in particular energy sources and inorganic nitrogen. Consequently, bacteria taxa and the environment
dynamically change during and after A. sanguinea bloom. The bacterial community can rapidly respond to
ecological interactions. Our research also highlighted the value of frequent sampling when evaluating bacterial
community responses and interactions with phytoplankton.
Methods
Experimental design. The construction of the 100-L indoor microcosm has been previously described13
(Supplementary Fig. S2). In brief, we created three enclosures (triple replicates), each containing 100 L of natural
seawater for supporting an A. sanguinea bloom. To observe the survival and growth of A. sanguinea with tem-
perature changes, the room temperature was maintained at approximately 18 °C for the first three days and then
sustained at 15 °C for 19 days. Light intensity was maintained at 50 E m-2 s-1 under a 16/8 h light/dark cycle. A.
sanguinea-bloomed seawater was gently mixed in each microcosm using three impellers (15 cm long by 6 cm
wide) at a speed of 10 rpm on an automatically controlled run/stop cycle (15 min duration each). The experiment
was terminated after 22 days. We collected 17 sub-samples (daily collection for 12 d, and bi-daily collection for
the last 10 d).
Scientific Reports | (2021) 11:6983 | https://doi.org/10.1038/s41598-021-86590-8 7
Vol.:(0123456789)www.nature.com/scientificreports/
Environmental parameters. The details of the environmental factors and their analysis has been pre-
viously described10,13. Temperature, salinity, pH and dissolved oxygen (DO) were evaluated using a portable
environmental multi-parameter (YSI 6920 model, Xylem brand, OH, USA). An aliquot (100-mL) of each sub-
sample was filtered through a 47-mm glass fibre filter (GF/F; Whatman, Clifton, NJ, USA). The filtered seawater
was then stored in an acid-cleaned polyethylene bottle in a deep freezer at –80 °C. Subsequently, the concen-
trations of dissolved inorganic nutrients, such as nitrate ( NO2− + NO3−), ammonia (NH4+), phosphate ( PO43−)
and silicate (SiO2-), were determined in each sample using an automatic nutrient analyser (Quaatro39; Seal
Analytical Instrument, UK). To analyse the dissolved organic carbon (DOC) concentrations, an aliquot (10-
mL) of each water sample was filtered through a GF/F filter (pre-combusted at 450 °C overnight) under gravity.
The DOC was determined using a high-temperature catalytic combustion instrument (TOC-VCPH; Shimadzu,
Kyoto, Japan). To determine the chlorophyll a concentration, each sample (500-mL) was passed through a GF/F
filter under low-vacuum pressure. Each filter was soaked in cold 90% acetone/distilled water (v/v; 15-mL) and
sonicated to break the cell walls. Then, chlorophyll a was extracted in the dark for 24 h at 4 °C. The chlorophyll a
concentration was measured using a fluorometer (10-AU; Turner Designs, Inc., San Jose, CA, USA).
Microscopic observation. To determine the total number of heterotrophic bacteria, an aliquot (10-mL)
was collected from each sub-sample using a sterilized polyethylene bottle (15-mL). The sample was immediately
fixed with glutaraldehyde at a final concentration of 2%. The sample was stored in the dark at 4 °C prior to
analysis. The fixed bacterial cells were harvested through a black isopore membrane filter (GTBP 02500; Mil-
lipore, Bedford, MA, USA) and stained with 4′,6-diamidino-2-phenylinodole solution (1 μg mL−1)48. At least 600
stained bacterial cells per sample were counted using a Zeiss Axioplan epifluorescence microscope (Carl Zeiss,
Oberkochen, Germany) at a magnification of 1000 × . At least 500 phytoplankton cells per sub-sample were
identified and counted using a phytoplankton (or Sedgwick–Rafter) counting chamber with a light microscope
(Axioplan) at a magnification of 4050 − 1000 × .
Metagenomic next‑generation sequencing of the bacterial community. For mNGS analysis, we
followed the methods of Kim et al.10 and Jung et al.13. To remove the large-sized particles including planktons,
samples were prefiltered using polycarbonate filters (3 μm; TSTP04700; Millipore, Bedford, MA, USA). To ana-
lyse the bacterial community, the filtrate of the 0.2–3.0 μm size fraction from the seawater (500-mL) was divided
into several sections for genomic DNA (gDNA) extraction. gDNA was extracted using a DNeasy Powersoil Kit
(Qiagen, Valencia, CA, USA); the DNA was diluted to a final concentration of 20 ng μL−1. The quantity and
quality of the total gDNA were determined using a Nano-drop (Nano-MD-NS, SCINCO, Ltd., South Korea).
The V3–V4 hypervariable regions of the bacterial 16S rDNA were amplified using the universal Illumina tagged
forward (341F) and reverse (800R) primers (Supplementary Table S3). The amplified products from the first
PCR were individually purified using a QIAquick PCR purification kit (Qiagen, Hilden, Germany). The second
PCR involved 10 cycles using the tags of Nextera XT 96 index kit v2 (Illumina). DNA concentration was meas-
ured using a Bioanalyzer 2100 (Agilent Technologies, Palo Alto, CA, USA). Equal concentrations of the PCR
products for each sample were pooled, merged samples were analysed using a MiSeq platform (Illumina, San
Diego, CA, USA).
The resulting data were pre-processed using Mi-Seq Control Software (MCS) v2.4.1. Raw sequences analysed
using FastQC49 for basic statistics, such as GC percentage. The quality score distribution for each base and any
poor-quality sequences were identified. We also removed any ambiguous and chimeric reads, as well as the noised
sequences (denoising). This procedure involved removing operational taxonomic units (OTUs) with 1, 2, and
3 reads at a cut-off rate of 97%. The processed pair-end reads were then merged using a fast length adjustment
of short reads (FLASH) software tool50. After each sequencing procedure, a quality check was performed to
remove short sequence reads (< 150 bp), low-quality sequences (score < 25 in the 16S rDNA analysis), singletons,
and non-target sequences. Using the basic local alignment search t ool51, all the sequence reads were compared
with those from the National Center for Biotechnology Information database. Sequence reads with an E-value
smaller than 0.01 were further analysed. A pairwise global alignment was performed to identify the most similar
sequences. The taxonomy of the sequences with the highest similarity was assigned to the sequence read (spe-
cies or genus levels with > 97% or > 94% similarity, respectively). To analyse the OTUs, CD-HIT-OTU software52
revealed the clustering and metagenomic functional information. To calculate the alpha-diversity, we used the
closed-reference protocol published by M othur53 based on the OTU table.
Statistical analysis. Alpha diversity (including Chao1, Shannon, and Simpson diversity metrics) and
heat maps were plotted through a combination of RStudio (v. 1.2.5042) using the vegan54, ape55 and ggplot2
packages56. Pearson’s correlation analysis examined the relationships between the measured parameters in SPSS
v.12 (SAS Institute Inc., Cary, NC, USA).
The common bacterial species and environmental variables were analysed using several multivariate tech-
niques. Before the analysis, the environmental factors data and the most abundant bacterial OTUs (each display-
ing a relative abundance > 1% in at least one sample) were primarily fourth root transformed to reduce skewness
and to maximize the signal-to-noise ratio in the dataset57. Using the ranked similarity matrix, an ordination plot
was produced by non-metric multidimensional scaling (nMDS) using PRIMER 6 v. 6.1.1358. The Bray–Curtis
similarity method for hierarchical agglomerative clustering used the group average of the most abundant bacte-
rial OTUs based on the groups selected from the nMDS analysis. To test the null hypothesis (i.e., no significant
difference between the groups in the agglomerative clustering analysis), similarities were analysed with ANOSIM
in the PRIMER 6 program.
Scientific Reports | (2021) 11:6983 | https://doi.org/10.1038/s41598-021-86590-8 8
Vol:.(1234567890)www.nature.com/scientificreports/
A redundancy analysis (RDA) investigated the common bacterial species–environment relationships. A Pear-
son correlation matrix identified the correlated variables within this data set. Environmental variables below
the detection limits at most sites were not included in the RDA, and only those contributing significantly to the
analysis (as assessed using the forward selection) were included in the final RDA. The ratio of the eigenvalues
of the constrained first axis to the second unconstrained axis was also examined because this ratio is typically
indicative of an important variable in controlling common bacterial distributions59. The RDA was calculated
with the CANOCO program version 4.5560. All axes were tested for significance using 999 unrestricted Monte
Carlo permutations.
The correlation-based association networks are focused on the co-occurrence patterns and potential key-
stone taxa in bacterial interconnectivity between A. sanguinea and environmental factors. An extended local
similarity analysis (eLSA)61 involved 11 datasets (bi-daily interval time of 22 days of total experimental duration)
to analyse the covariation among the most abundant 19 bacterial OTUs, 3 phytoplankton groups (or species),
and 10 environmental factors. P-values were determined using statistical approximation followed by permuta-
tion testing to reduce computing time and to ensure accuracy, whereas the Q-value (false discovery rate) was
ositives62. The eLSA network of Spearman correlation coefficients
calculated to estimate the likelihood of false p
(SCC) between the variables was visualized using Cytoscape v3.7.263 with P < 0.01 and Q < 0.05. The sampling
was evenly spaced in two-day intervals, therefore, the maximum time-lag was 10 days. The sub-networks were
selected using A. sanguinea, NH4+ and PO43− nodes and their adjacent edge types. Random undirected networks
of equal sizes (based on the number of nodes and edges) were calculated using the Erdös–Rényi model in the
Random Network plugin in Cytoscape.
Functional annotation of the presented common bacterial community. A functional prediction
using the functional annotation of prokaryotic taxa (FAPROTAX) and the database of metagenomics of bacte-
rial community was used to identify ecosystem functions, although the database is not exhaustive42. FAPROTAX
was performed using python collapse_table.py with the normalized OTU table61. The FAPROTAX dataset (avail-
able at http://www.zoology.ubc.ca/louca/FAPROTAX) is a manually constructed database based on cultured
representatives of marine and freshwater microbiomes45. The functional group abundances in each module were
calculated by multiplying the calculated values (“function tables”) and the total sum of the OTUs belonging to
each major module.
Data availability
The raw sequencing data (Fastaq files) of 16S rDNA obtained from the Mi-Seq platform were deposited in the
Sequence Read Archive database at NCBI under accession numbers: SRR11282902-11,282,934 (PRJNA 611,673).
Received: 15 July 2020; Accepted: 17 March 2021
References
1. Azam, F. et al. The ecological role of water-column microbes in the sea. Mar. Ecol. Prog. Ser. 10, 257–263 (1983).
2. Seymour, J. R., Amin, S. A., Raina, J.-B. & Stocker, R. Zooming in on the phycosphere: the ecological interface for phytoplankton–
bacteria relationships. Nat. Microbiol. 2, 17065 (2017).
3. Worden, A. Z. et al. Rethinking the marine carbon cycle: factoring in the multifarious lifestyles of microbes. Science 347, 1257594
(2015).
4. Andersson, A. F., Riemann, L. & Bertilsson, S. Pyrosequencing reveals contrasting seasonal dynamics of taxa within Baltic Sea
bacterioplankton communities. ISME J. 4, 171–181 (2010).
5. Chen, T., Liu, Y., Song, S. & Li, C. Characterization of the parasitic dinoflagellate Amoebophrya sp. infecting akashiwo sanguinea
in coastal waters of China. J. Eukaryotic Microbiol. 65, 448–457 (2018).
6. Azam, F. & Malfatti, F. Microbial structuring of marine ecosystems. Nat. Rev. Microbiol. 5, 782–791 (2007).
7. Yang, C. et al. Bacterial community dynamics during a bloom caused by Akashiwo sanguinea in the Xiamen sea area, China.
Harmful algae 20, 132–141 (2012).
8. Yang, C. et al. A comprehensive insight into functional profiles of free-living microbial community responses to a toxic Akashiwo
sanguinea bloom. Sci. Rep. 6, 34645 (2016).
9. Kang, et al. Zooming on dynamics of marine microbial communities in the phycosphere of Akashiwo sanguinea (Dinophyta)
blooms. Mol. Ecol. 30, 207–221 (2021).
10. Kim, H. J. et al. Effects of temperature and nutrients on changes in genetic diversity of bacterioplankton communities in a semi-
closed bay, South Korea. Mar. Pollut. Bull. 106, 139–148 (2016).
11. Flaviani, F. et al. A pelagic microbiome (viruses to protists) from a small cup of seawater. Viruses 9, 47 (2017).
12. Jung, S. W. et al. Can the algicidal material Ca-aminoclay be harmful when applied to a natural ecosystem? An assessment using
microcosms. J. Hazard. Mater. 298, 178–187 (2015).
13. Jung, S. W., Noh, S. Y., Kang, D. & Lee, T.-K. Comparison of bacterioplankton communities between before and after inoculation
with an algicidal material, Ca-aminoclay, to mitigate Cochlodinium polykrikoides blooms: assessment using microcosm experi-
ments. J. Appl. Phycol. 29, 1343–1354 (2017).
14. Jung, S. W., Kim, B. H., Katano, T., Kong, D. S. & Han, M. S. Pseudomonas fluorescens HYK0210-SK09 offers species-specific
biological control of winter algal blooms caused by freshwater diatom Stephanodiscus hantzschii. J. Appl. Microbiol. 105, 186–195
(2008).
15. Jung, S. W. et al. Testing addition of Pseudomonas fluorescens HYK0210-SK09 to mitigate blooms of the diatom Stephanodiscus
hantzschii in small- and large-scale mesocosms. J. Appl. Phycol. 22, 409–419 (2010).
16. Anderson, D. M. Turning back the harmful red tide. Nature 388, 513–514 (1997).
17. Du, X., Peterson, W., McCulloch, A. & Liu, G. An unusual bloom of the dinoflagellate Akashiwo sanguinea off the central Oregon,
USA, coast in autumn 2009. Harmful Algae 10, 784–793 (2011).
18. Lee, C.-K., Lee, O.-H. & Lee, S.-G. Impacts of temperature, salinity and irradiance on the growth of ten harmful algal bloom-
forming microalgae isolated in Korean coastal waters. The Sea (J Korean Soc Oceanogr) 10, 79–91 (2005).
Scientific Reports | (2021) 11:6983 | https://doi.org/10.1038/s41598-021-86590-8 9
Vol.:(0123456789)www.nature.com/scientificreports/
19. Luo, Z. et al. Cryptic diversity within the harmful dinoflagellate Akashiwo sanguinea in coastal Chinese waters is related to dif-
ferentiated ecological niches. Harmful Algae 66, 88–96 (2017).
20. Chen, T. et al. The effects of major environmental factors and nutrient limitation on growth and encystment of planktonic dino-
flagellate Akashiwo sanguinea. Harmful Algae 46, 62–70 (2015).
21. Matsubara, T. et al. Effects of temperature, salinity, and irradiance on the growth of the dinoflagellate Akashiwo sanguinea. J. Exp.
Mar. Biol. Ecol. 342, 226–230 (2007).
22. Teeling, H. et al. Substrate-controlled succession of marine bacterioplankton populations induced by a phytoplankton bloom.
Science 336, 608–611 (2012).
23. Buchan, A., LeCleir, G. R., Gulvik, C. A. & González, J. M. Master recyclers: features and functions of bacteria associated with
phytoplankton blooms. Nat. Rev. Microbiol. 12, 686–698 (2014).
24. Riemann, L., Steward, G. F. & Azam, F. Dynamics of bacterial community composition and activity during a mesocosm diatom
bloom. Appl. Environ. Microbiol. 66, 578–587 (2000).
25. Jones, K. L., Mikulski, C. M., Barnhorst, A. & Doucette, G. J. Comparative analysis of bacterioplankton assemblages from Karenia
brevis bloom and nonbloom water on the west Florida shelf (Gulf of Mexico, USA) using 16S rRNA gene clone libraries. FEMS
Microbiol. Ecol. 73, 468–485 (2010).
26. Theroux, S., Huang, Y. & Amaral-Zettler, L. Comparative molecular microbial ecology of the spring haptophyte bloom in a Green-
land arctic oligosaline lake. Front. Microbiol. 3, 415 (2012).
27. Amin, S. et al. Interaction and signalling between a cosmopolitan phytoplankton and associated bacteria. Nature 522, 98–101
(2015).
28. Mayali, X. & Azam, F. Algicidal bacteria in the sea and their impact on algal blooms. J. Eukaryot. Microbiol. 51, 139–144 (2004).
29. Tan, S. et al. An association network analysis among microeukaryotes and bacterioplankton reveals algal bloom dynamics. J. Phycol.
51, 120–132 (2015).
30. Cruz-López, R., Maske, H., Yarimizu, K. & Holland, N. A. The B-vitamin mutualism between the dinoflagellate Lingulodinium
polyedrum and the bacterium Dinoroseobacter shibae. Front. Mar. Sci. 5, 274 (2018).
31. Park, B. S., Joo, J.-H., Baek, K.-D. & Han, M.-S. A mutualistic interaction between the bacterium Pseudomonas asplenii and the
harmful algal species Chattonella marina (Raphidophyceae). Harmful Algae 56, 29–36 (2016).
32. Needham, D. M., Sachdeva, R. & Fuhrman, J. A. Ecological dynamics and co-occurrence among marine phytoplankton, bacteria
and myoviruses shows microdiversity matters. ISME J. 11, 1614–1629 (2017).
33. Bloem, J., Starink, M., Bär-Gilissen, M.-J.B. & Cappenberg, T. E. Protozoan grazing, bacterial activity, and mineralization in two-
stage continuous cultures. Appl. Environ. Microbiol. 54, 3113–3121 (1988).
34. Gao, X., Olapade, O. A. & Leff, L. G. Comparison of benthic bacterial community composition in nine streams. Aquat. Microb.
Ecol. 40, 51–60 (2005).
35. González, J. M., Kiene, R. P. & Moran, M. A. Transformation of sulfur compounds by an abundant lineage of marine bacteria in
the α-subclass of the class Proteobacteria. Appl. Environ. Microbiol. 65, 3810–3819 (1999).
36. Cui, Y. et al. The water depth-dependent co-occurrence patterns of marine bacteria in shallow and dynamic Southern Coast, Korea.
Sci. Rep. 9, 9176 (2019).
37. Huang, X. et al. Profiles of quorum sensing (QS)-related sequences in phycospheric microorganisms during a marine dinoflagellate
bloom, as determined by a metagenomic approach. Microbiol. Res. 217, 1–13 (2018).
38. Orsi, W. D. et al. Ecophysiology of uncultivated marine euryarchaea is linked to particulate organic matter. ISME J. 9, 1747–1763
(2015).
39. Salter, I. et al. Seasonal dynamics of active SAR11 ecotypes in the oligotrophic Northwest Mediterranean Sea. ISME J. 9, 347–360
(2015).
40. Berdjeb, L., Parada, A., Needham, D. M. & Fuhrman, J. A. Short-term dynamics and interactions of marine protist communities
during the spring–summer transition. ISME J. 12, 1907–1917 (2018).
41. Chow, C.-E.T., Kim, D. Y., Sachdeva, R., Caron, D. A. & Fuhrman, J. A. Top-down controls on bacterial community structure:
microbial network analysis of bacteria, T4-like viruses and protists. ISME J. 8, 816–829 (2014).
42. Louca, S., Parfrey, L. W. & Doebeli, M. Decoupling function and taxonomy in the globalocean microbiome. Science 353, 1272–1277
(2016).
43. Rivett, D. W. & Bell, T. Abundance determines the functional role of bacterial phylotypes in complex communities. Nat. Microbiol.
3, 767–772 (2018).
44. Amblard, C., Rachiq, S. & Bourdier, G. Photolithotrophy, photoheterotrophy and chemoheterotrophy during spring phytoplankton
development (Lake Pavin). Microb. Ecol. 24, 109–123 (1992).
45. Chun, S.-J. et al. Characterization of distinct cyanoHABs-related modules in microbial recurrent association network. Front.
Microbiol. 10, 1637 (2019).
46. He, T., Xie, D., Ni, J., Li, Z. & Li, Z. Nitrous oxide produced directly from ammonium, nitrate and nitrite during nitrification and
denitrification. J. Hazard. Mater. 388, 122114 (2020).
47. Leahy, J. G. & Colwell, R. R. Microbial degradation of hydrocarbons in the environment. Microbiol. Rev. 54, 305–315 (1990).
48. Porter, K. G. & Feig, Y. S. The use of DAPI for identifying and counting aquatic microflora 1. Limnol. Oceanogr. 25, 943–948 (1980).
49. Andrew, S. A quality control tool for high throughput sequence data. http://www.bioinformatics.babraham.ac.uk/projects/fastqc/.
(2010)
50. Magoč, T. & Salzberg, S. L. FLASH: fast length adjustment of short reads to improve genome assemblies. Bioinformatics 27,
2957–2963 (2011).
51. Altschul, S. F., Gish, W., Miller, W., Myers, E. W. & Lipman, D. J. Basic local alignment search tool. J. Mol. Biol. 215, 403–410 (1990).
52. Li, R. W. et al. Characterization of the rumen microbiota of pre-ruminant calves using metagenomic tools. Environ. Microbiol. 14,
129–139 (2012).
53. Schloss, P. D. et al. Introducing mothur: open-source, platform-independent, community-supported software for describing and
comparing microbial communities. Appl. Environ. Microbiol. 75, 7537–7541 (2009).
54. Oksanen, J. et al. Package ‘vegan’. Community ecology package. https://github.com/vegandevs/vegan (2019).
55. Paradis, E. et al. Package ‘ape’. Analyses of phylogenetics and evolution. http://ape-package.ird.fr/. (2019).
56. Wickham, H. et al. ggplot2: Create elegant data visualisations using the grammar of graphics. https://github.com/tidyverse/ggplo
t2 (2020).
57. Walker, I. R., Levesque, A. J., Cwynar, L. C. & Lotter, A. F. An expanded surface-water palaeotemperature inference model for use
with fossil midges from eastern Canada. J. Paleolimnol. 18, 165–178 (1997).
58. Clarke, K. R. Non-parametric multivariate analyses of changes in community structure. Aust. J. Ecol. 18, 117–143 (1993).
59. Ter Braak, C. J. Canonical correspondence analysis: a new eigenvector technique for multivariate direct gradient analysis. Ecology
67, 1167–1179 (1986).
60. Ter Braak, C.J.F. & Šmilauer, P. CANOCO Reference Manual and CanoDraw for Windows User’s Guide: Software for Canonical
Community Ordination, version 4.5. Ithaca, NY, USA: Microcomputer Power. (2002).
61. Xia, L. C. et al. Extended local similarity analysis (eLSA) of microbial community and other time series data with replicates. BMC
Syst. Biol. 5, S15 (2011).
Scientific Reports | (2021) 11:6983 | https://doi.org/10.1038/s41598-021-86590-8 10
Vol:.(1234567890)www.nature.com/scientificreports/
62. Xia, L. C., Ai, D., Cram, J., Fuhrman, J. A. & Sun, F. Efficient statistical significance approximation for local similarity analysis of
high-throughput time series data. Bioinformatics 29, 230–237 (2013).
63. Shannon, P. et al. Cytoscape: a software environment for integrated models of biomolecular interaction networks. Genome Res.
13, 2498–2504 (2003).
Acknowledgements
The stored genomic DNA samples and fixed phytoplankton samples were obtained from the Library of Marine
Samples of Korea Institute of Ocean Science & Technology (KIOST), South Korea. This research was sup-
ported by the National Research Foundation (NRF) funded by the Ministry of Science and ICT (MSIT) (NRF-
2020R1A2C2005970) and supported by the research project of Korea Institute of Ocean Science & Technology
(PE99914).
Author contributions
S.W.J. designed the research plan; J.K., H.M.J., J.S.P., H.-J.K., and S.W.J. performed the experiments and analysed
data; H.M.J., J.S.P., S.W.J., S.S.S., D.K., and T.-K.L. discussed the results; S.W.J., J.K., J.S.P., D.K., and T.-K.L. wrote
the paper.
Competing interests
The authors declare no competing interests.
Additional information
Supplementary Information The online version contains supplementary material available at https://doi.org/
10.1038/s41598-021-86590-8.
Correspondence and requests for materials should be addressed to S.W.J.
Reprints and permissions information is available at www.nature.com/reprints.
Publisher’s note Springer Nature remains neutral with regard to jurisdictional claims in published maps and
institutional affiliations.
Open Access This article is licensed under a Creative Commons Attribution 4.0 International
License, which permits use, sharing, adaptation, distribution and reproduction in any medium or
format, as long as you give appropriate credit to the original author(s) and the source, provide a link to the
Creative Commons licence, and indicate if changes were made. The images or other third party material in this
article are included in the article’s Creative Commons licence, unless indicated otherwise in a credit line to the
material. If material is not included in the article’s Creative Commons licence and your intended use is not
permitted by statutory regulation or exceeds the permitted use, you will need to obtain permission directly from
the copyright holder. To view a copy of this licence, visit http://creativecommons.org/licenses/by/4.0/.
© The Author(s) 2021
Scientific Reports | (2021) 11:6983 | https://doi.org/10.1038/s41598-021-86590-8 11
Vol.:(0123456789)You can also read