Economic and food security implications of the COVID-19 outbreak - WFP
←
→
Page content transcription
If your browser does not render page correctly, please read the page content below
Economic and food security implications
of the COVID-19 outbreak
An update focusing on the domestic fallout of local lockdowns

July 6, 2020
Authors:
Arif Husain, Director of Research Assessment and Monitoring Division (RAM)
Susanna Sandström, Head Economic and Market Unit RAM
Friederike Greb, Economist RAM
Peter Agamile, Economist Early Warning Unit

The evolving pandemic poses an evolving threat to food security
Global food security has been deteriorating in recent years due to conflicts, climate shocks, economic
downturns and desert locust. The COVID-19 pandemic could drive up the increase in acute hunger
over the past four years to more than 80 percent. The global economic outlook looks increasingly grim,
reflected in the IMF’s revision of its estimates to -4.9 percent global GDP contraction in 2020, 2.1
percentage points below the April forecast. Moreover, the geographic spread of COVID-19 cases has
continued to evolve – and with it the challenges that poor countries face (Figure 1). After China,
Europe and the US, Latin America has emerged as the epicenter of the pandemic. South Asia’s curve
of weekly new cases has a worryingly steep slope too. As of mid-June, two out of three new confirmed
cases are in low- and middle-income countries. While these countries are trying to cope with the
fallout of an increasingly severe global economic recession, they are also battling the disease at home.
This brief, therefore, shifts attention from the external to the domestic shock, complementing the
analysis of countries at risk of worsening food insecurity in earlier updates.
Figure 1: Weekly new confirmed cases of COVID-19 (in millions) across regions and country income groups

Sources: Our World in Data; and own calculations.

The food security costs of a domestic COVID-19 outbreak and the ensuing restrictions can dwarf those
of the global economic recession or hiccups in international food trade. While the picture is still

                                                           1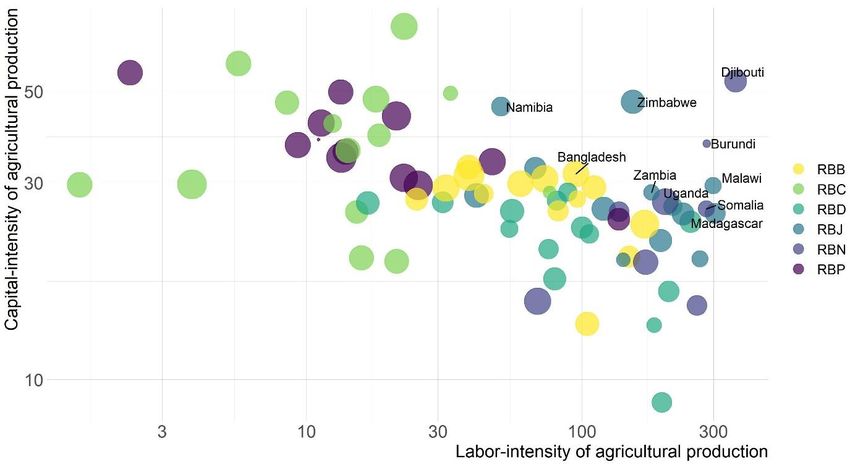
incomplete, early indications from IFPRI country studies suggest that this is the case, at least for now.1
For example, in Nigeria they find a 38 percent reduction in GDP during the country’s five-week
lockdown, a staggering contraction both in speed and magnitude.2 Behind such numbers are families
losing their income including many living hand-to-mouth, dependent on unprotected informal daily
wage workers, whose economic access to food is immediately jeopardized. The threat to economic
access to food comes hand in hand with one to physical access. Movement restrictions can put local
food supply chains at risk. Whereas food imports play an important role in poor countries, especially
for an adequate supply of staples, their relevance pales relative to that of the domestic food system.
The latter accounts for about 80 percent of what people eat in Africa and Asia, and more than 90
percent in Latin America.3

Concerns around the delicacy of lockdowns in developing countries have been voiced, but the
potential unintended consequences are only beginning to unravel. Benefits are far less obvious in
lower income contexts than in China, Europe or the United States; and trade-offs different. Isolation
measures help to ‘flatten the curve’ and delay infections, thus enabling health systems to cope and
preventing deaths, but what is the rationale for spreading out infections in time when health systems
are so weak – Mali and Mozambique each have one ventilator per million inhabitants4 – that they are
immediately overwhelmed and inaccessible to a large part of the population? An attempt to quantify
the economic value of social distancing policies puts it at 240 times larger in the United States than in
Nigeria or Pakistan;5 India’s nationwide lockdown, which ended after 2.5 months on 1 June amidst
new infections hitting record highs, has been exposed as a choice between lives and lives in the
absence of appropriate social protection measures;6 and Malawi’s National Planning Commission
recently found that even in case of a moderate lockdown, costs vastly outweigh benefits.7 The London
School of Health and Tropical Medicine calculates that when closing vaccination clinics in Africa more
than 80 children die due to the lack of routine immunization for each COVID-19 death averted.8
Similarly, the Johns Hopkins Bloomberg School of Public Health shows that, in the worst-case scenario,
1.2 million children under-five could die over the next six months because of COVID-19 specific
disruptions to health services and increased child wasting.9 Needless to say, the threat to food
security, which has been flagged repeatedly including by prominent observers such as Nobel laureates
Amartya Sen and Abhijit Banerjee,10 is one of the most worrying repercussions of lockdowns in low
and middle-income countries.

1 IFPRI blog post COVID-19 lockdowns are imposing substantial economic costs on countries in Africa
2 IFPRI presentation Nigeria: Impacts of COVID-19 on Production, Poverty & Food Systems
3 Barrett et al, 2019, Structural transformation and economic development: insights from the agri-food value chain

revolution. Mimeo, Cornell University
4 The Economist, Africa is woefully ill-equipped to cope with covid-19
5 Barnett-Howell and Mushfiq Mobarak, Should Low-Income Countries Impose the Same Social Distancing Guidelines as

Europe and North America to Halt the Spread of COVID-19?, Yale Y-RISE Policy Brief
6 Ray, Subramanian and Vandewalle, India’s lockdown, VOX CEPR Policy Portal
7 National Planning Commission, Medium and long-term impacts of a moderate lockdown (social restrictions) in response

to the COVID-19 pandemic in Malawi: A rapid cost-benefit analysis
8 London School of Hygiene & Tropical Medicine, Benefit-risk analysis of health benefits of routine childhood immunisation

against the excess risk of SARS-CoV-2 infections during the Covid-19 pandemic in Africa
9 Roberton et al, 2020, Early estimates of the indirect effects of the COVID-19 pandemic on maternal and child mortality in

low-income and middle-income countries: a modelling study, The Lancet Global Health, Volume 8, Issue 7
10 The Indian Express, ‘Huge numbers may be pushed into dire poverty or starvation…we need to secure them’; Financial

Times, India: the millions of working poor exposed by pandemic

                                                             2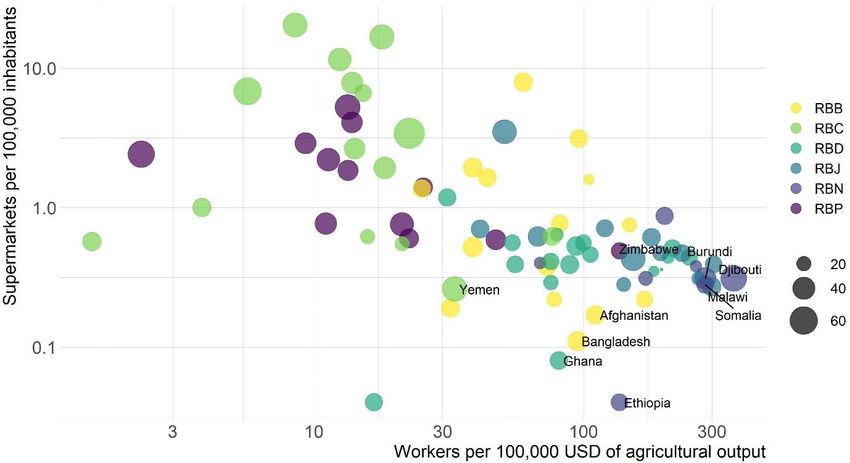
Framing food security risk from local lockdowns
To analyze the risk from COVID-19 induced domestic shocks to food security, we will separately
consider the demand side – income losses reducing economic access to food – and the supply side –
disruptions of supply chains hampering physical access to and availability of food. We understand risk
as a combination of hazard, exposure and vulnerability; and vulnerability to comprise both the
susceptibility to suffer harm and the lack of capacity to cope with it.11 The hazard is a perilous event
that occurs and potentially impacts (in this case) a country's economy and food security, whereas
exposure describes the extent to which a country is affected through various transmission channels.
Susceptibility refers to the predisposition to suffer from the hazard once exposed and coping capacity
to the resources available to weather the storm. While exposure and vulnerability can go together,
this is not necessarily the case. Recalling the example of countries’ exposure to a global economic
recession through dependence on primary commodity exports, the case of Mexico exemplifies this.
While exposed through oil exports, the country is not vulnerable. It has hedged its oil price,
guaranteeing not to sell below USD 49 per barrel; and is now cashing in USD 6 billion following the
steep plunge in oil prices.12

Figure 2 gives an overview of the framework we use to think about food security risk from local
lockdowns, highlighting aspects alluded to in the introduction and detailed in this brief. The structure
also serves to develop a country risk classification based on indicators pertaining to its different
elements, which we present at the end. We combine the domestic risk classification with the external
risk classification developed in earlier updates, pinpointing countries that are at risk both due to a
domestic shock and due to spillovers from the global economy.
Figure 2: Impact of lockdowns on food security

11 While these elements are typically considered in risk frameworks, some hold coping capacity as distinct from
vulnerability (e.g. AEW Risk Assessment v.1.4) while others take vulnerability to comprise exposure, susceptibility and lack
of resilience (e.g. Birkmann et al, 2013, Framing vulnerability, risk and societal responses: the MOVE framework).
12 Bloomberg, A $6 Billion Windfall: Mexico's Massive Oil Hedge Is Paying Off

                                                              3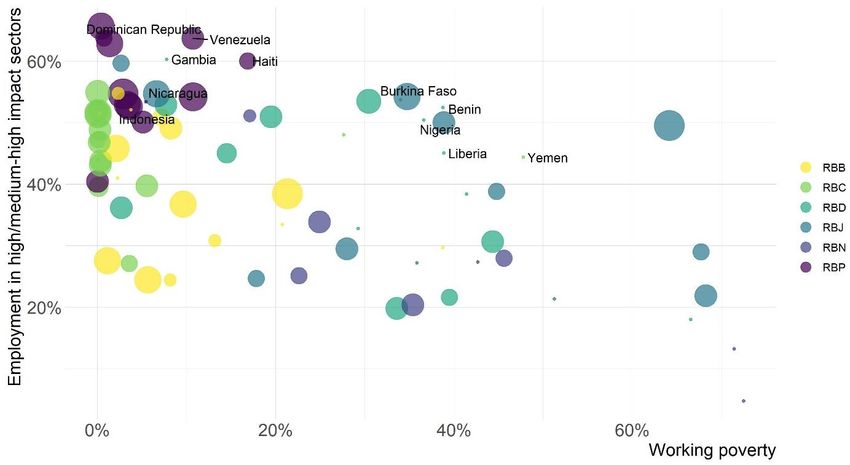
Whereas it is hard to judge whether the supply- or the demand-side will have bigger repercussions on
food security, for now income loss and the reduction in access to food has come out as the primary
risk factor. It is inherent in the complexity of food systems that it is difficult to gauge the scale of
disruptions that is in the cards, especially in the longer term. Of course, this also hinges on the duration
and further evolution of the pandemic. However, FAO states that ‘disruptions in the food supply chain
are minimal so far’.13 Meanwhile, based on ILO estimates of reductions in hours worked and the
ensuing lost incomes, WFP estimates that in countries most vulnerable to food insecurity, 121 million
people will be pushed into food insecurity by the end of 2020.14

The hazard: government response varies widely – and with it the domestic shock
A first step in thinking about food security risks triggered by COVID-19 outbreaks in poor countries is
considering the hazard. For the external shock the phenomenon causing disruption is the same across
countries – a global recession and concerns around food imports. This is not the case for the domestic
shock. Here, the hazard has a health (the local outbreak) and a policy (the containment measures)
dimension, both of which vary by country. Even when confronted with outbreaks of similar size,
government responses can be very different. Cognizant of their weaker health systems, El Salvador,
Guatemala and Venezuela responded with complete lockdowns within less than five days of the first
confirmed case of COVID-19 in the country, much faster than their richer Latin American neighbors.15
We will largely ignore the health dimension – the difference in magnitude between 6 million
confirmed cases of COVID-19 in low- and middle-income countries and nearly 90 percent of their
population, that is, nearly 6 billion people, required to stay at home for some time, makes policy
measures imposed to contain the spread of the virus the primary source of economic havoc; and puts
countries with more fragile health systems and possibly earlier or stricter responses at particular risk.

In our risk classification, we use the Oxford Stringency Index to quantify the rigidity of government
response to the Coronavirus pandemic. As IFPRI simulations suggest that GDP losses accumulate
proportional to the duration of the lockdown, increasing from USD 18 billion for five weeks to USD 36
billion for ten weeks of lockdown for the case of Nigeria,16 we consider not only the current value of
the stringency index, but its level over time. Figure 3 illustrates how much policy measures to distance
people have differed across regions and across countries within a region according to this indicator.
Figure 3: Oxford Stringency Index across Regional Bureaux (left) and countries (right) for the example of East Africa

Source: University of Oxford. Notes: WFP’s Regional Bureaux are RBB in Bangkok (Asia and the Pacific); RBC in Cairo (Middle
East, Northern Africa, Eastern Europe and Central Asia); RBD in Dakar (West and Central Africa); RBJ in Johannesburg
(Southern Africa); RBN in Nairobi (East Africa); and RBP in Panama (Latin America and the Caribbean).

13 FAO key messages on Novel Coronavirus (COVID-19)
14 WFP Global Response to COVID-19: June 2020
15 Economist Intelligence Unit, A pandemic-induced recession bears down on Latin America
16 IFPRI presentation, Nigeria: Impacts of COVID-19 on production, poverty and food systems

                                                              4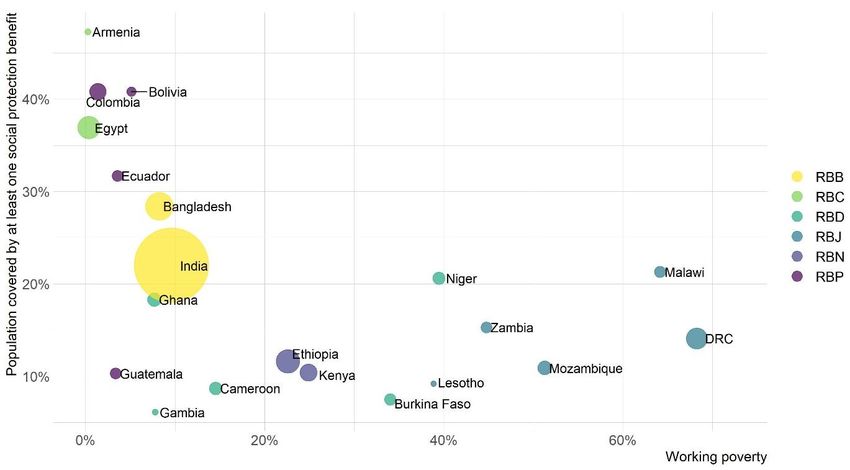
While a useful approximation, the Oxford Stringency Index focuses on policy prescriptions.
Meanwhile, their consequences for the economy depend on whether people and businesses follow
them – which cannot be taken for granted. The Economist muses that ‘it is hard to think of any policy
ever having been imposed so widely with such little preparation or debate’, excusing lockdowns as a
‘desperate measure for a desperate time’.17 They clearly have not been designed with the world’s
poor in mind; and are often impossible for them to comply with. Isolation and other key
recommendations to contain the virus – staying informed about local disease incidence and latest
advice on how to protect yourself; washing hands regularly with soap and water – imply requirements
on people’s homes such as piped water or a private water source. Out of the poorest 40 percent of
households only 6 percent meet these globally, and virtually none do in sub-Saharan Africa.18
Considering not only the home environment but also a permanent source of income or savings as a
necessity, for the example of Mozambique only 2 percent of the rural and 17 percent of the urban
population are fully ready for a lockdown.19

Moreover, differences in the details of policies that are relevant for their food security fallout can
escape the index. For example, in sub-Saharan Africa informal food trade is considered an essential
service in most countries and left operational during lockdowns, albeit in a substantially modified
environment (e.g. with alternative trading days for alternative products or non-food traders removed).
However, this is not the case everywhere. In Burkina Faso as well as some cities in Kenya and Nigeria,
informal markets have been completely closed; and compliance at times imposed violently by
destroying stalls.20 Given the importance of informal trade in sub-Saharan African food systems –
urban poor access up to 70 percent of their food from informal retailers by some estimates – such
variation in policy details can be decisive with food security in mind. Meanwhile, in the framework of
the Oxford Stringency Index these differences disappear.

Demand-side exposure: Lockdowns will decimate income of millions of workers
in poor countries
By the end of May 2020, the International Labour Organization (ILO) estimated that 94 percent of the
world’s workforce lived in a country with some form of workplace closures. The lockdown measures
and related closure of most workplaces to contain the spread of COVID-19 severely curtail people’s
ability to work. Worryingly, the impact on employment appears to be much larger than initially
expected. ILO recently drastically revised its projected decline in aggregate global working hours for
the second quarter of 2020, raising it from their first estimate of 6.7 percent to now 14 percent. This
is equivalent to a staggering 400 million lost full-time jobs. With more than 18 percent, the Americas
see the largest reduction.21

Not everybody’s work has been exposed to these disruptions to the same extent. ILO assessed the
sectoral impact of the crisis based on real-time economic and financial data, identifying several key
sectors suffering from a drastic fall in output.22 These include, for example, wholesale and retail trade,
manufacturing, and accommodation and food services. Some of these sectors are labor-intensive,
employing millions of low-paid, low-skilled workers, whose livelihoods lockdown measures put at risk.

17 The Economist, Lifting lockdowns: the when, why and how
18 Brown, Ravallion and van de Walle, 2020, The World’s Poor Cannot Protect Themselves from the New Coronavirus, NBER
Working Paper No. 27200
19 UNU-WIDER blog post Is Mozambique prepared for a lockdown during the COVID-19 pandemic?
20 IFPRI virtual event on COVID-19: Emerging problems and potential country-level responses
21 ILO, ILO Monitor: COVID-19 and the world of work. Fifth edition
22 ILO, ILO Monitor: COVID-19 and the world of work. Second edition

                                                         5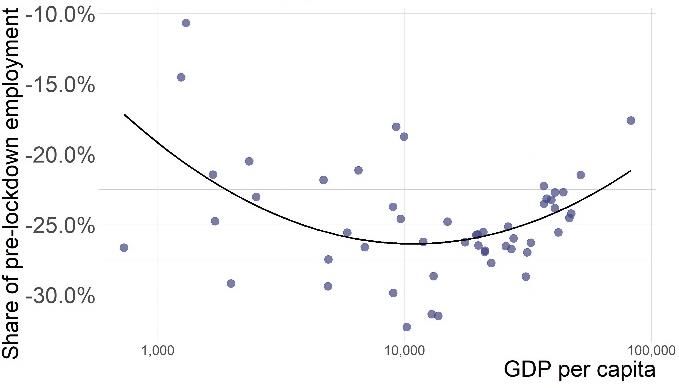
Service and sales workers make up 30 percent of employment in low-income countries.23 Linked to
sector and occupation among other factors, the ability to work from home can shield workers from
the crisis. However, while this might be possible for a large part of the employed in rich countries, the
share of people who can work from home is significantly lower in poorer countries ( Figure 4, left).
Figure 4: Impact of local lockdowns on employment: Share of those who can work from home (left) and the reduction of
employment following a hard lockdown (right)

Sources: Online simulator accompanying Gottlieb et al, 2020, Lockdown Accounting; and own calculations. Notes: GDP is in
PPP and the scale logarithmic. Regarding the right-hand side, a hard lockdown is characterized by all but a limited number of
essential sectors closed down. It is modelled on policies in Italy and New York State. Percentages refer to a year of
implementation of the policy. The impact of shorter lockdowns is proportional (e.g. a 24 percent drop in effective employment
resulting from a year-long policy means that a month-long policy corresponds to a 2 percent drop).

Analysis of the effect of lockdown policies on employment across countries shows that middle-income
countries tend to be hardest hit ( Figure 4, right). Sectors deemed essential are often exempt from
certain measures and less heavily affected. The agricultural sector is one of these, which can
somewhat cushion the repercussions for low-income countries, typically characterized by a large
share of employment in agriculture. While high income countries generally benefit from a higher
ability to work from home, it is middle-income countries that are likely hit hardest. Non-essential
sectors often play an important role in their economies while the share of those able to work from
home is low.24

For the risk classification at the end of the paper, we use information on the sectoral structure of a
country’s economy to indicate exposure to income loss following a local lockdown. We take the share
of employment in sectors with impact classified by ILO as ‘high’ or ‘medium-high’ to quantify
differences across countries in exposure on the demand side.

Demand-side vulnerability: A toxic combination of informality, working poverty
and lack of social protection leaves many highly vulnerable
Being unable to work leaves some people worse off than others. Countries with a high share of
informally employed, high working poverty and underperforming social protection systems leave
many people vulnerable. As captured by a voice in a recent ILO brief, being unable to work can mean
the choice between dying “from hunger or from the virus”.25 With over two billion people or 62
percent of all those working worldwide employed in the informal economy,26 millions of people face
a growing risk of hunger. This situation is particularly worrisome in low- and middle-income countries

23 Gottlieb et al, 2020, Working from home across countries, Covid Economics, Issue 8
24 Gottlieb et al, 2020, Lockdown accounting, Covid Economics, Issue 31
25 ILO brief, COVID-19 crisis and the informal economy
26
     ILO brief, COVID-19 crisis and the informal economy

                                                             6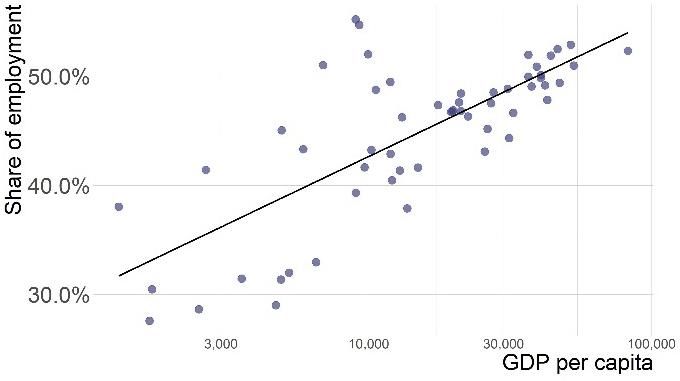
where informal employment represents 90 and 67 percent respectively of total employment. With
most of the economic stimulus plans in low-income countries directed towards the formal economy,27
it is likely that workers in the informal economy will be left in an even more precarious position after
the pandemic.

In many low- and middle-income countries, a combination of working poverty and low coverage of
the population by any form of social protection exacerbates the negative welfare impact of lockdowns.
Often hinging on a daily income, poor workers without social protection are left with little to cope
when losing their earnings. Using up savings or selling productive assets to assure food security can
easily set them on a path of sustained poverty. In Burkina Faso, DRC, Lesotho, Mozambique and
Zambia, more than 30 percent of workers are poor, while less than 20 percent of the population
benefit from any social protection scheme (Figure 5). Even worse, being in the lowest income quintile
in sub-Saharan Africa leaves people with no more than a 4 percent chance of receiving assistance from
the government.28
Figure 5: Vulnerability to income loss

Source: ILOSTAT. Notes: Bubble size indicates population. Colors are according to WFP’s Regional Bureaux (see note below
Figure 3).

Albeit unclear if they reach the poorest households, governments have put in place additional
schemes to soften the impact of the pandemic. 124 countries have provided or plan to provide COVID-
19 specific cash transfers. While these measures cover 15 percent of the world’s population, gaps in
coverage across different regions are substantial. In Africa, a region with substantial needs, the
coverage is only a paltry 2 percent.29 The cash transfers have been noted to be generous in size but in
many instances, they are destined to last for a short time, on average for just 2.9 months or until the
end of the pandemic. In countries with very low pre-existing coverage of social protection, it is likely
that these COVID-19 specific cash transfers may not reach all the vulnerable populations. Perhaps

27 ILO brief, The impact of the COVID-19 on the informal economy in Africa and the related policy responses
28 The Economist, Lifting lockdowns: the when, why and how
29 Ugo Gentilini et al, Social Protection and Jobs Responses to COVID-19: A Real-Time Review of Country Measures,“Living

paper” version 10

                                                            7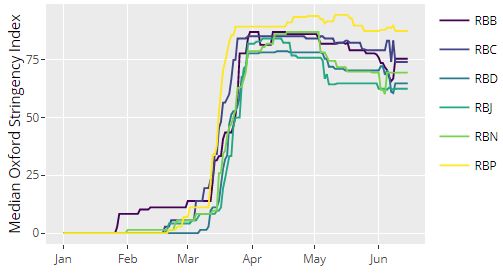
more worrying is the fact that some of the fragile countries suffering from conflict such as Burundi,
Eritrea or Yemen do not have any COVID-19 specific social protection measures.
For a comparison across countries, we use the working poverty headcount in combination with the
Oxford Economic Support Index to measure vulnerability to lose access to food upon job loss. Data on
informality and social protection coverage for countries relevant to this brief is scarce and, hence, not
suitable to pinpoint countries at risk. However, both indicators are correlated with working poverty
(with a coefficient of more than 0.8 when looking at correlation between ranks, which is relevant for
our risk classification).
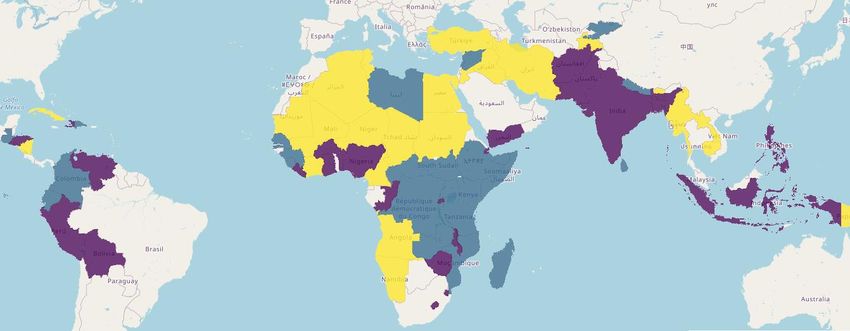
Figure 6 brings together both exposure and vulnerability measures related to food security risk from
income loss. Several countries stand out for having a relatively large share of employment in highly
impacted sectors coinciding with a high prevalence of working poverty and low economic support to
cushion income losses due to COVID-19. These include Benin, Burkina Faso, Dominican Republic, the
Gambia, Haiti, Liberia, Indonesia, Nicaragua, Nigeria, Venezuela and Yemen.
Figure 6: Exposure and vulnerability to income loss
Sources: ILOSTAT; and own calculations. Notes: Bubble size indicates the government’s economic support with bigger bubbles
associated with more wider support measures. Colors are according to WFP’s Regional Bureaux (see note below Figure 3).
Countries named are those with a particularly worrisome mix of a high employment share in heavily hit sectors, high working
poverty and limited COVID-19 related economic support measures.
A bleak picture emerges from early surveys
There is emerging evidence from around the world showing how the pandemic is reducing people’s
income and thus increasing incidence of food insecurity. Results from WFP surveys in June show a
notable increase in households using crisis or emergency coping strategies. Consistent with the global
spread of COVID-19, these negative coping strategies are increasingly used by households across all
regions where WFP operates. Among the surveyed countries, the situation appears to be particularly
worrisome in Cameroon, Chad, Colombia, Democratic Republic of Congo, Honduras, Malawi, Mali and
Niger, where over 50 percent of households report resorting to coping strategies such as spending
savings, borrowing money, selling productive assets or means of transport, consuming seed stocks,
8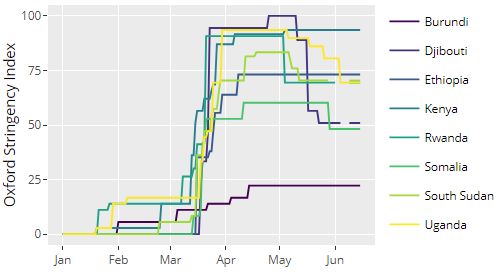
reducing non-food expenditures or relying on less expensive food, reducing the number of meals or
limiting portion size.30

A web survey in Lebanon carried out by WFP in May, covering Lebanese population as well as Syrian
and Palestinian refugees, suggests that the COVID-19 outbreak and related containment measures
have pushed around half of the Syrians into unemployment and nearly one out of every three
Lebanese. One in five respondents saw their salary being reduced. To bridge income gaps, two-thirds
have resorted to one or more livelihood-based coping strategies in the past month, above all spending
less on food. In combination with soaring food prices, accessing food has become a major source of
concern.31 Fifty percent of Lebanese, 63 percent of Palestinians and 75 percent of Syrians felt worried
about not having enough food to eat over the past month. Forty-four percent of the Syrian refugees
reported eating only one meal during the previous day. One in five Lebanese and Palestinians
respondents reported the same.

In Latin America and the Caribbean, a region which has recently become the new epicenter of the
pandemic, WFP surveys covering nine countries reveal a particularly drastic deterioration in people’s
livelihood with 69 percent of the respondents reporting a decrease in their incomes as a result of
COVID-19. Seven out of ten respondents were worried about not having enough food to eat in the
preceding 30 days, more prevalently so in rural than in urban areas. Urban households possibly had
the chance to stockpile food before the lockdowns came into force or their economies were severely
disrupted. 62 percent of the respondents used crisis or emergency coping strategies which severely
affect food consumption.

Surveys by other agencies show a similar trend. BRAC conducted a countrywide survey in late March
and early April in Bangladesh, where 93 percent of the respondents saw a decline in their income due
to the pandemic. A more worrying finding is perhaps the drastic increase in the poverty headcount.
The population below the lower national poverty line rose from previously 24 percent to 84 percent
after the pandemic set in. With 14 percent of the people interviewed indicating that they do not have
food at home, the decline in people’s income has a clear negative impact on their food security.32
Meanwhile, Population Council surveys in India found that in two states, Uttar Pradesh and Bihar, 54
and 61 percent of the population, respectively, had resources that may last for less than one month
in early April.33

Early surveys in some African countries paint the same picture of declining incomes and rising food
insecurity. In a phone survey in Senegal, 85 percent of the people reported income loss with about a
third of the population consuming less than their usual food intake as a result of the pandemic.34
Meanwhile in Kenya, 68 percent of people in Nairobi’s informal settlements reported skipping a meal
as a result of lack of income due to the pandemic.35

Unless well-guarded food supply chains can take a hit
The surge in unemployment following the pandemic and the resulting blow to people’s purchasing
power will also put food supply chains under pressure, particularly for higher value foods. However,
the threat to supply chains from local lockdowns goes far beyond that. Even if the pandemic has yet

30 WFP Hunger - COVID Snapshots
31 WFP, Assessing the Impact of the Economic and COVID-19 Crises in Lebanon
32 Prothom Alo, 14pc people have no food at home: BRAC survey
33 Population Council, Critical needs during Covid-19 lockdown: Job, Food, Cash, Medicines – Who Needs What?
34 Center for Global Development, Five Findings from a New Phone Survey in Senegal
35 Population Council, Kenya: COVID-19 Knowledge, Attitudes, Practices & Needs

                                                           9
to cause major food supply chain disruption, its effects don’t spare any part of the system and are felt
both immediately and in the longer term. Food supply chains rely on physical movement – workers on
their way to the farm or processing plants, traders picking up produce and bringing it to a warehouse,
buyers and sellers going to the market. Lockdown-style policies paralyze these movements. Examples
for immediate effects of containment measures on food supply chains include police confiscating and
destroying three tons of fresh fruit and vegetable in Zimbabwe in a bid to enforce the country’s
lockdown;36 overnight transportation of perishable foods – necessary as refrigeration is lacking – made
impossible by curfews in Mali;37 or informal cross border trade coming to a standstill in Uganda38,
where it accounts e.g. for 30 percent of all beans exports39, and elsewhere, sparking protest in Ben
Gardan on the border between Tunisia and Libya.40 Meanwhile, looking at longer term implications,
with few flights operating and shipment costs multiplying the pandemic delayed delivery of pesticides
and equipment to fight the locust outbreak in East Africa, setting back efforts to contain the pest.41
The World Bank further foresees agricultural production in Africa to contract between 2.6 and 7
percent as a result of the COVID-19 crisis.42
The effects of local Coronavirus outbreaks on food supply chains go beyond disruption of physical
movement. Disruption brings uncertainty for actors along food supply chains. It becomes harder to
predict how prices might evolve, both in input and output markets, with repercussions for investment
decisions. An IFPRI study for dairy value chains in Ethiopia found feed prices temporarily up by 40
percent; and laborers’ wages rising from 150 to 250 Birr per day.43 Concerns have also been voiced
around food quality and safety, which might suffer as processors find ways of handling fractured
supply lines and lower margins; and a prioritization away from nutritious foods to those with higher
shelf life.44 Unpredictable consumer behavior compounds uncertainty. Returning to the example of
Ethiopian dairy value chains, a perceived risk to contract COVID-19 through the consumption of
animal-sourced products brought down dairy consumption, leaving dairy shop owners with a sharp
reduction in demand, triggering increased butter production and making it harder for farmers to sell
their milk.45 While temporary, such hiccups along supply chains can have farther reaching
consequences. They might result in farmers without money to buy critical inputs for the next season;
or put small retailers, who take the wrong decisions on what products to fill their shelves with, out of
business.
Supply-side exposure: Dependence on labor is key
The pandemic’s impact on food supply chains differs between countries. Mobility restrictions deprive
supply chains of a key ingredient, workers; and of everything else that needs human help to move. As
labor use in the food and agriculture sector varies by country, exposure to COVID-19 containment
measures also does. The share of workers employed in food-related sectors is typically higher in low-
income than in high income countries; the World Bank puts the difference at up to five times. As an
example, the United States needs 10 percent of its workforce to meet domestic food demand,
36 AP NEWS, Virus choking off supply of what Africa needs most: Food
37 FAO webinar Estimating the impact of COVID-19 on rural poverty
38 NewVision, COVID-19 brings informal cross-border trade to a standstill
39 Bank of Uganda, Statistics, Composition of Exports
40 Carnegie Middle East Center, Living Off the Books
41 Bloomberg, Coronavirus Slowing Desert Locust Response Amid New Swarms; World Bank blog post Coronavirus and
commodity markets: Lessons from history
42 The World Bank, Africa's Pulse, No. 21, Spring 2020: An Analysis of Issues Shaping Africa’s Economic Future
43 IFPRI virtual seminar on COVID-19 and its impact on Ethiopia’s agri-food system, food security, and nutrition
44 GAIN, The COVID-19 Crisis and Food Systems: probable impacts and potential mitigation and adaptation responses
45 IFPRI blog post COVID-19 is shifting consumption and disrupting dairy value chains in Ethiopia
10whereas 60 percent of workers are engaged in food production in Ethiopia.46 While labor-intensive
food supply chains are arguably most exposed to the pandemic, heavy dependence on capital – in
particular intermediate inputs (such as fertilizer, pesticides, seeds or feed in case of agricultural
production) or fixed capital (such as replacement parts for machines) – also creates risks. With
transportation disrupted, missing inputs could bring production to a halt and entire supply chains to
stumble. As agricultural production is not possible without some combination of capital and labor, all
countries have some degree of exposure.
We draw on a country taxonomy developed by FAO to gauge differences in the degree of exposure of
countries’ agricultural production to the pandemic.47 Whereas FAO's classification takes a broader
stance and captures also the pathways through which the global economic recession impacts the food
and agricultural sector, we focus on the part relevant in the context of local lockdowns. We use a
combination of the share of intermediate inputs and fixed capital in gross agricultural output (as a
measure of capital-intensity); and the number of workers needed to produce a unit of gross
agricultural output (as a measure of labor-intensity) to quantify exposure of food production to
COVID-19. Both are shown in Figure 7 and used in the risk classification below. The countries that
stand out for their factor intensity of production are primarily African, including Burundi, Djibouti,
Madagascar, Malawi, Namibia, Somalia, Uganda, Zambia and Zimbabwe.
Figure 7: Exposure of agricultural production
Sources: FAO; and own calculations. Notes: Capital-intensity is measured as the share of intermediate inputs and fixed capital
in gross agricultural output; labor-intensity as the number of agricultural workers per USD 100,000 gross output. Bubble size
indicates the strictness of government response according to the Oxford Stringency Index. Scales are logarithmic. Colors are
according to WFP’s Regional Bureaux (see note below Figure 3). Countries named are particularly exposed due to a mix of
both high labor- and capital-intensity.
46 World Bank blog post The containment divide: COVID-19 lockdowns and basic needs in developing countries
47 Schmidhuber, Pound and Qiao, COVID-19: Channels of transmission to food and agriculture, FAO
11Supply-side vulnerability: Modern food supply chains appear best placed to cope
with COVID-19
As the pandemic’s fallout can be felt along the entire supply chain, it is crucial to consider not only the
farm but also the post-farm sector when categorizing country-level risk. Traders, truckers and retailers
have been called ‘the life blood, the circulatory system’ of African food value chains. With only 20
percent of food produced for self-consumption, the bulk of what Africans eat is purchased after being
handled and marketed by diverse actors midstream and downstream food supply chains. This can
involve physically moving long distances. For example, maize in Nigeria often travels 500 to 1000 km
from farm to fork with urban wholesalers and rural brokers managing the flow of grain, flour or
feedstuffs from around 8 million maize producers to 160 million consumers.48
Food supply chains not only differ in their length, but also in other aspects that determine to what
extent they are at risk to the Coronavirus pandemic. Their vulnerability has been linked to stage of
development.49 We can describe food supply chains as traditional, transitional or modern. While
traditional food supply chains are short and local, depend on home microenterprises and work largely
without standards, transitional food supply chains are longer and run from rural to urban areas, are
characterized by small-and-medium-sized enterprises (SMEs) and wet markets and feature public
standards. Neither type is organized through contracts and both are labor-intensive. Modern food
supply chains, on the contrary, are capital-intensive and see emerging contractual arrangements. They
are long, not only running from rural to urban areas but across countries. Supermarkets and large
processors are the main enterprises type.50
The post-farm segment of modern supply chains will likely face least COVID-19 related challenges.51 It
is much easier for supermarkets to manage the numbers of customers in the store and enforce social
distancing measures than it is to manage the dense masses of vendors and customers in public
wholesale markets. Contracts and standards further allow supermarket chains to oversee hygiene
practices and food safety along their supply chains. Conversely, it is likely to be hardest for informal
SMEs of transitional supply chains to cope with COVID-19.52 If food processing enterprises, meal
vendors or retailers in wet markets – SMEs are often clustered together, with high densities of workers
in small space dealing with clients gathering in crowds. Corroborating this hypothesis, Latin America’s
traditional markets have been stigmatized as hubs of infection after 79 percent of vendors in a fruit
market in Lima, Peru, tested positive for the virus.53 Similarly, the recent new outbreak in Beijing has
been traced to have its origin in Xinfadi, an enormous wholesale market.54
This makes some regions’ food supply chains more vulnerable to the pandemic than others. IFPRI
approximates that about 70 percent of African and South Asian food supply chains are in a transitional
stage whereas 20 percent are modern; while for Latin America and Southeast Asia the respective
shares are 50 percent and 45 percent.55
48
AGRA, Africa Agriculture Status Report 2019
49
IFPRI blog post How COVID-19 may disrupt food supply chains in developing countries
50 Barrett et al, 2019, Structural transformation and economic development: insights from the agri-food value chain
revolution. Mimeo, Cornell University; IFPRI blog post How COVID-19 may disrupt food supply chains in developing
countries
51 IFPRI blog post How COVID-19 may disrupt food supply chains in developing countries
52 IFPRI presentation on Inclusive Food Systems: Before and After COVID-19
53 The Guardian, 'Hubs of infection': how Covid-19 spread through Latin America's markets
54 ALJAZEERA, 'Back to where we were': Beijing fears second wave of coronavirus
55
IFPRI blog post How COVID-19 may disrupt food supply chains in developing countries
12Figure 8: Exposure and vulnerability to food supply chain disruptions
Sources: FAO; Food Systems Dashboard; and own calculations. Notes: Bubble size indicates capital-intensity of production
(measured as the percentage of intermediate inputs and fixed capital in gross agricultural output). The number of agricultural
workers per USD 100,000 gross output indicates labor-intensity of production. Scales are logarithmic. Colors are according to
WFP’s Regional Bureaux (see note below Figure 3). Countries named are characterized by a particularly worrying mix of high
factor-intensity of agricultural production and low supermarket penetration.
It is challenging to find data at country level to gauge the stage of food supply chains. The Food
Systems Dashboard56 develops a typology to characterize countries’ food systems as belonging to one
of five different groups ranging from ‘rural and traditional’ to ‘industrialized and consolidated’. We
borrow from the food system typology to classify food supply chains and use the number of
supermarkets relative to population – closely linked to the way supply chains are organized and how
people shop – to approximate the stage of food supply chains and, hence, vulnerability to the
Coronavirus pandemic.
Figure 8 brings together exposure and vulnerability indicators for food supply chains, visualizing
supermarket penetration in combination with labor- and capital-intensity of agricultural production.
It highlights Afghanistan, Bangladesh, Burundi, Djibouti, Ethiopia, Ghana, Malawi, Somalia, Yemen and
Zimbabwe as countries of particular concern because of a combination of factor intensive agricultural
production and low prevalence of modern food supply chains.
Bringing the indicators together to categorize food security risk
As already alluded to, we develop a food security risk classification based on indicators introduced in
the previous sections. These capture hazard, exposure and vulnerability to local COVID-19 outbreaks
and the ensuing containment measures considering both the supply- and the demand-side. Namely,
the indicators are
- the Oxford Stringency Index (hazard);
- the share of intermediate inputs and fixed capital in gross agricultural output (supply-side
exposure);
56
Fanzo et al, 2020, The Food Systems Dashboard is a new tool to inform better food policy, Nature Food
13- the number of agricultural workers per 100,000 USD of gross agricultural output (supply-side
exposure);
- the number of supermarkets per 100,000 inhabitants (supply-side vulnerability);
- the share of employment in sectors categorized by ILO as suffering a high or medium-high
impact from the Coronavirus crisis (demand-side exposure);
- the prevalence of working poverty (above the age of 15) (demand-side vulnerability);
- the Oxford Economic Support Index (demand-side vulnerability).
We have chosen indicators that are widely available across countries. Still, data for all six indicators is
only available for 75 of the 83 countries examined. The remaining eight – Armenia, DPR Korea,
Gambia, Guinea-Bissau, Palestine, São Tomé and Príncipe, Timor-Leste, Togo – have been excluded
with their risk, thus, not classified. Issues with data availability are also the reason why not all factors
shown in Figure 2 enter the risk classification. Namely, the ability to work from home and informality
are missing.
Box 1: Details of the risk classification
. . on the indicators
The Oxford Stringency Index accounts for school, workplace and public transport closures,
cancellation of public events, stay at home orders and restrictions on domestic or international
travel among others; the measures’ strictness; and whether they only hold for a targeted area or
economy wide. We compute its mean from 1 January 2020 until 15 June 2020. Meanwhile, the
Oxford Economic Support Index quantifies income support and debt or contract relief for
households. It is based on records if and to what extent governments replace lost salary; and if
governments freeze financial obligations such as stop loan repayments, prevent water or other
services from running or ban evictions. We use the index’ value as of 15 June.
. . on data sources
Data sources are the University of Oxford for the Stringency and the Economic Support Index; FAO
for the supply-side exposure indicators; the Food Systems Dashboard for supermarket
penetration; and ILO for the remaining two demand-side indicators.
. . on the computation of the risk classes
In a first step, we rank countries for each of the seven indicators according to increasing risk. The
country with lowest risk gets the lowest rank. Increasing risk coincides with increasing values for
some indicators (e.g. the number of agricultural workers per output) and decreasing values for
others (e.g. the number of supermarkets relative to inhabitants). We then assign a score to each
country by summing up the ranks. As there are two indicators for both supply-side exposure and
demand-side vulnerability, each of these only enters the sum with a factor of 0.5. For example, if
a country ranks 50th for the Oxford Stringency Index, comes in 10th for capital- and 60th for labor-
intensity, has the 55th-highest supermarket penetration, the 15th lowest share of employment in
sectors at (medium)-high risk and ranks 40th and 45th in terms of the working poverty headcount
and economic support, respectively, its final score is 50 + 0.5×10 + 0.5×60 + 55 + 15+ 0.5×40 +
0.5×45 = 197.5. Finally, we take the terciles of the scores’ distribution to arrive at three risk groups.
Table 1 and Figure 9 show the resulting risk classification across countries. Latin America and the
Caribbean emerges as the region with the highest risk on average, closely followed by East and
14Southern Africa. Variation across countries is most pronounced in Asia and the Pacific, followed by
West and Central Africa.
Figure 9: Food security at risk to food supply chain disruptions and income loss
Notes: Colors indicate countries’ food security risk due to local COVID-19 outbreaks. Purple indicates highest risk; blue medium
risk; and yellow lowest risk.
In conclusion, we combine our classification of risk from domestic lockdowns with that of risk from
the global economic recession developed in previous economic updates. Table 1 shows the two
indicators side by side, adding them up to quantify overall risk in the right-most column. Highlights in
the first column flag countries that fall into the highest risk category for both domestic and external
risk (i.e. have overall risk equal to six) in red; and those that fall into the highest category for one and
the second highest for the other (i.e. have overall equal to five) in light red.
Conclusions and recommendations
In this brief, we have examined the repercussions of COVID-19 induced domestic shocks on food
security and developed a framework which allows us to analyze risks both on the supply and the
demand side. Combining this with our earlier analysis of the ramifications of the global economic
recession, gives us a risk classification of countries which takes into account the risk from both
domestic and external shocks.
While on the supply side, East Africa stands out as at especially high risk, followed by Southern Africa
and Asia, we find that Latin America and the Caribbean as well as West and Central Africa are
particularly at risk on the income side. Combining the domestic and external index highlights the food
security risk that several Sub-Saharan and Latin-American countries face.
Considering the risk pathways, it is clear that the agriculture sector must be a national priority to
ensure disruption free production and supply of food commodities. Any disruption to the agricultural
labor or inputs will be detrimental for the food supplies for the next season. We may have ample food
stocks now, but they will be not sufficient for the next year.
The importance of social protection has been highlighted in several fora and many countries have
rolled out measures to cushion their populations from income losses. External assistance on favorable
terms such as concessional loans, grants, debt rescheduling, or debt swaps is key to enable poorer
countries to quickly implement large scale social safety net programs. The IMF is so far responding to
emergency financing requests from 102 countries worth USD 100 billion. Financing is already
approved for over 70 countries and immediate debt service relief for the next six months to 29
15countries. The G20 has further agreed to suspend repayment of official bilateral credit for poorest
countries and the International Institute for Finance urged private-sector creditors to forgo debt
payments until the end of the year without declaring borrowers in default.
However, there are still significant gaps in coverage. As highlighted above, only 4 percent of people in
the lowest income quintile in Sub-Saharan Africa receive assistance from the government in normal
times; extra efforts are therefore needed to reach those most in need. Moving beyond the rhetoric,
the international community needs to significantly step up to support poorer countries’ social
protection systems so that no one is left behind. This must be done immediately so that people are
not forced to sell their productive economic assets which they use to earn a living in normal times.
COVID-19 is a global problem that requires global collective action. Until a solution is available and
economies are on their paths to recovery, we need to save lives and protect livelihoods.
16Table 1: Countries at risk
Food supply chain disruptions Income loss
Hazard Exposure Vulnerability Exposure Vulnerability
Workers Risk Risk
Intermediate Employment in
per 100,000 Supermarkets Working Oxford from from Overall
Country Region Oxford inputs and fixed high/medium-
USD of per 100,000 poverty economic domestic external risk
stringency capital in gross high impact
gross ag inhabitants support shock shock
index ag output sectors
output (number) (percentage) index
(percentage) (percentage)
(number)
Burundi 12 37 283 0.31 5 73 0 2 2 4
Djibouti 41 53 361 0.31 51 17 13 3 3 6
Ethiopia 36 26 136 0.04 25 23 25 2 3 5
Kenya 50 15 69 0.40 34 25 50 2 1 3
East Africa
Rwanda 46 19 170 0.31 28 46 25 3 1 4
Somalia 29 26 283 0.28 13 71 0 2 3 5
South Sudan 36 15 261 0.38 27 43 0 2 3 5
Uganda 49 27 200 0.87 20 35 50 2 1 3
Benin 34 28 89 0.39 52 39 0 3 2 5
Burkina Faso 38 16 206 0.44 54 34 0 3 1 4
Cameroon 34 23 106 0.46 45 15 38 1 3 4
Central African Republic 33 26 214 0.51 18 67 0 2 2 4
Chad 36 9 195 0.36 20 34 50 1 2 3
Côte d’Ivoire 39 27 31 1.18 51 19 50 1 1 2
Gambia 41 12 354 60 8 0 2
Ghana 35 27 81 0.08 53 8 50 3 2 5
Guinea Western 40 24 248 0.44 33 29 0 2 2 4
Guinea-Bissau and Central 31 94 0.53 26 58 1
Liberia Africa 44 26 56 0.39 45 39 0 3 3 6
Mali 31 23 54 0.56 31 44 50 1 1 2
Mauritania 42 18 80 0.64 36 3 50 1 2 3
Niger 26 14 182 0.35 22 39 25 1 3 4
Nigeria 43 27 17 0.04 50 37 0 3 3 6
São Tomé & Príncipe 28 119 60 35 1
Senegal 40 23 100 0.56 53 30 63 2 1 3
Sierra Leone 36 21 76 0.29 38 41 0 2 3 5
Togo 25 76 0.41 55 35 1
Angola 40 33 68 0.62 30 28 50 1 3 4
17Congo 44 26 120 0.71 54 35 75 3 2 5
DRC 42 22 193 0.47 22 68 50 2 2 4
Eswatini 45 28 41 0.70 60 3 25 3 1 4
Lesotho 41 25 232 0.47 50 39 50 3 1 4
Madagascar 37 25 304 0.39 29 68 25 2 1 3
Southern
Malawi 30 30 299 0.27 50 64 100 3 1 4
Africa
Mozambique 29 20 268 0.31 21 51 0 2 3 5
Namibia 35 46 51 3.51 55 7 75 1 1 2
Tanzania 24 20 141 0.28 27 36 0 2 1 3
Zambia 28 28 179 0.61 39 45 25 2 3 5
Zimbabwe 44 47 153 0.43 25 18 25 3 3 6
Algeria 46 20 16 0.62 40 0 38 1 2 3
Armenia 38 14 7.83 37 0 2
Egypt 42 25 15 6.61 44 0 50 1 1 2
Iran 32 42 12 11.56 51 0 75 1 3 4
Iraq 55 30 4 1.00 43 0 50 1 3 4
Jordan 47 58 6 6.82 52 0 38 1 2 3
Kyrgyzstan 50 72 23 3.40 49 0 50 2 2 4
Middle East
Lebanon 47 30 2 0.57 47 0 25 2 3 5
and North
Libya 49 48 18 16.76 44 0 0 2 2 4
Africa
Palestine 55 48 12 47 0 50 2
Sudan 45 19 21 0.55 40 6 50 1 3 4
Syria 42 39 18 1.92 48 28 0 2 2 4
Tajikistan 22 28 76 0.62 27 4 25 1 2 3
Tunisia 46 36 14 2.64 52 0 75 1 1 2
Turkey 44 47 9 20.33 55 0 63 1 1 2
Yemen 25 49 33 0.26 44 48 0 3 2 5
Afghanistan 44 29 111 0.17 30 39 0 3 3 6
Bangladesh 49 32 95 0.11 49 8 50 3 2 5
Bhutan 44 14 105 1.59 28 1 75 1 2 3
Cambodia 30 27 96 3.13 51 7 25 1 1 2
DPR Korea Asia and 21 78 0.22 36 17 2
India Pacific 51 31 73 0.38 37 10 75 3 1 4
Indonesia 45 33 39 0.52 52 4 0 3 1 4
Laos 38 26 82 0.77 24 8 13 1 1 2
Myanmar 39 20 148 0.75 41 2 0 1 1 2
Nepal 54 24 169 0.22 24 6 75 2 3 5
18Pakistan 50 29 32 0.19 46 2 75 3 1 4
Papua New Guinea 35 28 44 1.64 33 21 0 1 2 3
Philippines 58 31 39 1.93 55 2 13 3 1 4
Sri Lanka 48 30 60 7.92 52 0 0 2 1 3
Timor-Leste 34 32 175 38 21 100 3
Vanuatu 41 27 25 1.37 31 13 13 1 2 3
Bolivia 50 34 47 0.59 50 5 50 3 2 5
Colombia 48 36 14 4.08 63 1 75 2 3 5
Cuba 46 50 13 5.25 40 0 50 1 1 2
Dominican Republic 48 37 9 2.90 64 1 25 2 2 4
Ecuador Latin 50 42 11 2.21 53 4 75 2 3 5
El Salvador America 57 35 13 1.85 66 0 75 3 2 5
Guatemala and the 55 30 25 1.40 53 3 75 2 1 3
Haiti Caribbean 41 24 136 0.49 60 17 25 3 3 6
Honduras 54 44 21 0.76 54 11 88 3 2 5
Nicaragua 7 38 11 0.77 53 5 0 1 1 2
Peru 52 31 23 0.60 55 3 100 3 2 5
Venezuela 47 55 2 2.41 64 11 50 3 3 6
Notes: The value of the Oxford Stringency Index is the average value of the index from 1 January to 15 June 2020. Colors indicate countries’ food security risk due to local COVID-19 outbreaks. Purple indicates highest
risk; blue medium risk; and yellow lowest risk. Countries with missing data (and, thus, missing risk categorization) are shown in grey.
19You can also read