EIC VALUE FUND - Equity Investment Corporation
←
→
Page content transcription
If your browser does not render page correctly, please read the page content below
EIC VALUE FUND

                                         Annual Investment Adviser’s Report
                                                   April 30, 2021
                                                    (Unaudited)

Dear Fellow Shareholder,
Thank you for reviewing our annual report. In it, we discuss our perspective on the market, the EIC Value Fund’s
(the “Fund”) performance, and some of the recent purchase and sale activity in the Fund. A listing of the Fund’s
investments and other financial information follow our comments.
Perspective on the Market
What a difference a year makes!
At this time last year, we were lamenting a brutal market decline caused by the Covid-19 pandemic and the attendant
economic lockdowns. By way of review:
    •   It was the fastest decline into a bear market in history.1
    •   The absolute returns for every Russell Value Index were the worst on record.2
    •   The performance spread between the Russell 3000 Growth® and Russell 3000 Value® Indexes ranked at the
        99th percentile. The only time growth outperformed value by a larger margin was at the peak of the tech bubble.3
Fast forward to this year:
    •   Value stocks outperformed growth stocks over the last three-, six-, and nine-month periods.4
    •   The Fund performed well, both in absolute and relative terms.
For the trailing twelve months, growth still edged out value, with the Russell 3000 Growth Index increasing 52.41%,
compared to 47.78% for the Russell 3000 Value Index. The Fund modestly outperformed the value index over the
trailing twelve months, gaining 48.85% (Institutional Class).

1
    Source: Batnick, Michael, “The Fastest Bear Market Ever.” 09 March 2020. https://theirrelevantinvestor.com/ 2020/03/09/
    the-fastest-bear-market-ever/. 07 April 2020.
2
    Data Source: S&P Global Market Intelligence, Quarterly returns of the Russell 3000, 2000 & 1000 Value Indexes,
    June 30, 1979 to March 31, 2020; Russell Midcap Value, March 31, 1986 to March 31, 2020.
3
    Data Source: S&P Global Market Intelligence, Quarterly returns of the Russell 3000 Value and Growth Indexes,
    June 30, 1979 to March 31, 2020. The Russell 3000® Index measures the performance of the largest 3000 US
    companies of the US equity universe. The Russell 3000 Value includes those Russell 3000 Index companies with
    lower price-to-book ratios and lower expected growth values. The Russell 3000 Growth includes those Russell
    3000 companies with higher price-to-book ratios and higher forecasted growth values.
4
    Data Source: S&P Global Market Intelligence, Monthly returns of the Russell 3000 Value and Growth Indexes,
    August 31, 2020 to April 30, 2021.

                                                               1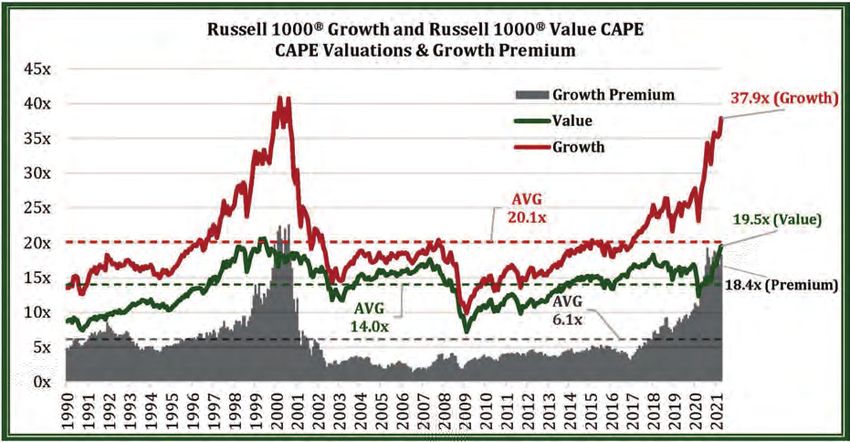
EIC VALUE FUND

                             Annual Investment Adviser’s Report (Continued)
                                             April 30, 2021
                                              (Unaudited)

Despite value’s recent strength, growth has significantly outpaced it over an extended period. Accordingly, we think
that we are in the early stages of value’s outperformance. As shown in the following chart, growth stocks still command
a substantial, near-historic premium valuation compared to value stocks.

     Data source: S&P Global Market Intelligence.5 Indexes are unmanaged and cannot be invested in directly.
     Past performance does not guarantee future results.
We believe growth stocks are priced to deliver subpar prospective returns.

5
    The Russell 1000 Growth Index modified CAPE (red line), Russell 1000 Value Index modified CAPE (green line),
    Russell 1000 Growth Index modified CAPE premium over Russell 1000 Value Index modified CAPE (gray area)
    at each month-end from January 31, 1990 to April 30, 2021. Modified CAPE is the ratio of index prices to trailing
    ten-year index level earnings before taxes (EBT) on a time-weighted basis. Annual index level EBT is imputed by
    dividing the year-end index price by an aggregated price to EBT multiple of index constituents. The Russell 1000®
    Index measures the performance of the large-cap segment of the US equity universe. The Russell 1000 Value
    includes those Russell 1000 Index companies with lower price-to-book ratios and lower expected growth values.
    The Russell 1000 Growth includes those Russell 1000 companies with higher price-to-book ratios and higher
    forecasted growth values.

                                                          2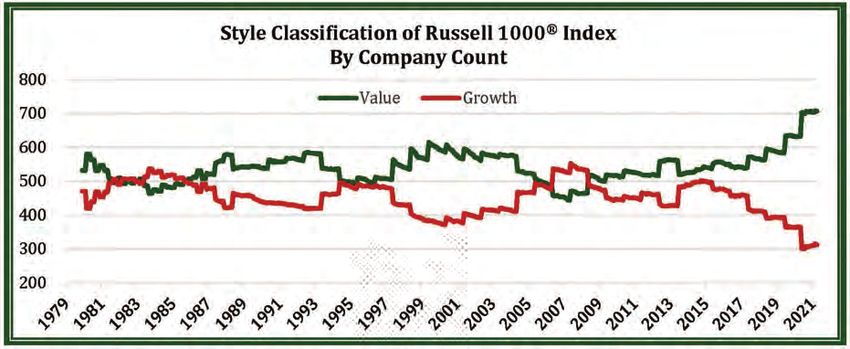
EIC VALUE FUND

                             Annual Investment Adviser’s Report (Continued)
                                             April 30, 2021
                                              (Unaudited)

There is significant variation in the degree of over-valuation within the growth universe, falling broadly into three
categories. Mega-cap growth companies with dominant market positions, many of which are in the information technology,
communication services, and consumer discretionary sectors, are all fully- to over-valued in our estimation. Smaller
but proven growth names with revenues and/or cash flow, such as in the software and consumer discretionary space,
appear to sport more extreme valuations. Finally, there is a large cohort of “concept” companies, with electric vehicle
listings coming public via special purpose acquisition companies (SPACs) as most representative of this group. These
companies are often pre-product and pre-revenue, and in our view, have nonsensical valuations.
A growth investor may not suffer substantial losses in the first group described above, but we think returns from
these levels are likely to be poor over a multi-year period. The remaining groups are more egregiously overvalued,
reminding us more of the dot-com bubble when there was way too much optimism, and the risk of capital loss was
severe. At the peak of the bubble, there were roughly 200 stocks in the top 1,500 (ranked by market capitalization)
that were unprofitable for the previous three years, and they had a collective market value of around $800 billion.
Today, a similar number of companies have been unprofitable for the past three years, but they sport an aggregate
market cap of over $2.2 trillion.6 While there will inevitably be a handful of winners in the space, we think the majority
will likely prove to be very poor investments from these levels.

6
    Source: Callum, Thomas, @Callum_Thomas, 03 April 2021. https://twitter.com/Callum_Thomas/status/
    1378406974132391936?s =20. As seen in Opsal, Scott, The Leuthold Group LLC. “Valuation Extremes: Here
    Be Dragons.” 17 March 2021. https://research. leutholdgroup.com/section/of-special-interest/articles/2021/03/17/
    valuation-extremes-here-be-dragons.22840. 05 April 2021.

                                                            3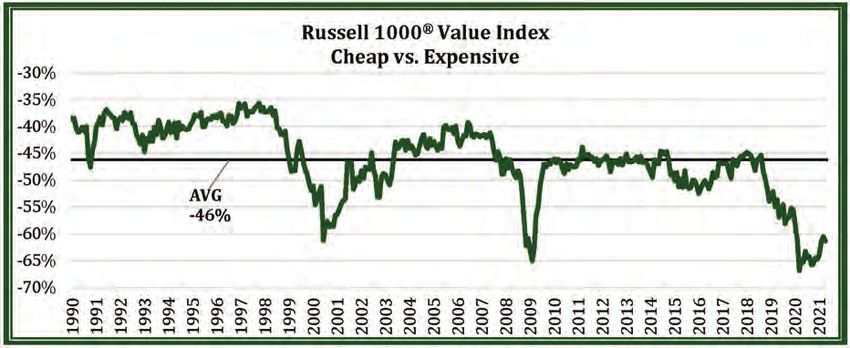
EIC VALUE FUND
Annual Investment Adviser’s Report (Continued)
April 30, 2021
(Unaudited)
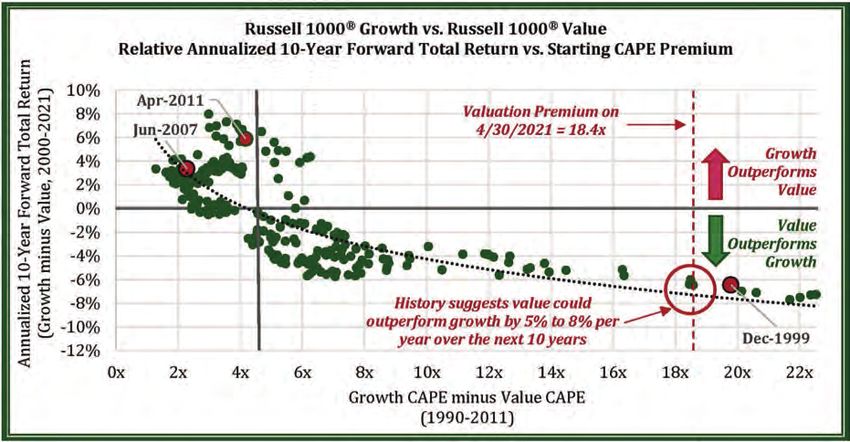
As a result of the disparities between the growth and value universes, history suggests that, from here, value stocks
could outperform growth stocks by 5% to 8% per year over the coming decade, as seen in the next chart, which
plots starting valuation versus subsequent ten-year returns.
Data Source: S&P Global Market Intelligence.7 Indexes are unmanaged and cannot be invested in directly.
Past performance does not guarantee future results.
Over the last five years, most of growth’s outperformance versus value has come from valuation expansion rather
than improving fundamentals. In our opinion, absent further relative valuation expansion, which seems unlikely given
current valuation levels, fundamental performance will largely drive total returns. But high valuations tend to result
in fundamental underperformance going forward, as expensively priced companies usually offer lower dividend yields
and are able to buy back fewer shares of their stock. Low valuations, conversely, tend to lead to fundamental outperformance
for the opposite reasons.
7
The Russell 1000 Growth Index modified CAPE premium over Russell 1000 Value Index modified CAPE (x-axis)
at each month-end January 31, 1990 to April 30, 2011, plotted against the annualized ten-year forward total return
difference between the Russell 1000 Growth and Russell 1000 Value indexes (y-axis) at each month-end January
31, 2000 to April 30, 2021.
4EIC VALUE FUND
Annual Investment Adviser’s Report (Continued)
April 30, 2021
(Unaudited)
Notably, this generic advantage of value over growth likely undersells the Fund’s current investment opportunity
set. As happened in the late 1990s, when growth strongly outperformed value, Russell’s annual index rebalancing
in 2020 reclassified many growth-oriented stocks, moving them into the value universe. For example, as shown in
the following chart, the Russell 1000 Index now has more than twice the number of companies considered to be
value as those considered to be growth, a record amount in the index’s more than forty-year history.
Data Source: S&P Global Market Intelligence.8 Indexes are unmanaged and cannot be invested in directly.
Past performance does not guarantee future results.
As a result, the growth indexes have become increasingly concentrated and risky. At the same time, the valuation
gap within the value indexes has become more extreme, with some pockets of attractively valued stocks. For instance,
in the Russell 1000 Value Index, cheaper stocks (25th percentile) recently sold at a 60% discount to more expensive
stocks (75th percentile), as shown in the next chart. In short, we continue to find plenty of what, in our estimation,
are attractive investment opportunities despite value’s recent rally.
8
Style classification of each company in the Russell 1000 Index based on each constituent’s weight in the Russell
1000 Value and/or Russell 1000 Growth indexes at each month-end December 31, 1979 to April 30, 2021.
5EIC VALUE FUND
Annual Investment Adviser’s Report (Continued)
April 30, 2021
(Unaudited)
Data source: S&P Global Market Intelligence.9 Indexes are unmanaged and cannot be invested in directly.
Past performance does not guarantee future results.
Stepping back, today’s environment is much changed from a year ago and, indeed, even from the beginning of this
year. COVID-19 and the attendant economic shutdown precipitated the downturn of 2020, and the recovery has
been a function of COVID-19’s evolution. A year ago, in the depths of uncertainty about the pandemic’s duration
and severity and its ultimate impact on the economy, effective vaccines were a hopeful but unknown outcome. But
as of this writing, the U.S. has administered almost 250 million shots, averaging over two million shots per day over
the last week. COVID-19 cases, hospitalizations, and deaths are all down 70% or more from their winter highs.10 It
now seems probable that an end to the pandemic is in sight, though the precise timing remains uncertain. In the
meantime, the government remains highly supportive of the economy, with continued large stimulus programs and
a significant infrastructure plan in the works. While the long-term implications of so much debt-financed spending
remain to be seen, shorter-term, it should prove expansionary.
9
Valuations based on Russell 1000 Value constituent price to prior three-year peak earnings at each month-end
January 31, 1990 to April 30, 2021. “Cheap” stocks (at 25% percentile of all constituent valuations) over “Expensive”
stocks (at 75% percentile of all constituent valuations.)
10
Data Source: Centers for Disease Control and Prevention, COVID-19, COVID Data Tracker Weekly Review, “Think
Globally. Get Vaccinated. Travel Locally. 3 May 2021. https://www.cdc.gov/coronavirus/2019-ncov/covid-data/
covidview/index.html. 04 May 2021.
6EIC VALUE FUND
Annual Investment Adviser’s Report (Continued)
April 30, 2021
(Unaudited)
This combination has fueled a steadily improving employment picture beginning in May of 2020 and continuing into
2021, and the markets have begun to reprice a return to normal.11 Oil prices, which briefly went negative for near-term
delivery in the depths of March 2020, have rebounded and now trade near $65 per barrel.12 On the back of a strengthening
economy and rising inflation expectations, long-term interest rates, as measured by 10-Year Treasuries, have surged
from a low of 0.5% in the summer of 2020 to over 1.6%, matching levels seen in early 2020.13,14 Moreover, the yield
spread between 2-Year and 10-Year Treasuries is now as wide as it has been in nearly six years, offering improved
returns for lenders and signaling economic strength.15
All of the above, should it continue, bodes well for value in general and the Fund in particular. That said, we believe
that by virtue of the Fund’s quality, diversification, and valuation, it is poised to deliver what, in our estimation, are
reasonable returns across a range of environments.
11
U.S. Bureau of Labor Statistics, All Employees, Total Nonfarm [PAYEMS], retrieved from FRED, Federal Reserve
Bank of St. Louis; https://fred.stlouisfed.org/series/PAYEMS. 04 May 2021.
12
Data Source: yahoo! Finance, Crude Oil May 2021. https://finance.yahoo.com/quote/CL%3DF?p=CL%3DF&.tsrc=fin-srch.
04 May 2021.
13
Kasumov, Aziza; Smith, Colby; and Platt, Eric. “US companies sound inflation alarm.”30 March 2021.
https://www.ft.com/content/f0bbed31-bea8-4542-b953-096762d2e59f. 05 April 2021.
14
Data Source: Board of Governors of the Federal Reserve System (US), 10-Year Treasury Constant Maturity
Rate [DGS10], retrieved from FRED, Federal Reserve Bank of St. Louis; https://fred.stlouisfed.org/series/DGS10.
04 May 2021.
15
Data Source: Federal Reserve Bank of St. Louis, 10-Year Treasury Constant Maturity Minus 2-Year Treasury
Constant Maturity [T10Y2Y], retrieved from FRED, Federal Reserve Bank of St. Louis; https://fred.stlouisfed.org/
series/T10Y2Y. 04 May 2021.
There can be no guarantee that any strategy will be successful. All investing involves risk, including potential loss
of principal.
7EIC VALUE FUND
Annual Investment Adviser’s Report (Continued)
April 30, 2021
(Unaudited)
Fund Performance
Performance for the Fund’s Institutional Class shares (net of expenses) over the twelve months ended April 30,
2021, is presented below:
EIC Russell 3000® S&P 500®
Month Value Fund Value Index Index
May 3.75% 3.39% 4.76%
June 0.25% -0.46% 1.99%
July 1.72% 3.85% 5.64%
August 3.87% 4.21% 7.19%
September -2.79% -2.58% -3.80%
October -1.04% -1.04% -2.66%
November 13.95% 13.80% 10.95%
December 2.70% 4.09% 3.84%
January 0.58% -0.52% -1.01%
February 6.98% 6.27% 2.76%
March 7.68% 5.84% 4.38%
April 3.85% 3.86% 5.34%
12 Months 48.85% 47.78% 45.98%
Data source: Morningstar DirectSM. Indexes are unmanaged and cannot be invested in directly. Past
performance does not guarantee future results.
The results shown in the table are over a relatively short period of time; thus, we caution against drawing sweeping
conclusions. Nevertheless, the Fund performed well over the twelve months on both an absolute basis and relative
to the Russell 3000 Value and S&P 500 indexes.
The performance data quoted represents past performance and may not be indicative of future results. The investment
return and principal value of an investment in the Fund will fluctuate so that an investor’s shares, when redeemed,
may be worth more or less than original cost. Current performance may be lower or higher. Performance data
current to the most recent month-end may be obtained by calling (855) 430-6487.
Securities in the Fund do not match those in the index and performance of the Fund will differ. Indexes are unmanaged,
do not incur management fees, costs and expenses, and cannot be invested in directly.
8EIC VALUE FUND
Annual Investment Adviser’s Report (Continued)
April 30, 2021
(Unaudited)
Looking at the Fund’s sixteen-month cumulative return, including the first quarter of 2020 with its steep and sudden
pandemic-related selloff, it has risen 25.44%, compared to 19.55% for the Russell 3000 Value Index and 32.42%
for the S&P 500. This return fits the Fund’s longer-term pattern in periods of stock market volatility and distress.
With its focus on a diversified portfolio of reasonably priced, higher-quality companies, the Fund’s tendency has
been to outperform the market during significant downdrafts when concerns about valuation and financial soundness
come to the forefront. And when the market offers up opportunity, as it did in the first quarter of 2020, we can act
decisively, positioning the Fund towards areas that have been hit hard, thus offering greater return prospects.
Performance attribution for the twelve months follows. Fund results are compared to those of the Russell 3000 Value
Index. The Fund’s outperformance relative to its benchmark was primarily attributable to stock selection and an
overweight in financials, one of the market’s top-performing sectors.
We don’t target sector weightings, either in an absolute sense or relative to market indexes; rather, they are principally
a residual of stock selection. Nonetheless, it is at times instructive to see how sector allocations affected Fund returns.
On balance, they were marginally positive, adding 0.15% to Fund performance over the trailing twelve months.
Each of the eleven sectors in the Russell 3000 Value Index posted positive returns for the twelve months ended
April 30, 2021. More economically sensitive businesses outperformed less cyclical ones. That can be seen in sector
performance – consumer discretionary and materials were the top-performing sectors, gaining 82.8% and 70.7%,
respectively. Industrials and financials were next in line, rising 69.3% and 66.7%, respectively. Relative to the index,
the Fund was overweight in financials but underweight in consumer discretionary, materials, and industrials.
In contrast, more stable businesses lagged – utilities were the worst-performing sector, increasing 20.3%, followed
by consumer staples, up 24.6%. Health care was also relatively disappointing, gaining 24.9%. Compared to its benchmark,
the Fund was overweight in utilities and health care but underweight in consumer staples.
Stock selection in the industrials sector positively impacted Fund performance. The Fund’s holdings in this sector
posted a collective return of 102.4%, while the index’s industrials gained 69.3%. United Parcel Service was the
Fund’s top performer in this sector, surging 121.7%.
Stock selection in the consumer staples sector also helped Fund performance. The Fund’s holdings in this sector
increased a combined 36.8%, versus a 24.6% gain for the index’s consumer staples stocks. Walgreens Boots Alliance
performed well for the Fund, rising 42.7%.
Other notable Fund holdings included Cimarex Energy, up 167.9%, Target, up 92.3%, PPG Industries, up 92.0%,
Charles Schwab, up 90.0%, PNC Financial Services, up 81.6%, and The Hartford Financial Services Group, up
79.0%.
Sectors are determined using the Global Industry Classification Standard (“GICS”). GICS® was developed by, and
is the exclusive property of, Standard & Poor’s Financial Services LLC (“S&P”) and MSCI Inc. (“MSCI”). GICS is
the trademark of S&P and MSCI. “Global Industry Classification Standard (GICS)” and “GICS Direct” are service
marks of S&P and MSCI.
Fund holdings and sector allocations are subject to change. Please see the schedule of investments section for
a complete list of Fund holdings.
9EIC VALUE FUND
Annual Investment Adviser’s Report (Continued)
April 30, 2021
(Unaudited)
On the other hand, the Fund’s cash position was the biggest drag on performance. Over the twelve months, the
Fund’s average cash level was 6.0%, detracting 3.4% from relative performance. Notably, we do not allocate to cash
tactically; the Fund’s cash position is a residual of the stock-selection process and is primarily a function of the
availability of undervalued stocks. We prefer to keep the Fund’s cash levels relatively low, in the single digits if possible.
Still, holding any cash was a drag in such a strong stock market.
Three of the Fund’s worst-performing holdings weren’t owned for the entire twelve-month period, so their performance
may be somewhat misleading. Nevertheless, they detracted from Fund performance. Mohawk Industries, which was
sold in July, declined 9.0%. Likewise, ConocoPhillips, which was sold in October, fell 2.9%. PepsiCo was actually a
good long-term performer for the Fund – it’s been a holding since the Fund commenced operations in May 2011 –
but it declined 0.6% between May 1, 2020, and its sale later that month.
Stock selection in the health care sector also adversely affected Fund performance. Fund holdings increased a
combined 16.9%, trailing the index’s health care stocks, which rose 24.9%. In particular, Sanofi, up 11.8%, Johnson
& Johnson, up 11.4%, and GlaxoSmithKline, down 6.2%, were the Fund’s poorest performers in this sector.
Portfolio Activity
The Fund remains tilted more than usual toward traditional value, consistent with our targeted approach of going
where value leads us. That tilt manifests today in a larger overweight of lower-priced sectors, typically classified as
value, and likewise a larger underweight of certain higher-priced sectors.
The Fund’s largest sector exposure, currently accounting for approximately 29% of the portfolio, is in financials,
where it is overweight compared to the Russell 3000 Value Index and where we continue to see attractively priced
opportunities. While the Fund’s financial exposure ticked slightly lower recently with the trims of Charles Schwab
and Hartford Financial, we are nonetheless near the Fund’s highest historical allocation to this sector. In the interest
of diversification, we are unlikely to increase it materially.
The Fund’s energy exposure is also higher than it is in the index. While we believe valuations remain attractive in
the sector, and the backdrop of broadly decreased exploration and production spending should support future commodity
prices, some of that improvement has already been reflected in oil-price increases over the past several months.
In response to those increases, we have reduced the Fund’s commodity price exposure by selling ConocoPhillips
and adding to the Williams Companies, whose profits derive from the transport of natural gas volumes and thus
are less sensitive to commodity prices.
Offsetting somewhat its economically sensitive value exposures to financials and energy, the Fund is also overweight
in utilities, health care, and consumer staples, which are less economically sensitive. Additionally, it is underweight
several cyclical sectors, most notably industrials, information technology, and consumer discretionary.
Portfolio composition is subject to change. The current and future portfolio holdings of the Fund are subject to
investment risk.
10EIC VALUE FUND
Annual Investment Adviser’s Report (Continued)
April 30, 2021
(Unaudited)
In response to the stock market’s continued volatility, Fund turnover remains somewhat elevated compared to its
historical levels. So far, in 2021, we have purchased two new positions for the Fund, Raytheon Technologies and
Barrick Gold. We also added to Fund positions in Exelon, GlaxoSmithKline, Honda Motor, Sanofi, the Williams Companies,
and Verizon Communications. Lastly, we sold the Fund’s position in Medtronic and trimmed its positions in Charles
Schwab, Hartford Financial Services, and Discovery.
Here’s more on the two recent purchases.
Raytheon Technologies is a product of the 2020 merger of the Raytheon Company and the commercial aerospace
businesses of United Technologies. The combined businesses serve roughly a 50-50 mix of commercial aerospace
and defense end markets, a blend offering the high long-term growth opportunities of commercial aerospace, married
to the attractive stability of defense spending during times of economic stress. True to form, while the defense business
has been largely unaffected by the pandemic, the commercial aerospace business has been hit hard.
Lower airplane utilization and delayed investments have resulted in a substantial drawdown in revenue and profits.
However, we think this weakness will ultimately prove transitory, and we expect a full recovery, though the timing
remains highly uncertain. At Raytheon’s current stock price, we believe investors are being compensated for their
patience. With a strong balance sheet and consistent cash flow from its defense business, we think Raytheon is
well-positioned to continue to invest in long-term growth opportunities, giving the company a key advantage relative
to some less-well-capitalized peers.
This is the second time the Fund has owned Barrick Gold. Today, it is a substantially more conservative company
than during the Fund’s prior period of ownership, from 2011 to 2015. Since then, Barrick has reduced net debt to
near zero, having committed over $7 billion to pay down debt over the past six years, and it has a solid investment-grade
credit rating. Management continues to focus on expense management, and the company has a more diversified,
high-quality, and geographically stable resource base. The bulk of Barrick’s asset value lies in Nevada, where it has
combined its holdings into a joint venture with Newmont Corporation, creating cost efficiencies. Overall, the company
has one of the lowest production costs in the industry.
Barrick’s shares are reasonably inexpensive based on current earnings, and those earnings are derived from a gold
price that has lagged other inflationary assets since the beginning of the pandemic. In short, we feel Barrick offers
a well-managed, conservatively capitalized, and attractively-priced asset base that has exhibited low correlation
with other equities, should offer a degree of inflation protection, and which we believe is not pricing in the possibility
of future gold strength.
11EIC VALUE FUND
Annual Investment Adviser’s Report (Concluded)
April 30, 2021
(Unaudited)
Of the Fund’s other trading activity, Discovery merits additional explanation. We originally purchased the Fund’s
Discovery position back in the fourth quarter of 2019, at a price in the mid-twenties. We then added modestly to the
position late last summer at a price of $20.26 per share. Beginning with the announcement late last year of its
discovery+ streaming service, then buttressed by consumer uptake of the service, the stock rose significantly, and
what had been a small position for the Fund increased. Accordingly, we trimmed the position three times in March,
first at a price of $48.05, then again at $53.48, and finally at $63.48. The total proceeds from these three trims were
more than the Fund’s initial cost of investment. In mid-March, the stock fell precipitously on disclosure that family
office Archegos Capital was facing capital calls and had a large leveraged position in Discovery in the process of
liquidation. Having fallen to the mid $30s, we added modestly to the Fund’s position in late March and April. Filtering
out the trading noise, we believe the company’s initial streaming success bodes well for its future and reduces the
risk from cable and satellite subscribers “cutting the cord” to move to lower-cost internet TV services, which had
weighed on the stock for the past several years.
This letter is intended to assist shareholders in understanding how the Fund performed during the fiscal year ended
April 30, 2021, and reflects the views of the investment adviser at the time of this writing. Of course, these views
may change and do not guarantee the future performance of the Fund or the markets.
The above commentary is for informational purposes only and does not represent an offer, recommendation, or
solicitation to buy, hold, or sell any security. The specific securities identified and described do not represent all of
the securities purchased or sold and you should not assume that investments in the securities identified and discussed
will be profitable.
12EIC VALUE FUND
Annual Report
Performance Data
April 30, 2021
(Unaudited)
Comparison of Change in Value of $10,000 Investment in EIC Value Fund’s Class A
vs. Russell 3000® Value Index and S&P 500® Index
40,000 EIC Value Fund –
Class A (with load)
35,000 $24,015
Russell 3000®
D 30,000
Value Index
O $28,975
25,000
L S&P 500® Index
L 20,000 $38,247
A
R 15,000
S
10,000
5,000
Past performance is not predictive of future results.
0
/3 1
4/ /11
10 /12
4/ /12
10 /13
4/ 13
10 /14
4/ /14
10 /15
4/ 15
10 /16
4/ /16
10 /17
4/ /17
10 /18
4/ /18
10 /19
4/ 19
10 /20
4/ 20
1
10 9/1
/2
1/
1/
1/
1/
1
30
1
30
30
1
30
30
1
30
1
30
1
30
30
30
1
/3
/3
/3
/3
/3
/3
/3
/3
/3
5/
Class A of an assumed $10,000 investment is adjusted for the maximum sales charge of 5.50%. This results in a
net investment of $9,450. Performance of Class C will vary from Class A due to differences in class-specific fees.
Average Annual Total Returns for the Periods Ended April 30, 2021
Since
1 Year 3 Years 5 Years Inception*
Class A (with sales charge) 40.39% 10.71% 10.53% 9.20%
Class A (without sales charge) 48.52% 12.81% 11.79% 9.82%
Russell 3000® Value Index 47.78% 12.24% 12.25% 11.28%**
S&P 500® Index 45.98% 18.67% 17.42% 14.42%**
Class C (with CDSC charge) 46.46% 11.94% 10.95% 9.32%
Class C (without CDSC charge) 47.46% 11.94% 10.95% 9.32%
Russell 3000® Value Index 47.78% 12.24% 12.25% 11.80%**
S&P 500® Index 45.98% 18.67% 17.42% 14.86%**
* Class A and Class C of the EIC Value Fund (the “Fund”) commenced operations on May 19, 2011 and July 18,
2011, respectively.
** Benchmark performance is from commencement date of the Class only and is not the commencement date of
the benchmark itself.
The performance data quoted represents past performance and does not guarantee future results. The investment
return and principal value of an investment in the Fund will fluctuate so that an investor’s shares, when redeemed,
may be worth more or less than their original cost. The graph and table do not reflect the deduction of taxes that
a shareholder would pay on Fund distributions or redemption of Fund shares. Current performance may be lower
or higher. Performance data current to the most recent month-end may be obtained by calling (855) 430-6487.
13EIC VALUE FUND
Annual Report
Performance Data (Continued)
April 30, 2021
(Unaudited)
Comparison of Change in Value of $100,000 (investment minimum) Investment in
EIC Value Fund’s Institutional Class
vs. Russell 3000® Value Index and S&P 500® Index
400,000 EIC Value Fund –
Institutional Class
350,000 $260,370
D 300,000 Russell 3000®
O Value Index
250,000 $285,114
L
S&P 500 ® Index
L 200,000 $376,557
A
R 150,000
S
100,000
50,000
Past performance is not predictive of future results.
0
1
2
3
4
5
6
7
8
9
0
1
/1
/1
/1
/1
/1
/1
/1
/1
/1
/2
/2
30
30
30
01
30
30
30
30
30
30
30
4/
4/
4/
5/
4/
4/
4/
4/
4/
4/
4/
Average Annual Total Returns for the Years Ended April 30, 2021
1 Year 3 Years 5 Years 10 Years
Institutional Class 48.85% 13.08% 12.06% 10.04%
Russell 3000® Value Index 47.78% 12.24% 12.25% 11.04%
S&P 500® Index 45.98% 18.67% 17.42% 14.17%
The performance data quoted represents past performance and does not guarantee future results. The investment
return and principal value of an investment in the Fund will fluctuate so that an investor’s shares, when redeemed,
may be worth more or less than their original cost. The graph and table do not reflect the deduction of taxes that
a shareholder would pay on Fund distributions or redemption of Fund shares. Current performance may be lower
or higher. Performance data current to the most recent month-end may be obtained by calling (855) 430-6487.
The returns shown for Class A shares reflect a deduction for the maximum front-end sales charge of 5.50%. The
returns shown for Class C shares reflect a maximum deferred sales charge of 1.00%. All of the Fund’s share classes
apply a 2.00% fee to the value of shares redeemed within 30 days of purchase. This redemption fee is not reflected
in the returns shown above. As stated in the current prospectus dated September 1, 2020, the Fund’s “Total Annual
Fund Operating Expenses” are 1.26%, 2.01% and 1.01%, and the Fund’s “Total Annual Fund Operating Expenses
After Fee Waiver and/or Expense Reimbursement” are 1.22%, 1.97% and 0.97% for Class A shares, Class C shares
and Institutional Class Shares, respectively, of the Fund Class’ average daily net assets. The ratios may differ from
the actual expenses incurred by the Fund for the period covered by this report. Effective September 1, 2020, Equity
Investment Corporation (the “Adviser”) has contractually agreed to waive or otherwise reduce its annual compensation
received from the Fund to the extent necessary to ensure that the Fund’s “Total Annual Fund Operating Expenses”,
excluding taxes, fees and expenses attributable to a distribution or service plan adopted by the FundVantage Trust
(the “Trust”), “Acquired Fund Fees and Expenses,” interest, extraordinary items and brokerage commissions, do
not exceed 0.95% of average daily net assets of the Fund (the “Expense Limitation”). Prior to September 1, 2020,
14EIC VALUE FUND
Annual Report
Performance Data (Concluded)
April 30, 2021
(Unaudited)
the Expense Limitation was 0.90%. The Expense Limitation will remain in place until August 31, 2021, unless the
Board of Trustees (“Board of Trustees”) of the Trust approves its earlier termination. Subject to approval by the
Board of Trustees, the Adviser may recoup any expenses or fees it has reimbursed within a three-year period from
the date on which the Adviser reduced its compensation and/or assumed expenses of the Fund. The Adviser is
permitted to seek reimbursement from the Fund, subject to certain limitations, for fees it waived and Fund expenses
it paid to the extent the total annual fund operating expenses do not exceed the limits described above or any lesser
limits in effect at the time of reimbursement. No recoupment will occur unless the Fund’s expenses are below the
Expense Limitation amount. Total returns would be lower had such fees and expenses not been waived and/or
reimbursed.
Mutual fund investing involves risk, including possible loss of principal. Value investing involves the risk that the
Fund’s investing in companies believed to be undervalued will not appreciate as anticipated. The Fund may invest
in the stocks of smaller- and medium-sized companies which may be more vulnerable to adverse business or economic
events than larger, more established companies.
The Fund intends to evaluate performance as compared to that of the Standard & Poor’s 500 (“S&P 500®”) Index
and the Russell 3000® Value Index. The S&P 500® Index is a widely recognized, unmanaged index of 500 common
stocks which are generally representative of the U.S. stock market as a whole. The Russell 3000® Value Index is
an unmanaged index that measures the performance of the broad value segment of the U.S. equity value universe.
It includes those Russell 3000® Index companies with lower price-to-book ratios and lower forecasted growth rates.
It is impossible to invest directly in an index.
15EIC VALUE FUND
Fund Expense Disclosure
April 30, 2021
(Unaudited)
As a shareholder of the Fund, you incur two types of costs: (1) transaction costs including sales
charges (loads) on purchase payments (if any) or redemption fees; and (2) ongoing costs, including
management fees, distribution and/or service (Rule 12b-1) fees (if any) and other Fund expenses. These
examples are intended to help you understand your ongoing costs (in dollars) of investing in the Fund
and to compare these costs with the ongoing costs of investing in other mutual funds.
These examples are based on an investment of $1,000 invested at the beginning of the six-month
period from November 1, 2020 through April 30, 2021 and held for the entire period.
Actual Expenses
The first line of each accompanying table provides information about actual account values and
actual expenses. You may use the information in this line, together with the amount you invested, to
estimate the expenses that you paid over the period. Simply divide your account value by $1,000 (for
example, an $8,600 account value divided by $1,000 = 8.6), then multiply the result by the number in
the first line under the heading entitled “Expenses Paid During Period” to estimate the expenses you
paid on your account during this period.
Hypothetical Examples for Comparison Purposes
The second line of each accompanying table provides information about hypothetical account values
and hypothetical expenses based on the Fund’s actual expense ratio and an assumed rate of return of
5% per year before expenses, which is not your Fund’s actual return. The hypothetical account values
and expenses may not be used to estimate the actual ending account balance or expenses you paid for
the period. You may use this information to compare the ongoing costs of investing in the Fund and other
funds. To do so, compare these 5% hypothetical examples with the 5% hypothetical examples that appear
in the shareholder reports of other funds.
Please note that the expenses shown in the accompanying tables are meant to highlight your ongoing
costs only and do not reflect any transactional costs, such as sales charges (loads) on purchase payments
(if any) or redemption fees. Therefore, the second line of each accompanying table is useful in comparing
ongoing costs only, and will not help you determine the relative total costs of owning different funds. In
addition, if these transactional costs were included, your costs would have been higher.
16EIC VALUE FUND
Fund Expense Disclosure (Concluded)
April 30, 2021
(Unaudited)
EIC Value Fund
Beginning Account Value Ending Account Value Expenses Paid
November 1, 2020 April 30, 2021 During Period*
Class A
Actual $1,000.00 $1,406.20 $ 7.16
Hypothetical (5% return before expenses) 1,000.00 1,018.84 6.01
Class C
Actual $1,000.00 $1,401.50 $11.61
Hypothetical (5% return before expenses) 1,000.00 1,015.12 9.74
Institutional Class
Actual $1,000.00 $1,408.10 $ 5.67
Hypothetical (5% return before expenses) 1,000.00 1,020.08 4.76
* Expenses are equal to the Fund’s annualized expense ratio for the six-month period ended April 30,
2021 of 1.20%, 1.95%, and 0.95% for Class A, Class C, and Institutional Class shares, respectively,
multiplied by the average account value over the period, multiplied by the number of days in the most
recent period (181), then divided by 365 to reflect the period. The Fund’s ending account values on
the first line in each table are based on the actual six-month total returns for the Fund of 40.62%,
40.15%, and 40.81% for Class A, Class C, and Institutional Class shares, respectively.
17EIC VALUE FUND
Portfolio Holdings Summary Table
April 30, 2021
(Unaudited)
The following table presents a summary by sector of the portfolio holdings of the Fund:
% of Net
Assets Value
COMMON STOCKS:
Financial. . . . . . . . . . . . . . . . . . . . . . . . . . . . . . . . . . . . . . . . . . . . . . . . . . . . . 33.5% $ 59,460,547
Consumer, Non-cyclical . . . . . . . . . . . . . . . . . . . . . . . . . . . . . . . . . . . . . . . . 18.5 32,947,639
Communications. . . . . . . . . . . . . . . . . . . . . . . . . . . . . . . . . . . . . . . . . . . . . . 10.2 18,168,450
Energy . . . . . . . . . . . . . . . . . . . . . . . . . . . . . . . . . . . . . . . . . . . . . . . . . . . . . . 9.0 15,924,529
Utilities . . . . . . . . . . . . . . . . . . . . . . . . . . . . . . . . . . . . . . . . . . . . . . . . . . . . . . 8.2 14,580,604
Consumer, Cyclical. . . . . . . . . . . . . . . . . . . . . . . . . . . . . . . . . . . . . . . . . . . . 6.3 11,142,527
Industrial . . . . . . . . . . . . . . . . . . . . . . . . . . . . . . . . . . . . . . . . . . . . . . . . . . . . 6.1 10,776,146
Basic Materials . . . . . . . . . . . . . . . . . . . . . . . . . . . . . . . . . . . . . . . . . . . . . . . 3.3 5,923,494
Short-Term Investment. . . . . . . . . . . . . . . . . . . . . . . . . . . . . . . . . . . . . . . . . 6.9 12,276,867
Liabilities in Excess of Other Assets . . . . . . . . . . . . . . . . . . . . . . . . . . . . (2.0) (3,530,007)
NET ASSETS 100.0% $177,670,796
Portfolio holdings are subject to change at any time.
The accompanying notes are an integral part of the financial statements.
18EIC VALUE FUND
Portfolio of Investments
April 30, 2021
Number Number
of Shares Value of Shares Value
COMMON STOCKS — 95.1% COMMON STOCKS — (Continued)
Basic Materials — 3.3% Energy — (Continued)
Barrick Gold Corp. . . . . . . . 123,025 $ 2,614,281 Williams Cos, Inc. (The) . . . 213,275 $ 5,195,379
PPG Industries, Inc. . . . . . . 19,325 3,309,213 15,924,529
5,923,494 Financial — 33.5%
Communications — 10.2% AGNC Investment Corp.,
Cisco Systems, Inc. . . . . . . 100,900 5,136,819 REIT . . . . . . . . . . . . . . . 186,575 3,345,290
Discovery, Inc., Class C* . . 110,045 3,555,554 American Express Co. . . . . 34,425 5,279,074
Facebook, Inc., Class A* . . 6,253 2,032,725 Charles Schwab Corp.
Verizon Communications, (The) . . . . . . . . . . . . . . . 63,265 4,453,856
Inc. . . . . . . . . . . . . . . . . 128,800 7,443,352 Empire State Realty Trust,
18,168,450 Inc., Class A, REIT . . . . . 467,200 5,321,408
Globe Life, Inc. . . . . . . . . . 43,247 4,432,385
Consumer, Cyclical — 6.3%
Hartford Financial Services
Honda Motor Co. Ltd., SP
Group, Inc. (The) . . . . . . 76,075 5,017,907
ADR. . . . . . . . . . . . . . . . 74,055 2,208,320
Jones Lang Lasalle, Inc.* . . 12,400 2,330,084
Lowe’s Cos, Inc. . . . . . . . . 10,110 1,984,088
PNC Financial Services
Target Corp.. . . . . . . . . . . . 9,015 1,868,449
Group, Inc. (The) . . . . . . 30,500 5,701,975
Walgreens Boots Alliance,
Travelers Cos, Inc. (The) . . 30,950 4,786,727
Inc. . . . . . . . . . . . . . . . . 95,700 5,081,670
Truist Financial Corp. . . . . . 91,281 5,413,876
11,142,527
US Bancorp. . . . . . . . . . . . 103,940 6,168,839
Consumer, Non-cyclical — 18.5% Wells Fargo & Co. . . . . . . . 160,025 7,209,126
AmerisourceBergen Corp. . 32,225 3,892,780 59,460,547
GlaxoSmithKline PLC, SP
Industrial — 6.1%
ADR. . . . . . . . . . . . . . . . 202,530 7,562,470
General Dynamics Corp. . . 28,175 5,359,730
Ingredion, Inc. . . . . . . . . . . 55,135 5,150,160
Raytheon Technologies
Johnson & Johnson . . . . . . 27,285 4,440,088
Corp. . . . . . . . . . . . . . . . 20,950 1,743,878
Kroger Co. (The) . . . . . . . . 92,500 3,379,950
United Parcel Service, Inc.,
McKesson Corp. . . . . . . . . 16,950 3,179,142
Class B . . . . . . . . . . . . . 18,015 3,672,538
Sanofi SA, ADR . . . . . . . . . 102,025 5,343,049
10,776,146
32,947,639
Utilities — 8.2%
Energy — 9.0%
Exelon Corp. . . . . . . . . . . . 116,060 5,215,737
Cimarex Energy Co.. . . . . . 76,675 5,075,885
National Fuel Gas Co. . . . . 20,000 993,200
Exxon Mobil Corp. . . . . . . . 27,285 1,561,793
National Grid PLC, SP
TOTAL SE, SP ADR. . . . . . 92,400 4,091,472 ADR. . . . . . . . . . . . . . . . 38,200 2,405,836
The accompanying notes are an integral part of the financial statements.
19EIC VALUE FUND
Portfolio of Investments (Concluded)
April 30, 2021
Number
of Shares Value
COMMON STOCKS — (Continued)
Utilities — (Continued)
OGE Energy Corp.. . . . . . . 70,525 $ 2,366,819
PPL Corp. . . . . . . . . . . . . . 123,550 3,599,012
14,580,604
TOTAL COMMON STOCKS
(Cost $108,902,041) . . . . . . . . . . . 168,923,936
SHORT-TERM INVESTMENT — 6.9%
Money Market Fund — 6.9%
Dreyfus Institutional
Preferred Treasury
Securities Money Market
Fund
0.01%(a) . . . . . . . . . . . . . 12,276,867 12,276,867
TOTAL SHORT-TERM
INVESTMENT
(Cost $12,276,867) . 12,276,867
TOTAL INVESTMENTS - 102.0%
(Cost $121,178,908) . . 181,200,803
LIABILITIES IN EXCESS
OF OTHER ASSETS -
(2.0)% . . . . . . . . . . . . . . (3,530,007)
NET ASSETS - 100.0% . . . $ 177,670,796
* Non-income producing.
(a)
Rate periodically changes. Rate disclosed is the
7-day yield at April 30, 2021.
ADR American Depository Receipt
PLC Public Limited Company
REIT Real Estate Investment Trust
SP ADR Sponsored American Depository Receipt
The accompanying notes are an integral part of the financial statements.
20EIC VALUE FUND
Statement of Assets and Liabilities
April 30, 2021
Assets
Investments, at value (Cost $121,178,908) . . . . . . . . . . . . . . . . . . . . . . . . . . . . . . . . . . . . . . . $181,200,803
Receivable for capital shares sold . . . . . . . . . . . . . . . . . . . . . . . . . . . . . . . . . . . . . . . . . . . . . . 389,170
Dividends receivable . . . . . . . . . . . . . . . . . . . . . . . . . . . . . . . . . . . . . . . . . . . . . . . . . . . . . . . . . . 255,216
Prepaid expenses and other assets . . . . . . . . . . . . . . . . . . . . . . . . . . . . . . . . . . . . . . . . . . . . . 33,918
Total assets . . . . . . . . . . . . . . . . . . . . . . . . . . . . . . . . . . . . . . . . . . . . . . . . . . . . . . . . . . . . . . . . 181,879,107
Liabilities
Payable for investments purchased . . . . . . . . . . . . . . . . . . . . . . . . . . . . . . . . . . . . . . . . . . . . . 3,658,441
Payable for capital shares redeemed . . . . . . . . . . . . . . . . . . . . . . . . . . . . . . . . . . . . . . . . . . . . 345,093
Payable to Adviser . . . . . . . . . . . . . . . . . . . . . . . . . . . . . . . . . . . . . . . . . . . . . . . . . . . . . . . . . . . . 87,282
Payable for audit fees . . . . . . . . . . . . . . . . . . . . . . . . . . . . . . . . . . . . . . . . . . . . . . . . . . . . . . . . . 30,625
Payable for administration and accounting fees . . . . . . . . . . . . . . . . . . . . . . . . . . . . . . . . . . . 28,242
Payable for shareholder reporting fees . . . . . . . . . . . . . . . . . . . . . . . . . . . . . . . . . . . . . . . . . . 15,471
Payable for transfer agent fees . . . . . . . . . . . . . . . . . . . . . . . . . . . . . . . . . . . . . . . . . . . . . . . . . 14,334
Payable for distribution fees . . . . . . . . . . . . . . . . . . . . . . . . . . . . . . . . . . . . . . . . . . . . . . . . . . . . 12,825
Payable for custodian fees . . . . . . . . . . . . . . . . . . . . . . . . . . . . . . . . . . . . . . . . . . . . . . . . . . . . . 10,990
Payable for shareholder servicing fees . . . . . . . . . . . . . . . . . . . . . . . . . . . . . . . . . . . . . . . . . . 3,487
Payable for Trustees’ and Officers’ fees. . . . . . . . . . . . . . . . . . . . . . . . . . . . . . . . . . . . . . . . . . 1,000
Accrued expenses . . . . . . . . . . . . . . . . . . . . . . . . . . . . . . . . . . . . . . . . . . . . . . . . . . . . . . . . . . . . 521
Total liabilities . . . . . . . . . . . . . . . . . . . . . . . . . . . . . . . . . . . . . . . . . . . . . . . . . . . . . . . . . . . . . . 4,208,311
Net Assets. . . . . . . . . . . . . . . . . . . . . . . . . . . . . . . . . . . . . . . . . . . . . . . . . . . . . . . . . . . . . . . . . . . . . $177,670,796
Net Assets consisted of:
Capital stock, $0.01 par value . . . . . . . . . . . . . . . . . . . . . . . . . . . . . . . . . . . . . . . . . . . . . . . . . . $ 108,184
Paid-in capital . . . . . . . . . . . . . . . . . . . . . . . . . . . . . . . . . . . . . . . . . . . . . . . . . . . . . . . . . . . . . . . . 109,829,582
Total distributable earnings . . . . . . . . . . . . . . . . . . . . . . . . . . . . . . . . . . . . . . . . . . . . . . . . . . . . 67,733,030
Net Assets. . . . . . . . . . . . . . . . . . . . . . . . . . . . . . . . . . . . . . . . . . . . . . . . . . . . . . . . . . . . . . . . . . . . . $177,670,796
Class A:
Net asset value, redemption price per share
($11,784,263 / 715,232 shares). . . . . . . . . . . . . . . . . . . . . . . . . . . . . . . . . . . . . . . . . . . . . . . . . . . . . $16.48
Maximum offering price per share (100/94.5 of $16.48) . . . . . . . . . . . . . . . . . . . . . . . . . . . . . . . . . . $17.44
Class C:
Net asset value, offering and redemption price per share
($16,925,567 / 1,051,536 shares) . . . . . . . . . . . . . . . . . . . . . . . . . . . . . . . . . . . . . . . . . . . . . . . . . . . $16.10
Institutional Class:
Net asset value, offering and redemption price per share
($148,960,966 / 9,051,647 shares) . . . . . . . . . . . . . . . . . . . . . . . . . . . . . . . . . . . . . . . . . . . . . . . . . . $16.46
The accompanying notes are an integral part of the financial statements.
21EIC VALUE FUND
Statement of Operations
For the Year Ended April 30, 2021
Investment income
Dividends. . . . . . . . . . . . . . . . . . . . . . . . . . . . . . . . . . . . . . . . . . . . . . . . . . . . . . . . . . . . . . . . . . . . . $ 3,850,061
Less: foreign taxes withheld . . . . . . . . . . . . . . . . . . . . . . . . . . . . . . . . . . . . . . . . . . . . . . . . . . . . . (81,158)
Total investment income . . . . . . . . . . . . . . . . . . . . . . . . . . . . . . . . . . . . . . . . . . . . . . . . . . . . . . 3,768,903
Expenses
Advisory fees (Note 2). . . . . . . . . . . . . . . . . . . . . . . . . . . . . . . . . . . . . . . . . . . . . . . . . . . . . . . . . . 1,073,737
Distribution fees (Class C) (Note 2) . . . . . . . . . . . . . . . . . . . . . . . . . . . . . . . . . . . . . . . . . . . . . . 128,842
Transfer agent fees (Note 2). . . . . . . . . . . . . . . . . . . . . . . . . . . . . . . . . . . . . . . . . . . . . . . . . . . . . 123,331
Administration and accounting fees (Note 2). . . . . . . . . . . . . . . . . . . . . . . . . . . . . . . . . . . . . . . 87,966
Registration and filing fees . . . . . . . . . . . . . . . . . . . . . . . . . . . . . . . . . . . . . . . . . . . . . . . . . . . . . . 46,946
Trustees’ and officers’ fees. . . . . . . . . . . . . . . . . . . . . . . . . . . . . . . . . . . . . . . . . . . . . . . . . . . . . . 44,051
Shareholder servicing fees (Class C) (Note 2) . . . . . . . . . . . . . . . . . . . . . . . . . . . . . . . . . . . . . 42,947
Shareholder reporting fees. . . . . . . . . . . . . . . . . . . . . . . . . . . . . . . . . . . . . . . . . . . . . . . . . . . . . . 37,539
Legal fees . . . . . . . . . . . . . . . . . . . . . . . . . . . . . . . . . . . . . . . . . . . . . . . . . . . . . . . . . . . . . . . . . . . . 36,974
Audit fees. . . . . . . . . . . . . . . . . . . . . . . . . . . . . . . . . . . . . . . . . . . . . . . . . . . . . . . . . . . . . . . . . . . . . 30,531
Custodian fees (Note 2) . . . . . . . . . . . . . . . . . . . . . . . . . . . . . . . . . . . . . . . . . . . . . . . . . . . . . . . . 24,176
Distribution fees (Class A) (Note 2). . . . . . . . . . . . . . . . . . . . . . . . . . . . . . . . . . . . . . . . . . . . . . . 22,302
Other expenses . . . . . . . . . . . . . . . . . . . . . . . . . . . . . . . . . . . . . . . . . . . . . . . . . . . . . . . . . . . . . . . 21,317
Total expenses . . . . . . . . . . . . . . . . . . . . . . . . . . . . . . . . . . . . . . . . . . . . . . . . . . . . . . . . . . . . . . 1,720,659
Less: waivers and reimbursements (Note 2) . . . . . . . . . . . . . . . . . . . . . . . . . . . . . . . . . . . . . (189,225)
Net expenses after waivers and reimbursements . . . . . . . . . . . . . . . . . . . . . . . . . . . . . . . . . . . 1,531,434
Net investment income . . . . . . . . . . . . . . . . . . . . . . . . . . . . . . . . . . . . . . . . . . . . . . . . . . . . . . . . . 2,237,469
Net realized and unrealized gain from investments:
Net realized gain from investments . . . . . . . . . . . . . . . . . . . . . . . . . . . . . . . . . . . . . . . . . . . . . . . 14,089,498
Net change in unrealized appreciation from investments . . . . . . . . . . . . . . . . . . . . . . . . . . . . 41,560,193
Net realized and unrealized gain from investments . . . . . . . . . . . . . . . . . . . . . . . . . . . . . . . . . 55,649,691
Net increase in net assets resulting from operations . . . . . . . . . . . . . . . . . . . . . . . . . . . . . . $57,887,160
The accompanying notes are an integral part of the financial statements.
22EIC VALUE FUND
Statements of Changes in Net Assets
For the For the
Year Ended Year Ended
April 30, 2021 April 30, 2020
Increase/(decrease) in net assets from operations:
Net investment income . . . . . . . . . . . . . . . . . . . . . . . . . . . . . . . . . . . . . . . . $ 2,237,469 $ 3,453,424
Net realized gain from investments . . . . . . . . . . . . . . . . . . . . . . . . . . . . . . 14,089,498 5,602,295
Net change in unrealized appreciation/(depreciation) from
investments . . . . . . . . . . . . . . . . . . . . . . . . . . . . . . . . . . . . . . . . . . . . . . . . 41,560,193 (26,646,296)
Net increase/(decrease) in net assets resulting from operations. . . . . . . 57,887,160 (17,590,577)
Less dividends and distributions to shareholders from:
Total distributable earnings
Class A . . . . . . . . . . . . . . . . . . . . . . . . . . . . . . . . . . . . . . . . . . . . . . . . . . . (448,206) (895,393)
Class C . . . . . . . . . . . . . . . . . . . . . . . . . . . . . . . . . . . . . . . . . . . . . . . . . . . (941,695) (1,543,147)
Institutional Class. . . . . . . . . . . . . . . . . . . . . . . . . . . . . . . . . . . . . . . . . . . (6,783,811) (12,414,744)
Net decrease in net assets from dividends and distributions to
shareholders . . . . . . . . . . . . . . . . . . . . . . . . . . . . . . . . . . . . . . . . . . . . . . . . . (8,173,712) (14,853,284)
Decrease in net assets derived from capital share
transactions (Note 4) . . . . . . . . . . . . . . . . . . . . . . . . . . . . . . . . . . . . . . . . (11,607,365) (43,885,547)
Total increase/(decrease) in net assets . . . . . . . . . . . . . . . . . . . . . . . . . . . . 38,106,083 (76,329,408)
Net assets
Beginning of year. . . . . . . . . . . . . . . . . . . . . . . . . . . . . . . . . . . . . . . . . . . . . 139,564,713 215,894,121
End of year . . . . . . . . . . . . . . . . . . . . . . . . . . . . . . . . . . . . . . . . . . . . . . . . . . $177,670,796 $139,564,713
The accompanying notes are an integral part of the financial statements.
23EIC VALUE FUND
Financial Highlights
Contained below is per share operating performance data for Class A shares outstanding, total investment
return, ratios to average net assets and other supplemental data for the respective period. The total returns
in the table represent the rate that an investor would have earned or lost on an investment in the Fund
(assuming reinvestment of all dividends and distributions). This information has been derived from information
provided in the financial statements and should be read in conjunction with the financial statements and
the notes thereto.
Class A
For the For the For the For the For the
Year Year Year Year Year
Ended Ended Ended Ended Ended
April 30, April 30, April 30, April 30, April 30,
2021 2020 2019 2018 2017
Per Share Operating Performance
Net asset value, beginning of year. . . . . . . . . . . . . . . . . . . . . . . . . . . . . . . . . . $ 11.75 $13.98 $ 14.33 $ 14.22 $ 13.02
Net investment income(1) . . . . . . . . . . . . . . . . . . . . . . . . . . . . . . . . . . . . . . . . 0.20 0.23 0.21 0.17 0.13
Net realized and unrealized gain/(loss) on investments. . . . . . . . . . . . . . . . . . . . 5.33 (1.42) 0.68 1.15 1.32
Net increase/(decrease) in net assets resulting from operations . . . . . . . . . . . . . 5.53 (1.19) 0.89 1.32 1.45
Dividends and distributions to shareholders from:
Net investment income . . . . . . . . . . . . . . . . . . . . . . . . . . . . . . . . . . . . . . . . . . (0.23) (0.21) (0.16) (0.15) (0.11)
Net realized capital gains . . . . . . . . . . . . . . . . . . . . . . . . . . . . . . . . . . . . . . . . (0.57) (0.83) (1.08) (1.06) (0.14)
Total dividends and distributions to shareholders . . . . . . . . . . . . . . . . . . . . . . . . (0.80) (1.04) (1.24) (1.21) (0.25)
(2) (2) (2) (2)
Redemption fees . . . . . . . . . . . . . . . . . . . . . . . . . . . . . . . . . . . . . . . . . . . . . . 0.00 0.00 0.00 0.00 —
Net asset value, end of year . . . . . . . . . . . . . . . . . . . . . . . . . . . . . . . . . . . . . . $ 16.48 $11.75 $ 13.98 $ 14.33 $ 14.22
Total investment return(3) . . . . . . . . . . . . . . . . . . . . . . . . . . . . . . . . . . . . . . . . 48.52% (9.54)% 6.86% 9.45% 11.13%
Ratios/Supplemental Data
Net assets, end of year (in thousands) . . . . . . . . . . . . . . . . . . . . . . . . . . . . . . . $11,784 $8,347 $15,019 $47,274 $52,845
Ratio of expenses to average net assets . . . . . . . . . . . . . . . . . . ........... 1.18% 1.15% 1.18% 1.24% 1.20%
Ratio of expenses to average net assets without waivers, expense
reimbursements, and/or recoupments, if any . . . . . . . . . . . . . . ........... 1.32%(4) 1.24%(4) 1.23%(4) 1.24% 1.20%
Ratio of net investment income to average net assets . . . . . . . . . ........... 1.45% 1.67% 1.47% 1.16% 0.98%
Portfolio turnover rate. . . . . . . . . . . . . . . . . . . . . . . . . . . . . . . . ........... 41% 36% 42% 33% 29%
(1)
The selected per share data was calculated using the average shares outstanding method for the year.
(2)
Amount is less than $0.005 per share.
(3)
Total investment return is calculated assuming a purchase of shares on the first day and a sale of shares on the last day of each period
reported and includes reinvestment of dividends and distributions, if any. Total investment return does not reflect the impact of the
maximum front-end sales load of 5.50% or any applicable sales charge. If reflected, the return would be lower.
(4)
During the period, certain fees were waived, reimbursed, and/or recouped. If such fee waivers, reimbursements, and/or
recoupments had not occurred, the ratios would have been as indicated (See Note 2).
The accompanying notes are an integral part of the financial statements.
24EIC VALUE FUND
Financial Highlights
Contained below is per share operating performance data for Class C shares outstanding, total investment
return, ratios to average net assets and other supplemental data for the respective period. The total returns
in the table represent the rate that an investor would have earned or lost on an investment in the Fund
(assuming reinvestment of all dividends and distributions). This information has been derived from information
provided in the financial statements and should be read in conjunction with the financial statements and
the notes thereto.
Class C
For the For the For the For the For the
Year Year Year Year Year
Ended Ended Ended Ended Ended
April 30, April 30, April 30, April 30, April 30,
2021 2020 2019 2018 2017
Per Share Operating Performance
Net asset value, beginning of year. . . . . . . . . . . . . . . . . . . . . . . . . . . . . . . . . . $ 11.52 $ 13.73 $ 14.12 $ 14.06 $ 12.87
Net investment income(1) . . . . . . . . . . . . . . . . . . . . . . . . . . . . . . . . . . . . . . . . 0.09 0.12 0.10 0.06 0.03
Net realized and unrealized gain/(loss) on investments. . . . . . . . . . . . . . . . . . . . 5.22 (1.41) 0.67 1.13 1.30
Net increase/(decrease) in net assets resulting from operations . . . . . . . . . . . . . 5.31 (1.29) 0.77 1.19 1.33
Dividends and distributions to shareholders from:
Net investment income . . . . . . . . . . . . . . . . . . . . . . . . . . . . . . . . . . . . . . . . . . (0.16) (0.09) (0.08) (0.07) (0.00)(2)
Net realized capital gains . . . . . . . . . . . . . . . . . . . . . . . . . . . . . . . . . . . . . . . . (0.57) (0.83) (1.08) (1.06) (0.14)
Total dividends and distributions to shareholders . . . . . . . . . . . . . . . . . . . . . . . . (0.73) (0.92) (1.16) (1.13) (0.14)
(2) (2) (2) (2)
Redemption fees . . . . . . . . . . . . . . . . . . . . . . . . . . . . . . . . . . . . . . . . . . . . . . 0.00 0.00 0.00 0.00 —
Net asset value, end of year . . . . . . . . . . . . . . . . . . . . . . . . . . . . . . . . . . . . . . $ 16.10 $ 11.52 $ 13.73 $ 14.12 $ 14.06
Total investment return(3) . . . . . . . . . . . . . . . . . . . . . . . . . . . . . . . . . . . . . . . . 47.46% (10.30)% 6.05% 8.63% 10.35%
Ratios/Supplemental Data
Net assets, end of year (in thousands) . . . . . . . . . . . . . . . . . . . . . . . . . . . . . . . $16,926 $17,926 $27,407 $35,488 $45,071
Ratio of expenses to average net assets . . . . . . . . . . . . . . . . . . ........... 1.93% 1.90% 1.93% 1.99% 1.95%
Ratio of expenses to average net assets without waivers, expense
reimbursements, and/or recoupments, if any . . . . . . . . . . . . . . ........... 2.07%(4) 1.99%(4) 1.98%(4) 1.99% 1.95%
Ratio of net investment income to average net assets . . . . . . . . . ........... 0.70% 0.92% 0.71% 0.41% 0.23%
Portfolio turnover rate. . . . . . . . . . . . . . . . . . . . . . . . . . . . . . . . ........... 41% 36% 42% 33% 29%
(1)
The selected per share data was calculated using the average shares outstanding method for the year.
(2)
Amount is less than $0.005 per share.
(3)
Total investment return is calculated assuming a purchase of shares on the first day and a sale of shares on the last day of each period
reported and includes reinvestment of dividends and distributions, if any. Total investment return does not reflect any applicable sales
charge.
(4)
During the period, certain fees were waived, reimbursed, and/or recouped. If such fee waivers, reimbursements, and/or
recoupments had not occurred, the ratios would have been as indicated (See Note 2).
The accompanying notes are an integral part of the financial statements.
25You can also read