Electronic Supplementary Information - The Royal Society of ...
←
→
Page content transcription
If your browser does not render page correctly, please read the page content below
Electronic Supplementary Material (ESI) for Chemical Communications.
This journal is © The Royal Society of Chemistry 2021

 Electronic Supplementary Information

 for

 Bottom-up Method for Synthesis of Layered Lithium Titanate

 Nanoplates using Ion Precursor
 Hyunsu Park,a,* Do Hyung Han,a Tomoyo Goto,a,b Sunghun Cho,a Woo-Byoung Kim,c Masato
 Kakihanaa,d and Tohru Sekinoa,*

 aSANKEN (The Institute of Scientific and Industrial Research), Osaka University, 8-1 Mohogaoka,
 Ibaraki, Osaka, 567-0047, Japan.
 bInstitute for Advanced Co-Creation Studies, Osaka University, 1-1 Yamadaoka, Suita, Osaka, 565-
 0871, Japan.
 cDepartment of Energy Engineering, Dankook University, 119 Dandae-ro, Dongnam-gu, Cheonan-si,
 31116, Republic of Korea.
 dInstitute of Multidisciplinary Research for Advanced Materials, Tohoku University, 2-1-1 katahira,
 Aoba-ku, Sendai, 980-8577, Japan.

 Corresponding Authors
 *E-mail: hspark23@sanken.osaka-u.ac.jp
 *E-mail: sekino@sanken.osaka-u.ac.jp

 1
Experimental section
Bottom-up process for the synthesis of lithium titanate nanoplates (LTNPs)
The peroxo titanium complex ion used as a precursor was synthesized as follows: Initially, 0.63 g of
TiH2 (>99%, Kojundo Chemical Laboratory Co., Ltd., Saitama, Japan) was treated with 62.46 mL of a
mixed solution containing H2O2 (30%, FUJIFILM Wako Pure Chemical Corporation, Osaka, Japan) and
a 4 M LiOH (>98.0%, Tokyo Chemical Industry Co., Ltd., Tokyo, Japan) aqueous solution for 6 h at 10
°C. The pH of the mixed solution was adjusted to 8 by adding the 4 M LiOH solution to the H2O2
solution. A solution color change to yellow was indicative of the formation of the peroxo titanium
complex ion. For the synthesis of the LTNPs, the prepared peroxo titanium complex ion solution was
heated in a refluxing vessel at 100 °C while stirring at 200 rpm for 12 h without further addition of
LiOH. Then, the yellowish LTNP precipitates were filtered using a vacuum pump (MDA-020C, ULVAC,
Inc., Kanagawa, Japan) and dried on a freezing dryer (EYELA FDU-2200, TOKYO RIKAKIKAI CO, LTD.,
Tokyo, Japan). To investigate their morphological stability, the LTNPs were subjected to acid and
thermal treatment as follows: (1) Acid treatment: the as-synthesized LTNP samples were treated
with a 5 M HCl (30%, FUJIFILM Wako Pure Chemical Corporation, Osaka, Japan) solution until the pH
stabilized at 5 and then washed by distilled water until the ion conductivity of the filtered solution
became less than 5 μS/cm using a vacuum pump. Finally, the acid-treated LTNP samples were dried.
(2) Thermal treatment: the LTNPs were heated at 500 °C for 1 h under ambient conditions at a
heating rate of 10 °C/min using a furnace.

Hydrothermal treatment of anatase TiO2 by LiOH solution
As a reference sample, another lithium titanate compound was synthesized as follows: 1 g of anatase
TiO2 (FUJIFILM Wako Pure Chemical Corporation, Osaka, Japan) was added into 15 mL of a 3.5 M
LiOH solution, and the mixture was placed into a Teflon lined autoclave (100 mL) and heated at 200
°C for 10 h. Then, the white products were filtered and dried.

Synthesis of layered sodium titanate using various methods
To compare their morphology and structure, sodium titanates (Na2-xHxTi2O5) were synthesized by the
following two approaches: (1) Using the peroxo titanium complex ion as a precursor in the bottom-
up method described above, using a 10 M NaOH (97%, FUJIFILM Wako Pure Chemical Corporation,
Osaka, Japan) solution instead of the 4 M LiOH solution. (2) According to a previously reported
procedure.1 Briefly, 1 g of P25 TiO2 powder was mixed with 400 mL of a 10 M NaOH solution and
then heated in a refluxing vessel at 115 °C for 24 h while stirring at 200 rpm. The resulting white
precipitates were washed by distilled water using the vacuum pump, and dried.

 2
Characterizations
The optical properties of the peroxo titanium complex ion were determined by ultraviolet–visible
spectroscopy (UV–vis) (UVmini1240, SHIMADZU Corporation, Tokyo, Japan). The crystal structure
and purity were examined by X-ray diffraction (XRD) (D8 ADVANCE, Bruker AXS Co. Ltd., Karlsruhe,
Germany). The diffraction patterns were collected using a Scintag diffractometer operating in the
Bragg configuration using Cu Kα radiation (λ = 1.54 Å) from 5° to 70° at a scanning rate of 0.02°. The
lattice parameters of the samples were calculated using the results of the XRD analysis and eq. (S1),
 1 ℎ2 2 2
 = + +
 2 2 2 2 (S1)
where d is the interplanar spacing, h, k, and l are the Miller indices, and a, b, and c are the lattice
constants of the crystal phase. The amount of lithium and titanium in the samples was measured
using inductively coupled plasma optical emission spectrometry (Optima 8300, PerkinElmer Japan
Co., Ltd., Yokohama, Japan). The X-ray absorption near edge structure (XANES) and extended X-ray
absorption fine structure (EXAFS) spectra of Ti K-edge were measured in an ionization chamber in
transmission mode on the Kyushu University Beamline (BL06) of the Kyushu Synchrotron Light
Research Centre (SAGA-LS; Tosu, Japan). Pellet samples for the Ti K-edge XANES and EXAFS
measurements were prepared as mixtures with boron nitride. As a reference sample, anatase TiO2
(FUJIFILM Wako Pure Chemical Corporation, Osaka, Japan) was used. The Ti K-edge spectra were
collected over a photon energy range of 4635.2–5938.6 eV. The spectra were analyzed by ATHENA
software (Ravel and Newville 2005).2 The UV–vis absorbance was evaluated using the solid sample
measurement mode (V-650, JASCO Co., Tokyo, Japan) within a wavelength range of 200–800 nm,
and the diffuse reflectance spectroscopy and optical bandgap energy were measured by the Tauc-
plot method using Kubelka–Munk transformation. For the O1s X-ray photoelectron spectra (XPS) (JPS-
9010MX JEOL Ltd., Tokyo, Japan), the binding energy was standardized with the C1s energy. The
morphology and particle size were observed using a field-emission scanning electron microscope (FE-
SEM, SU-9000, Hitachi High-Technologies Corporation, Tokyo, Japan) with SEM and scanning
transmission electron microscopy modes at an acceleration voltage of 30 kV. Transmission electron
microscopy (JEM-ARM200F, JEOL, Tokyo, Japan) was performed at an acceleration voltage of 200 kV
to further characterize the individual nanostructures of the titanate. Moreover, the lattice spacing
was investigated using the Gatan Digital Micrograph software (Gatan Inc., CA, USA).3 Without
dispersing the dried samples in any solvent to minimize the reaction with water molecules, the
samples were dropped on the surface of a carbon-coated copper grid as a solid powder.

 3
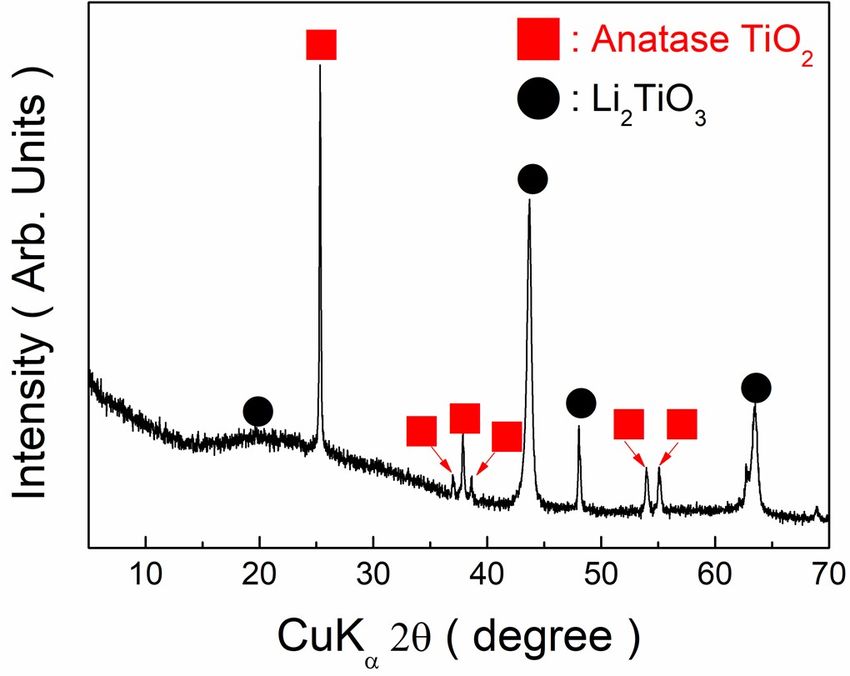
Supplementary Figures

Fig. S1. Ultraviolet–visible spectrum of the peroxo titanium complex ion solution obtained by treating
TiH2 with an H2O2/LiOH solution at 10 ºC for 6 h.

Fig. S2. X-ray diffraction pattern of the powder synthesized by hydrothermally treating anatase TiO2
using a 3.5 M LiOH solution. The mixed phases of anatase TiO2 (PDF card# 00-021-1272) and Li2TiO3
(PDF card# 00-033-0831) can be observed.

 4
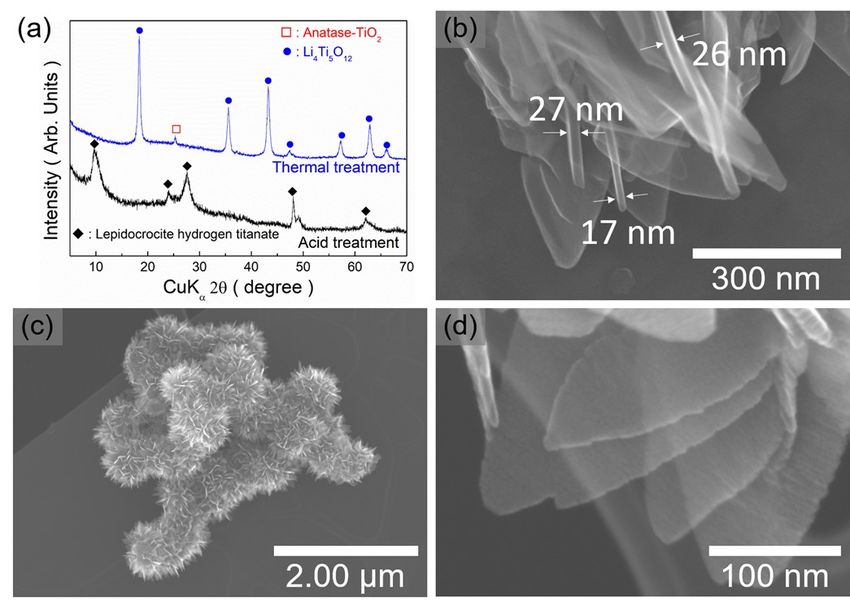
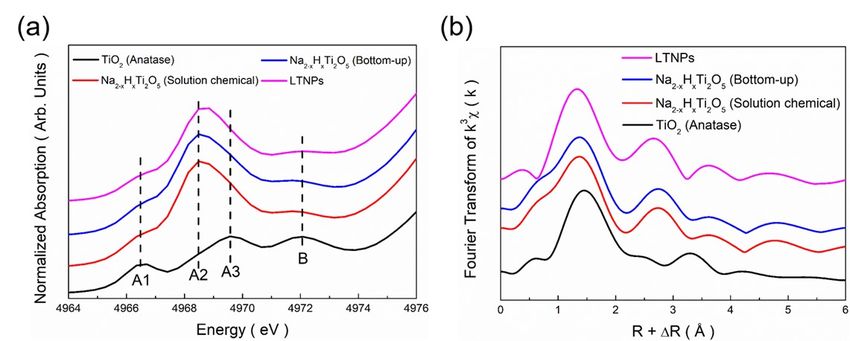
Fig. S3. X-ray absorption fine structure (XAFS) spectra of anatase, sodium titanate prepared by the
bottom-up method (Na2-xHxTi2O5 (Bottom-up)), sodium titanate prepared following a previously
reported procedure (Na2-xHxTi2O5 (Solution chemical)), and lithium titanate nanoplates (LTNPs): (a)
pre-edge regions of the X-ray absorption near edge structure spectra and (b) Fourier transform
extended XAFS spectra. Radial distribution functions were not corrected for the phase shift.

Fig. S4. (a) X-ray diffraction pattern of the powder prepared by acid treatment and thermal treatment
of the lithium titanate nanoplates. The pattern of the acid-treated sample (black line) can be assigned
to lepidocrocite-type hydrogen titanate. The lattice constants were determined to be a0 = 17.0 Å, b0
= 3.8 Å, and c0 = 2.9 Å. The pattern of the thermally treated sample (blue line) exhibits the mixed
phase of anatase TiO2 and Li4Ti5O12 (PDF card# 00-049-0207). Scanning electron microscopy (SEM)
image of (b) acid-treated sample and (c) thermally treated sample. (d) Magnified SEM image of the
thermally treated sample.

 5
Reference
1 T. Kasuga, M. Hiramatsu, A. Hoson, T. Sekino and K. Niihara, Langmuir, 1998, 14, 3160–3163.
2 B. Ravel and M. Newville, J. Synchrotron Radiat., 2005, 12, 537–541.
3 D. R. G. Mitchell, Microsc. Res. Tech., 2008, 71, 588–593.

 6
You can also read