Embassy Office Parks REIT - 2Q FY2021 Earnings Materials November 2, 2020
←
→
Page content transcription
If your browser does not render page correctly, please read the page content below
Embassy Office Parks REIT
2Q FY2021 Earnings Materials
November 2, 2020

                               1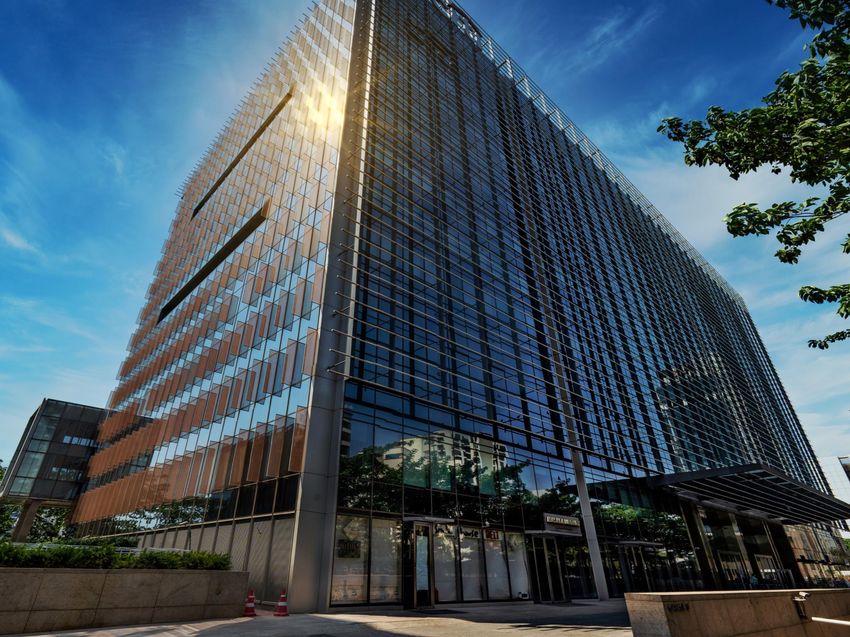
2Q FY2021 Earnings Materials

Press Release
Embassy REIT Announces Results for Second Quarter and Half Year Ended FY2020-21; Net Operating
Income up 10% YoY, Declares Quarterly Distributions of ₹4,244 million
Bengaluru, India, November 2, 2020

Embassy Office Parks REIT (NSE: EMBASSY / BSE: 542602) (‘Embassy REIT’), India’s first listed REIT and the largest in Asia by area, reported
results today for the second quarter and half year ended September 30, 2020.
The Board of Directors of Embassy Office Parks Management Services Private Limited (‘EOPMSPL’), Manager to Embassy REIT, at its Board
Meeting held earlier today, declared a distribution of ₹4,244 million or ₹5.50 per unit. The record date for the distribution is November 10, 2020 and
will be paid on or before November 17, 2020.
Michael Holland, Chief Executive Officer, said, “Embassy REIT continues to deliver amidst challenging conditions caused by the global pandemic.
We have been successful in collecting rents, keeping expenses low, and maintaining a healthy balance sheet. Most notably, we are distributing cash
flows to our Unitholders that compares to the payouts of the top yield-paying Indian corporates. Our multinational technology occupiers and global
captive tenants continue to see strong demand for their services as global businesses bring forward spend on digital transformation, cloud solutions
and cybersecurity. We also remain focused on growth through multiple channels including accretive acquisitions.”
Financial Highlights
•     Net Operating Income (‘NOI’) for 2Q FY2021 grew year-on-year by 10% to ₹4,814 million and cumulatively by 5% to ₹9,383 for 1H FY2021,
      with operating margin of 89% for both periods
•     Distributed ₹4,244 million or ₹5.50 per unit (Distribution Per Unit, ‘DPU’) for the quarter and cumulatively ₹8,743 million or ₹11.33 per unit for
      1H FY2021, representing a 100% payout ratio for both the periods
•     Balance sheet remains strong, with ample liquidity and low leverage of 16% Net Debt to TEV; existing cash and undrawn commitments total
      ₹12.2 billion, and less than 1% of total debt maturing prior to FY2022
•     Successfully raised listed debentures of ₹15 billion at an average 6.98 % quarterly coupon; utilized towards financing recent acquisition of
      Embassy Manyata and Embassy TechZone property maintenance, refinancing existing debt, construction development and for general
      corporate purposes
Business Highlights
•     Rental collections for 2Q FY2021 from office occupiers remained strong at 99.5%, in-line with office rental collections of 99.7% for 1Q FY2021
      (as of October 30, 2020)
•     Portfolio occupancy at 91.7% on our 26.2 msf operating portfolio, with same-store occupancy of 93.4%
•     New leases and renewals signed for 2Q FY2021 stood at 210k sf, including 124k sf of new leases at 10% above market rents; YTD new leases
      and renewals stand at 735k sf, including 410k sf of renewals at 17% spread to existing rents
•     Achieved rental increases of 11% on 1.9 msf in 2Q FY2021 across 18 office leases, with YTD rental increases of 12% on 3.7 msf across 40
      office leases
                                                                                                                                                2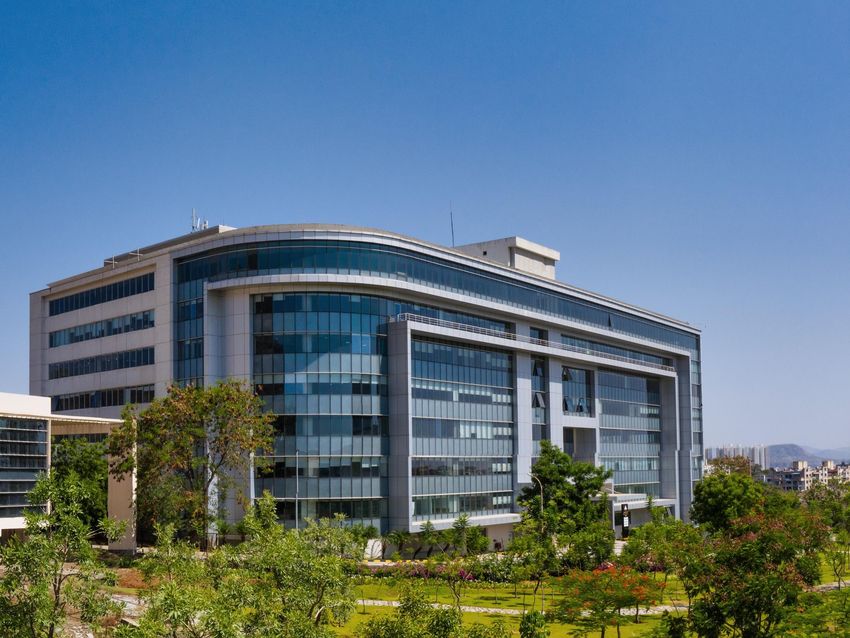
2Q FY2021 Earnings Materials

Press Release (Cont’d)
Business Continuity Update
•     All our properties across India continue to remain open and over 95% of our occupiers and over 16,600 employees operated from our
      properties in October 2020, compared to 8,500 employees during 1Q FY2021
•     Continued support to our occupiers as they re-populate their offices; launched #OfficeAgain campaign to engage and update employees on
      various health and safety initiatives
•     Purchased property maintenance operations for 20.3 msf existing REIT properties for ₹4.74 billion to further enhance service delivery to
      occupiers, with proforma accretion of 2.3% to NOI and 0.5% to DPU
•     Construction work continues across 2.7 msf ongoing development within existing campuses; labour ramp-up at site now at 85% of peak
      capacity
Other Updates
•     Received the British Safety Council’s global benchmark certification for health and safety practices implemented in controlling the spread of
      COVID-19 across our pan India office portfolio
•     Received the British Standards Institution’s assurance certificate on our Environmental, Social & Governance (ESG) processes for FY2019-20
      per Global Reporting Initiative (GRI) framework
•     Included in FTSE EPRA NAREIT Global Emerging Index and in the S&P Global Property Index and S&P Global REIT Index effective
      September 21, 2020 and November 2, 2020 respectively

Investor Materials and Quarterly Investor Call Details
Embassy REIT has released a package of information on the quarterly results and performance, that includes (i) reviewed condensed standalone
and reviewed condensed consolidated financial statements for the quarter ended September 30, 2020, (ii) an earnings presentation covering 2Q
FY2021 results, and (iii) supplemental operating and financial data book that is in line with leading reporting practices across global REITs. All these
materials are available in the Investor Relations section of the REIT’s website at ir.embassyofficeparks.com
Embassy REIT will host a conference call on November 2, 2020 at 18:30 hours Indian Standard Time to discuss the 2Q FY2021 results. A replay of
the call will be available till November 16, 2020 on the Investor Relations section of the REIT’s website at ir.embassyofficeparks.com

About Embassy REIT
Embassy Office Parks is India’s first publicly listed Real Estate Investment Trust (REIT). Listed in April 2019, Embassy REIT owns and operates a
33.3 million square feet (msf) portfolio of seven infrastructure-like office parks and four city-centre office buildings in India’s best performing office
markets of Bengaluru, Mumbai, Pune, and the National Capital Region (NCR). Embassy REIT’s portfolio comprises 26.2 msf completed operating
area, has an occupancy of 91.7% as of September 30, 2020, and is home to many of the world’s leading companies as occupiers. The portfolio also
comprises strategic amenities, including two operational business hotels, two under-construction hotels, and a 100MW solar park supplying
renewable energy to park occupiers.
                                                                                                                                                   3
2Q FY2021 Earnings Materials

Table of Contents
 I.            Key Highlights             5

 II.           Overview                   10

 III.          Market Outlook             19

 IV.           Navigating COVID-19        24

 V.            Commercial Office Update   27

 VI.           Development Update         32

 VII.          Asset Management Update    35

 VIII.         Financial Update           40

 IX.           Looking Ahead              45

 X.            Appendix                   48

                                               4
2Q FY2021 Earnings Materials

I. Key Highlights

Embassy Manyata, Bengaluru

2Q FY2021 Earnings Materials
I. Key Highlights
Business Highlights
REIT’s operating performance continued to be resilient in Q2 with stable occupancy at 91.7%, robust
rental collections of 99.5% and rental increases of 11% on 1.9 msf office leases
All properties open for business throughout lockdown with complete on-ground support
Business Continuity Instituted safety measures in-line with global best practices, received health & safety certifications
during COVID-19 Continued support to occupiers as they re-populate offices, including launch of #OfficeAgain campaign
‒ ~95% of occupiers and ~17k employees operating from our properties in Oct’2020
210k sf leases signed during Q2 across 7 deals with active lease pipeline of 265k sf
‒ 124k sf of new leases at 10% above market rents, 86k sf expiries renewed at 7% MTM spreads
Leasing and Lease Maintained healthy occupancy of 91.7% on 26.2 msf operating office portfolio
Management ‒ Same-store occupancy of 93.4% on 24.8 msf (September 2019 as base period)
► Achieved 11% rental escalations on 18 office leases of 1.9 msf during Q2 (12% on 3.7 msf for 1H)
► Backfilled or renewed 0.5 msf YTD or 3% of annual rents at 13% MTM spreads
Pickup in construction activity on 2.7 msf on-campus development, labor ramp-up at 85% peak capacity
Infrastructure and amenity upgrade initiatives across portfolio
Development
‒ Flyover, 619 key Hilton hotels and master-plan upgrade underway at Embassy Manyata, Bengaluru
‒ Comprehensive asset re-positioning launched at Embassy Quadron, Pune
Purchased property mgmt. operations for 20.3 msf, proforma accretion of 2.3% to NOI and 0.5% to DPU
Collected 99.5% of Q2 office rentals in-line with office rental collections of 99.7% in Q1
Asset Management
Occupancy at both operational hotels significantly impacted due to COVID-19 related travel restrictions
Instituted cost savings programme across operating, hospitality and corporate overhead areas
6
2Q FY2021 Earnings Materials
I. Key Highlights
Financial Highlights 2Q FY2021
NOI and EBITDA for Q2 up 10% and 13% respectively year-on-year with NOI margin at 89%.
Distributions for Q2 stood at ₹4,244 mn
2Q FY2021 2Q FY2020
Variance % Remarks
(mn) (mn)
Revenue Contracted lease escalations on 7.5 msf
from ₹5,401 ₹5,206 +4% 60% pre-commitments in 1.4 msf new completions
Operations Decrease in hotel revenues due to COVID-19 impact(2)
NOI ₹4,814 ₹4,384 Increase in Revenue from Operations
+10% Savings due to cost control initiatives
Margin (%) 89% 84% Lower hotel, power & fuel expenses
EBITDA ₹4,730 ₹4,194 Increase in NOI
+13% Interest income on purchase consideration advanced for
Margin (%) 88% 81% Embassy Manyata M3 Block B
Distribution ₹4,244 ₹4,630 Distributions of ₹4,244 mn or ₹5.50 per unit for 2Q FY2021
(8%) ‒ Represents payout ratio of 100% of NDCF at REIT level
Payout ratio 100% 99.3%
Notes:
(1) Above financial results exclude Revenue, NOI and EBITDA from Embassy GolfLinks since Embassy REIT owns 50% economic interest in GLSP. GLSP NOI in 2Q FY2021 was up 11% year-on-year 7
(2) Both operational hotels were temporarily closed in accordance with state government guidelines given COVID-19 lock-down and subsequently reopened in mid June 2020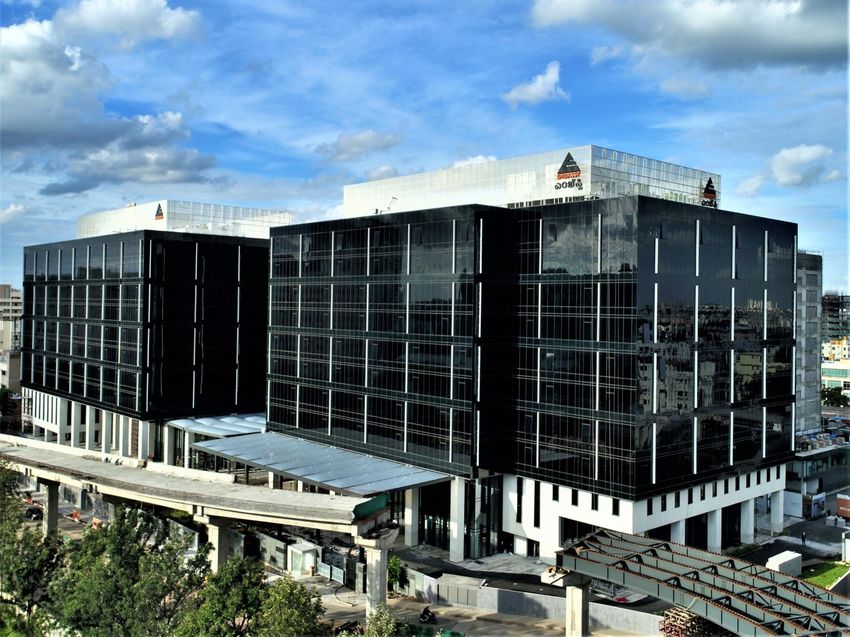
2Q FY2021 Earnings Materials
I. Key Highlights
Financial Highlights 1H FY2021
NOI and EBITDA for 1H FY2021 up 5% and 8% year-on-year respectively. Distribution for H1 stood at
₹8,743 mn, broadly in-line with 1H FY2020
1H FY2021 1H FY2020
Variance % Remarks
(mn) (mn)
Contracted lease escalations on 7.9 msf
Revenue 60% pre-commitments in 1.4 msf new completions
from ₹10,564 ₹10,557 - Decrease in hotel revenues due to COVID-19 impact(2)
Operations One-off items(3) in PY; adjusted for these one-off items,
Revenue for 1H FY2021 was higher by 3% vs. 1H FY2020
NOI ₹9,383 ₹8,912 Savings due to cost control initiatives
+5%
Lower hotel, power & fuel expenses
Margin (%) 89% 84%
EBITDA ₹9,237 ₹8,563 Increase in NOI
+8% Interest Income on purchase consideration advanced for
Margin (%) 87% 81% Embassy Manyata M3 Block B
Distribution ₹8,743 ₹8,797 Distributions of ₹8,743 mn or ₹11.33 per unit for 1H FY2021
(0.6%)
‒ Represents payout ratio of 100% of NDCF at REIT level
Payout ratio 100% 99.5%
Notes:
(1) Above financial results exclude Revenue, NOI and EBITDA from Embassy GolfLinks since Embassy REIT owns 50% economic interest in GLSP. GLSP NOI in 1H FY2021 was up 6% year-on-year 8
(2) Both operational hotels were temporarily closed in accordance with state government guidelines given COVID-19 lock-down and subsequently reopened in mid June 2020
(3) One-time surrender premium of ₹300 mn received from an occupier of Embassy TechZone during 1H FY2020
2Q FY2021 Earnings Materials
I. Key Highlights

Distribution Overview
 Distribution for Q2 stood at ₹4,244 mn i.e. ₹5.50 per unit representing a 100% payout ratio. Scheduled
 payment date is on or before November 17, 2020

 Particulars                                                  2Q FY2021                    1H FY2021

 Distribution period                                        Jul'20 – Sep'20              Apr'20 – Sep'20

 Distribution amount (mn)                                       ₹4,244                       ₹8,743

 Outstanding units (mn)                                           772                         772

 Distribution per unit                                           ₹5.50                       ₹11.33

  - Interest                                                    ₹1.90                        ₹4.04

  - Dividend                                                    ₹0.42                        ₹0.78

  - Amortization of SPV level debt                              ₹3.18                        ₹6.51

 Announcement date                                         November 2, 2020                     -

 Record date                                              November 10, 2020                     -

 Payment date                                        On or before November 17, 2020             -

       Embassy REIT is committed to regular quarterly distribution to Unitholders with minimum 90% of Net
                             Distributable Cash Flows (‘NDCF’) to be distributed

                                                                                                            9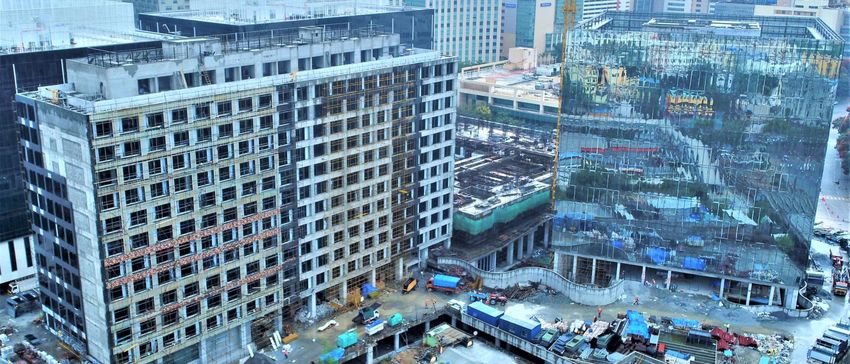
2Q FY2021 Earnings Materials

II. Overview

Express Towers, Mumbai
2Q FY2021 Earnings Materials
II. Overview

Who We Are: Quick Facts
  We run a commercial office portfolio that serves as essential corporate infrastructure to global
  occupiers, including many Fortune 500 corporations

       33.3 msf(1)                                     160+                                    91.7%
            Portfolio                               Blue-chip                               Occupancy
                                                    occupiers

                11                                   1,096(1)                               100 MW                                                                             NCR (9%)

        Commercial                                  Hotel Keys                               Solar Park
          Offices

             28%                                        48%                               6.5 Years                                                   Mumbai (14%)

     Mark-to-Market                              Gross Rents                                     WALE                                                    Pune (13%)
        Upside                                  from Fortune
                                                500 occupiers

                                                                                                                                                                                   Bengaluru (64%)

   ₹10,564 mn                                   ₹8,743 mn                                        16%
       1H FY2021                                   1H FY2021                                Net Debt to
      Revenue from                                 Distribution                                TEV
       Operations
Notes: City wise split by % of GAV per September 2020 valuation by independent valuer. Valuation exercise undertaken semi -annually. For further details refer notes on slide 54
(1)   Includes completed, under construction and proposed future development                                                                                                                         11
2Q FY2021 Earnings Materials II. Overview Seven Infrastructure-like Office Parks (31 msf)(1) Embassy Manyata Embassy Quadron Bengaluru (14.8 msf) Pune (1.9 msf) Embassy GolfLinks Embassy TechZone Bengaluru (2.7 msf) Pune (5.5 msf) Embassy Oxygen Embassy Galaxy Embassy Qubix Noida (3.3 msf) Noida (1.4 msf) Pune (1.5 msf) Note: (1) Includes completed, under construction and proposed future development 12
2Q FY2021 Earnings Materials
II. Overview

Four Prime City-center Offices (2.3 msf)
Express Towers                 FIFC
Mumbai (0.5 msf)               Mumbai (0.4 msf)

                               Embassy 247        Embassy One
                               Mumbai (1.2 msf)   Bengaluru (0.3 msf)

                                                                        13
2Q FY2021 Earnings Materials
II. Overview
What We Do: Our Strategy
Maximize distribution and NAV per unit through organic growth and new acquisitions
4
Capital
Management
3
Acquisitions Build leverage
2 selectively
On-campus Use strong balance
Capitalize on
1 Development sheet to drive accretive
fragmented office
growth through
market and undertake
Leasing Deliver 7.1 msf on-
disciplined acquisitions
value accretive
campus development acquisitions Quarterly distribution
with minimum 90% of
Grow NOI by leasing Proactive pre-leasing to Pan-India acquisition
NDCF to be distributed
existing vacancy de-risk new potential from 3rd parties
development Low expenses and fees
Manage lease expiries 43.2 msf of ROFO
Select infrastructure
enhancing Unitholders’
& capture mark-to- opportunity from
ancillary projects value
market upside Embassy Sponsor
(hotels, flyovers etc.) to
Experienced on-ground increase entry barriers
teams & hands-on
approach to leasing Provide ‘total business
ecosystem’
Best-in-class occupier
engagement
Proactive asset management to drive value with strong corporate governance
142Q FY2021 Earnings Materials
II. Overview
Our Opportunity: India as the Global Technology Innovation Hub
India continues to attract global technology companies due to availability of highly educated and
skilled talent at a reasonable cost
India Advantage FY2020 Performance(2) Evolving Technology Landscape
India leads in STEM(1)
$191 bn Services
(7.7% growth) • Information Technology • Engineering R&D
talent for technology
Talent assignments • BPM • Digital and Media
Availability Revenue
Over 2 million(2) students
graduating each year
$147 bn
(8.1% growth) Software
• Systems • Cybersecurity
Employee cost in India is
around 20-25% of Exports • Enterprise • Fintech / Edtech
Cost
Advantage comparable costs in
occupier’s country of
origin(3)
$44 bn
eCommerce / Omni Channel Retail
(7.3% growth)
• Social Shopping • Intelligence
India is one of the most Domestic • Voice Commerce • Digital Payments
affordable office markets Revenue
globally
Affordable
‒ Average rentals of $1
Rentals 4.4 mn
psf / month(3) Technologies
(4.9% growth) • Cloud / Robotics • Blockchain
Rental costs merely 2-6%
of occupier revenues(3) • Intelligent Automation • Reality AR / VR
Employees
Notes:
(1) STEM refers to Science, Technology, Engineering, Mathematics 15
(2) Source: NASSCOM - The Technology Sector in India: Strategic Review 2020 (Techade – the new decade)
(3) Source: CBRE Research, ICICI Securities Research, Embassy REIT2Q FY2021 Earnings Materials
II. Overview
Our Opportunity: Technology Sector Resiliency and Growth
COVID-19 response has accelerated digital transformation and technology spends globally. Increased
costs and scaling pressures likely to further increase offshoring to India
Digital Tech spends to witness exponential growth GCCs expected to expand similar to post GFC
Global Digital Transformation Spends (USD Bn)(1) Number of GCCs in India(2)
1,400
1,250
879 1,182
789
981
647
506
620
413
337
285
2020E 2021E 2022E 2023E 2024E 2025E Pre-FY2000 FY2005 FY2010 FY2015 FY2019 FY2020
Strong performance by global and Indian technology businesses throughout COVID-19 pandemic, resulting in
‒ Acceleration of digital transformation globally, and
‒ Bring-forward of technology spends, especially for cloud, digital, data services and cyber security
Indian IT industry expected to grow at a 13% CAGR to $350 billion by 2025 (2), given
‒ Focus on Business Continuity Plan (BCP) and increased cost pressures on global businesses
‒ Similar trend witnessed post 2008 Global Financial Crisis (GFC) with record number of GCCs set-up in India
Source:
(1) Morgan Stanley Global Insights, ‘Stronger for Longer in Digital Transformation, Sept 2020’ 16
(2) NASSCOM Research, C&W Research2Q FY2021 Earnings Materials
II. Overview
Our Occupier Base
Global business with a diversified, resilient and high credit-quality occupier base. Top occupiers have
an average market cap of US$ 203 bn(1)
Industry Diversification(2) 42% of Gross Rentals From Top 10 Occupiers
Financial Top 10 % of
Services Sector
Technology Occupiers Rentals
12%
50%
Global Technology &
Technology 12%
Consulting Major
J.P. Morgan Cognizant Technology 9%
Others
11%
NTT Data Technology 4%
NOKIA
ANSR Research & Analytics 3%
Facebook
Cerner Healthcare 3%
Research,
Consulting & PwC Research & Analytics 3%
MetLife Analytics
PwC
10% Google India Technology 2%
NTT DATA
NOKIA Telecom 2%
Retail
6% JP Morgan Financial Services 2%
Healthcare Lowe’s Retail 2%
Telecom 6%
5%
Total 42%
Notes: Actual legal entity names of occupiers may differ
(1) Source: Bloomberg as of September 30, 2020, Embassy REIT. Assessment undertaken for listed occupiers 17
(2) Represents industry diversification percentages based on Embassy REIT’s share of gross rentals2Q FY2021 Earnings Materials
II. Overview
Our Portfolio: Commercial Office-focused
Predominantly an office REIT with commercial office segment contributing to 92% of Portfolio Value
and 95% of Net Operating Income
Contribution by Gross Asset Value Contribution by Net Operating Income
Others Others
8% 5%
₹337,366 mn ₹9,383 mn
Gross Asset Value Net Operating Income
September 2020(1) 1H FY2021(2)
Commercial Commercial
Office Office
92% 95%
26.2 msf completed best in-class Grade A Office properties (91.7% occupied, 6.5 years WALE)
Notes:
(1) GAV per September 2020 valuation by independent valuer. Valuation exercise undertaken semi-annually. For further details refer notes on slide 54 18
(2) Excludes Embassy GolfLinks given Embassy REIT owns 50% economic interest in GLSP
(3) Others includes hospitality and solar park2Q FY2021 Earnings Materials III. Market Outlook FIFC, Mumbai
2Q FY2021 Earnings Materials
III. Market Outlook
Market Fundamentals – 3Q CY2020 Update
CY2019 was a record year for India office market with 61 msf gross absorption and ~6% vacancies in
our core markets. However, market absorption in 2020 is impacted due to COVID-19 outbreak
Absorption Trends over last 5 years City-wise Performance – 3Q CY2020 YTD
Absorption(2) Supply Vacancy
60.8
Average Absorption 49.3 msf
City (msf) (msf) (%)
48.9 Bengaluru 7.1 7.5 7%
45.8 46.1 47.2
44.8
Pune 2.8 3.2 11%
39.7
35.1 Mumbai 2.2 3.1 22%
33.8
29.3 30.8 NCR 3.7 6.4 26%
24.6 Embassy REIT Markets 15.9 20.2 17%
Hyderabad 4.7 6.6 13%
18.9 Chennai 3.5 3.7 11%
16.9 15.0 16.4
14.4 14.0
Kolkata 0.5 0.3 36%
Other Markets 8.7 10.6 16%
CY2015 CY2016 CY2017 CY2018 CY2019 3Q CY2020
Grand Total 24.6 30.8 16%
Supply (msf) Gross Absorption (msf) Vacancy (%)
CY2019 Wrap-up
‒ Record year for India office - 31%(1) higher absorption, significant announced supply and ~ 6% vacancy for core REIT
markets
3Q CY2020 YTD Highlights
‒ Notable recovery in office demand with absorption in 3Q CY2020 higher compared to 2Q CY2020
‒ Occupiers adopted ‘pause, assess, accelerate’ in decision making, pre-leasing activity resumed in Bengaluru
‒ Tech sector continues to drive momentum (38% of YTD absorption)
Source: CBRE Research, Embassy REIT
Notes: 20
(1) Based on average annual gross absorption from CY2015 to CY2018
(2) Represents gross absorption figures2Q FY2021 Earnings Materials
III. Market Outlook
Market Fundamentals – Demand Trends
Q2 witnessed early signs of pick-up in leasing activity post the pause in decision making in Q1. High-
quality properties to benefit from supply shrinkage and increased offshoring and technology spends
Proforma Demand Analysis Demand Trends
Gross Absorption (msf) Short-term Outlook
Pre COVID-19 Post COVID-19 ‒ Limited impact on existing leases in Grade A properties
‒ Demand softening as occupiers defer decision-making
‒ Low quality stock under intense pressure
YTD Absorption till 3Q CY2020: 24.6 msf Medium-term Outlook
49.3
‒ Focus on ‘Return to Workplace’
40.4 ‒ Evolving themes like WFH, de-densification, wellness,
industry consolidation and flight to quality
35.3 29.6
‒ Increased technology spends to support new lifestyles
‒ Re-planning of space needs and portfolio optimization
‒ India office demand well placed for 2021 and beyond
given talent pool, cost advantage & depreciating rupee
Portfolio Implications
‒ Low lease-up risk given healthy 90%+ portfolio occupancy
‒ Limited impact on existing portfolio given asset quality,
Last 5 Years CY2020F CY2020F 40% lower of
long WALE, below market rents and occupier stickiness
Average C&W Estimate CBRE Estimate Last 5 Years
Average ‒ No risk on 20+ msf contracted escalations in next 3 years
Illustrative
Scenario 1 Scenario 2 Scenario 3 ‒ Industry consolidation and stronger preference to high-
Outcomes
quality, wellness-oriented properties to drive demand
Source: CBRE Research, C&W Research, Embassy REIT
212Q FY2021 Earnings Materials
III. Market Outlook
Market Fundamentals – Supply Trends
Considerable supply shrinkage of over 29% since Jan’20 per CBRE, supply expected to further
decline. Comparable and competing supply for REIT properties likely to be significantly lower
Supply Trends
Comparable and competing 12 msf
supply in REIT Markets (~10%) Short-term Outlook
‒ Sharp drop in supply due to COVID-19 disruptions in
(4Q 2020 – 3Q 2022) ~ 122 msf announced supply
labor, material supply and financing availability
‒ Institutional landlords continue to pour concrete for short-
Proforma Supply Analysis (pre-COVID)
term completions
Non-comparable or unrealistic 37 msf
supply in REIT Markets ‒ High construction and delivery slippages
(~30%)
Medium-term Outlook
‒ Dramatic liquidity squeeze to disrupt new projects, only
well-funded developers to complete projects
Pre-committed Supply 7 msf
in REIT Markets (~6%) ‒ CBRE’s 2-year forward supply estimate has decreased
from 122 msf in Jan’20 to 87 msf in Sep’20, a 29% decline
in 3 quarters
‒ Supply recovery likely to significantly lag demand recovery
Supply in Non-REIT Markets 31 msf
(~25%) Portfolio Implications
‒ Comparable & competing supply for REIT is significantly
lower at 10% of announced supply for next 2 years
‒ REIT has no near-term new supply, earliest delivery for
our 2.7 msf on-campus developments is from June 2022
COVID-19 Impacted Supply 35 msf ‒ All new developments are part of our existing campuses,
per CBRE estimate (~29%) REIT’s liquidity to help labour and financing availability
‒ REIT has the ability to cover time delays and flexibility to
control supply timing
Source: CBRE Research, Embassy REIT
Note: Comparable and competing supply has been arrived factoring supply considerations including city, micro-markets, location, project completion timing, quality etc. 222Q FY2021 Earnings Materials
III. Market Outlook
Evolution of Workplace
Office to emerge as the core business hub providing better quality, lower density spaces with high
standards of safety and security, favoring institutional landlords like Embassy REIT
Flexible Work Styles De-densification
Physical office remains a necessity Majority occupiers actively working on re-occupancy plans
WFH challenges, especially for young tech demographic Social distancing now an imperative at the workplace
‒ Physical and digital infrastructure at home Space per person to increase, reversing densification
‒ Softer aspects of career, learning and culture trends over last 2 decades
Workplace density estimated to reduce by over 20%
Many functions require office spaces for social interaction,
client engagement and collaboration ‒ Per C&W Research, per person space requirement to
More flexibility - hybrid of traditional offices & home working go up from 60-70 sf (pre COVID) to 100-120 sf
Flight to Quality Market Consolidation
Employee safety a key priority for companies Occupiers prefer locations with access to large talent pools
Increased emphasis on health & wellness, sustainability Skilled young STEM talent typically favours urban living and
and environmental management seek vibrant, collaborative, creative environments
Focus on recovery readiness & operational best practices Significant supply delays and slippages likely
Greater demand for ‘Total Business Ecosystem’ product ‒ Material, labor and financing challenges
‒ High-quality, accessible, safe & sustainable Indian Strong preference for institutionally held properties with
offices owned by institutional landlords access to liquidity, leading to market consolidation
Large-scale, safe and sustainable properties like Embassy REIT to emerge as ‘Next Generation Workplaces’
232Q FY2021 Earnings Materials
IV. Navigating
COVID-19
Embassy One, Bengaluru2Q FY2021 Earnings Materials
IV. Navigating COVID-19
Facilitating Safe Return to Workplace
Extensively engaged with occupiers to facilitate employee safety, business continuity during COVID-
19 and support their ‘Return to Workplace’ efforts
Embassy REITs ‘COVID-19 Secure’ Plan
Employee Safety Communications Return to Workplace
Enhanced Property Sanitization Daily Communication Updates Occupiers Lockdown Exit Plan
International-standard deep cleaning Transparent & proactive engagement ~95% occupiers continued to operate
and fumigation in all buildings(1) Daily pan-India and property-specific core business functions
Ancillary staff training and PPE updates to occupiers Engaged with occupiers for both
workplace & workforce readiness
Advanced Tech Safety Solutions Emergency Response Protocols
Installation of thermal cameras SOP in place for immediate alert and ‘COVID-19 Secure’ Initiative
Touchless visitor management response to possible exposure Shared ‘Back to Office’ playbook for
and/or a confirmed case smooth return to offices by occupiers
Advanced air filtration
Reaching out to Employees Post COVID Space Readiness
Social Distancing Protocols
Friendly reminders and guidelines Building enhancement initiatives
Social distancing measures in posted throughout the properties
elevators, entry points, food courts Support occupiers in their interior
and walkways Dedicated COVD-19 website construction and space re-modelling
100% 1000+ ~95% ~17k
Business parks and buildings CRE touchpoints for daily Occupiers operating from our Employees working from our
operational(2) property-specific updates properties across India(3) properties across India(3)
Notes:
(1) As per the guidelines provided by WHO, MHA and MoHFW 25
(2) Our properties remained open throughout the lockdown period and complied with all government regulations to support business continuity of our occupiers
(3) Data basis mid week average for October 20202Q FY2021 Earnings Materials
IV. Navigating COVID-19
Facilitating Safe Return to Workplace (Cont’d)
Launched #OfficeAgain campaign to update occupiers on various health and safety initiatives.
Received health, safety and ESG assurance certifications from globally renowned institutions
#OfficeAgain Campaign Ramp-up in employees at our properties
Launched #OfficeAgain campaign to engage and update 16,600
occupiers on various health and safety initiatives
‒ Campaign trended #3 on Twitter in India in mid 8,500
September 2020
‒ ‘Return to Workplace’ video, part of the campaign,
generated over 275k views
Link: http://bit.ly/EmbassyREIT-OfficeAgain
1Q FY2021 October 2020
262Q FY2021 Earnings Materials V. Commercial Office Update Embassy Quadron, Pune
2Q FY2021 Earnings Materials
V. Commercial Office Update

Leasing Highlights for 2Q FY2021
 210k sf leases signed across 7 deals in Q2 despite COVID-19 disruptions, includes 124k sf new leases
 at 10% above market rents and 86k sf renewals at 7% MTM spreads
                              2Q FY2021 Highlights                                                New Leases Signed
New Leases signed (‘000 sf)                                      124   Occupier        Property         Sector                        Area ('000 sf)

                                                                       Indian Technology
  ‒ Existing Occupier Expansion                                  36%                     Embassy Manyata Technology                        44
                                                                       Major

Releasing (‘000 sf)                                              80    Mitel           Embassy Manyata Telecom                             44

  ‒ Re-leasing Spread                                            12%
                                                                       ATC Tires       Embassy 247      Engineering & Manufacturing        36

Renewals (‘000 sf)                                               86    Total                                                               124

  ‒ Renewal Spread                                               7%

Pipeline discussions (‘000 sf)                                   265

New Leases & Renewals in 2Q FY2021

                                                                                                                        DHL

                                          Mitel                                                    ATC Tires
Notes:
(1)    New leases signed includes re-leases, excludes renewals                                                                              28
(2)    Actual legal entity names of occupiers may differ
2Q FY2021 Earnings Materials
V. Commercial Office Update
Leasing Performance Across Years
Maintained healthy occupancy of 91.7% as of September 2020 on 26.2 msf operating office portfolio
with same-store occupancy of 93.4%(1)
Particulars 1H FY2021 Average FY2020 FY2019 FY2018 FY2017
Completed Area msf 26.2 (FY2017-20) 26.2 24.8 24.2 23.1
Occupancy % 91.7% 93.8% 92.8% 94.3% 93.5% 94.7%
New Leases Signed(2) msf 0.3 1.8 2.4 1.8 1.3 1.9
Re-Leasing msf 0.2 1.0 1.1 1.2 0.5 1.1
Re-Leasing Spread % 17% 47% 53% 35% 35% 61%
Existing Occupier Expansion % 64% 62% 71% 59% 69% 50%
Renewals msf 0.4 1.5 0.6 0.9 2.9 1.6
1.8 msf average new leases signed between FY2017-20 47% Average re-leasing spread between FY2017-20
2.4 61%
53%
1.9 1.8
1.3 35% 35%
17%
0.3
FY2017 FY2018 FY2019 FY2020 1H FY2021 FY2017 FY2018 FY2019 FY2020 1H FY2021
Re-Leased
Area (msf) 1.1 0.5 1.2 1.1 0.2
Area (msf)
Notes:
(1) Computed basis 24.8 msf operating area (September 2019 as base period) 29
(2) New leases signed includes re-leases, excludes renewals2Q FY2021 Earnings Materials
V. Commercial Office Update
Embedded Rental Escalations
Achieved rental increases of 11% on 1.9 msf across 18 leases in Q2 (achieved 12% rental increases on
3.7 msf YTD). On track to deliver 13% rental escalations due on 3.4 msf across 38 leases in H2
Market rents are 28% above in-place rents Embedded lease escalations of 10-15% aids NOI growth
Rent (₹ psf / month) Area (msf) No. of Occupiers
55 64 68 51 51
7.1
89
6.4
6.1
5.5
4.8
70
FY2020 FY2021 FY2022 FY2023 FY2024
Rental
13.6% 14.0% 14.4% 12.3%
Escalations
Post-escalation
32.1% 13.2% 9.3% 33.4%
MTM opportunity
In-place Rents Market Rents(1)
2Q FY2021 Update: Achieved 11% rental increases on 1.9 msf
Source:
(1) CBRE Research, Embassy REIT 302Q FY2021 Earnings Materials
V. Commercial Office Update
Embedded Mark-to-Market Growth
Of 1.9 msf lease expiries in FY2021, successfully backfilled 0.5 msf in H1 at 13% MTM spreads. Of the
balance, 1.2 msf leases representing 5.6% of annual rents are likely exits with 16% MTM potential
25% of leases expire between FY2021–24 FY2021 Leases Expiries status as of date
Area Expiring (msf) 0.5 msf already backfilled/ renewed
Likely Renewals Renewal / Re-lease
at 13% re-leasing spreads
0.2 msf Completed
1.0% of Rents(1) 0.5 msf
MTM 2.1% 4.0% of Rents(1)
Average Lease Expiries 3.0 MTM 13%
~ 6.4% of rents (achieved)
FY2021
Expiries
1.9
19%
MTM
1.2 1.2 msf
1.1 1.1
5.6% of Rents(1)
MTM 15.9%
Likely Exits
FY2020 FY2021 FY2022 FY2023 FY2024
0.5 msf backfilled at 13% MTM spreads to 23 occupiers
Mark-to-market 0.2 msf expiries not yet due and are likely renewals
5% 58% 37% 18%
opportunity
1.2 msf likely exits in FY2021 - ‘business as usual’ churn &
certain COVID-19 induced occupier exits
Rents Expiring 6.6% 4.5% 8.6% 6.2%
1.0 msf avg annual backfill achieved in previous 4 years
Note:
(1) Refers to annualized rental obligations 312Q FY2021 Earnings Materials
VI. Development
Update
Embassy Manyata, Bengaluru2Q FY2021 Earnings Materials
VI. Development Update
Development Pipeline
Pickup in construction activity for 2.7 msf ongoing on-campus development projects. Encouraging
labor ramp-up along with materials and financing availability to help meet project timelines
Development Pipeline(1) (msf) Development Status as of November 2, 2020
Area Upcoming (msf)
Construction work continuing at pace
2.4
Labor gradually ramping up at all sites,
to date achieved 85% of peak capacity
Construction
Update Implemented numerous measures for
health and safety of workers at site
Occupiers carrying fit-out works for 820k
0.9 sf in recently delivered buildings
Embassy Manyata M3 Block A – Sub-structure works in
advanced stage; structural steel works
M3 Parcel in basements underway.
0.7
(Block A – 1.0 msf) Targeting Dec’22 completion
1.5
0.6
Hudson Block – Design, excavation &
1.0
sub-structure works completed; super
0.8
Embassy TechZone structure work initiated
0.6
0.5 (Hudson, 0.5 msf) Ganges Block – Design & excavation
(Ganges, 0.4 msf) completed; sub-structure work
(2) underway
FY2019 FY2020 FY2023 FY2024 Post FY2024
Targeting Jun’22 completion
Embassy Manyata Embassy Oxygen Embassy TechZone
Design completed; excavation and pre-
Embassy Oxygen construction works initiated
1.4 msf new deliveries in FY2020 are 60% committed (Tower 1, 0.7 msf)
No near-term new supply until June 2022 Targeting Mar’23 completion
Notes:
(1) Excludes 619 hotel keys across Hilton & Hilton Garden Inn at Embassy Manyata due for delivery in June 2022 33
(2) Includes acquisition of 0.6 msf M3 Block B located within overall Embassy Manyata upon building completion in September 20232Q FY2021 Earnings Materials
VI. Development Update
Under Development Projects
2.7 msf on-campus projects in early stages of development cycle with earliest delivery in June 2022.
REIT has the ability to cover time delays and flexibility to control supply timing
Embassy Manyata – M3 Block A (1.0 msf) Embassy TechZone – Hudson & Ganges Block (0.9 msf)
Design Perspective
Actual Progress at Site(1)
Note: October 2020 pictures
342Q FY2021 Earnings Materials
VII. Asset Management
Update
Embassy Qubix, Pune2Q FY2021 Earnings Materials
VII. Asset Management Update
Purchase of Property Maintenance (‘CAM’) Operations
Purchased at an 8.5% discount to average of 2 independent valuations. Acquisition enhances service
delivery to occupiers and consolidates CAM revenues for key REIT owned assets Bengaluru and Pune
Key Benefits
20.3 msf (2) ₹4.74 bn
Transaction
Overview
Total Area Purchase Cost Enhance Fully integrated park management
Occupier Better customer service through direct
+2.3% +0.5% Experience park management oversight
Proforma NOI Proforma DPU
Accretion(2) Accretion(2)
Consolidates CAM for key Embassy
REIT owned assets
Net Debt(3) 33% Better
49% ‒ Embassy Manyata and Embassy
Alignment TechZone
Funding
Enhances occupier connect
Debt
1% 16%
15%
Improved
Strategic opex and capex initiatives to
Capital
upgrade business ecosystem
Before Acq Debt for Acq After Acq Headroom to Regulatory Allocation
49% Cap
Brings in contracted CAM revenues for
Strong framework regulating related party transactions Stable Cash 20.3 msf(1) of existing REIT properties
Flows
‒ Dedicated REIT management team Delivers economies of scale
Process
‒ Affiliated board members abstain from approval vote
‒ Two Independent 3rd party valuations Safety in Enhanced control over park
‒ Arm’s length assessment by Grant Thornton Post COVID management amid greater occupier
world focus over safety in a COVID era
Customary transaction diligence and closing items
Notes:
(1) Includes 13.9 mn sf completed area and 6.4 mn sf U/C and Proposed Development Area 36
(2) Proforma NOI & DPU Accretion computed considering FY2021 CAM business NOI & NDCF and FY2020 Embassy REIT actual NOI & NDCF. Actual performance may differ given proforma numbers are based on estimates
(3) Net Debt % computed basis 2Q FY2021 Net Debt to GAV. Gross Asset Value (GAV) per September 2020 valuation by independent valuer. Valuation exercise undertaken semi-annually. For further details refer notes on slide 542Q FY2021 Earnings Materials
VII. Asset Management Update
Rent Collections and Rolling Renewals Update
Rental collections for 2Q FY2021 from office occupiers remained robust at 99.5%; achieved rolling
renewals of 0.9 msf across 10 leases in H1; on track to renew remaining 1.6 msf during FY2021
Robust Office Rent Collections Continued Momentum in Rolling Renewals
Area (msf) No. of Occupiers
18 19 9 14 24
Committed 4.0
Rents For quarter ended
0.5% September 30, 2020
2.5
2.2
1.9
Rents 0.9
0.6
Collected
99.5% FY2020 FY2021 FY2022 FY2023 FY2024
Office rental collections for 2Q FY2021 at (99.5% for July,
Continued momentum in rolling renewals given in-place rents
99.9% for August and 99.2% for September 2020)
are significantly below market
In-line with robust office rental collections of 99.7% for 1Q
Achieved rolling renewals on 0.9 msf during 1H representing
FY2021
4% of annual rents
No waiver granted to office occupiers. Rebate granted to food
On track for remaining 1.6 msf, or 100% of rolling renewals due
court and ancillary retail tenants, representing 1.4% of annual
in FY21
rents
Note: Rolling renewals refer to lease renewals by occupiers exercising their renewal options after the end of the initial commitment period which is typically 5 years
372Q FY2021 Earnings Materials
VII. Asset Management Update
Hospitality Update
477 key operating hotels continued to witness skeletal occupancy due to COVID-19 induced travel
disruptions. Instituted significant cost saving measures and global safety protocols for guests
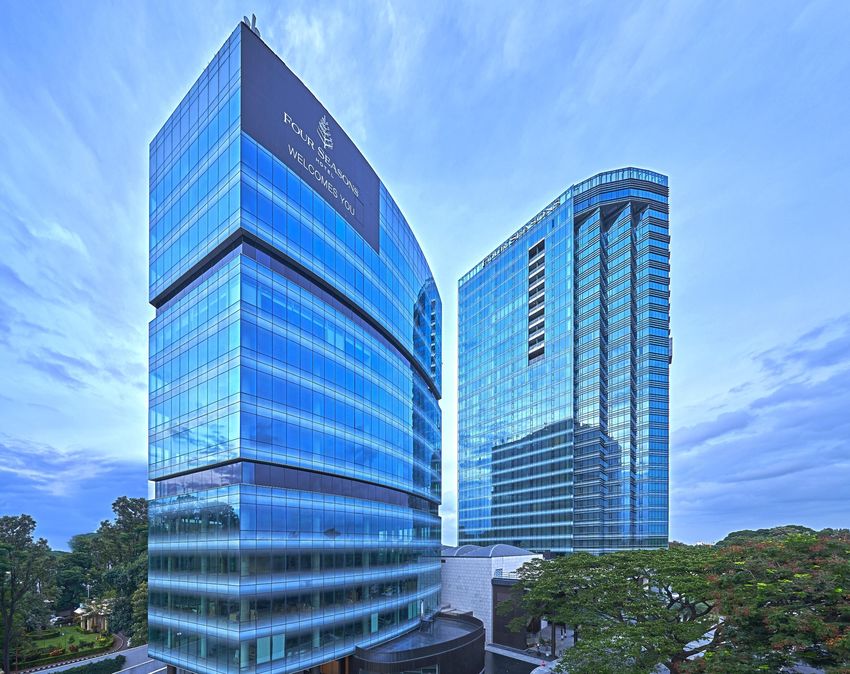
Hilton at Embassy GolfLinks Four Seasons at Embassy One Hilton Hotels at Embassy Manyata
* Perspective
247 Keys 230 Keys 619 Keys
5-Star Hotel 5-Star Luxury Hotel 5-Star & 3-Star Hotel
Operational Operational Under Construction
Q2 Occupancy : 8% Q2 Occupancy : 3% Expected completion in June 2022
Q2 EBITDA: ₹(33) mn Q2 EBITDA: ₹(61) mn 100k+ sf Retail & Convention Centre
‘Ranked #1’ ‘Best New Business Hotel’ ‘Best Hotel Architecture’
- out of 109 Hilton hotels in APAC ‒ by Travel + Leisure ‒ by Asia Pacific Property Awards
► Outlook – Hospitality demand to remain muted for remainder of financial year given COVID-19 related travel disruptions
► Action Plan – Implemented significant cost saving measures to reduce fixed and variable costs. Global safety protocols implemented
for guests, will aid in ramping up occupancy when travel opens up
Limited impact of COVID-19 induced hospitality slowdown on our portfolio given – Hotels contribute < 5% of
GAV and < 1% of pre-COVID NOI (FY2020)
382Q FY2021 Earnings Materials
VII. Asset Management Update
Infrastructure and Upgrade Projects
Construction activity fully underway for 619 key dual branded Hilton hotels at Embassy Manyata, on
track for Jun’22 launch
Hilton Garden Inn: 3-Star Hilton Hotel: 5-Star
353 keys 266 keys
► Hilton – 5 Star (266 keys) at Embassy Manyata
‒ Structure and façade completed pre-lockdown. MEP and interior works currently in progress
► Hilton Garden Inn – 3 Star (353 keys) at Embassy Manyata
‒ Structure completed pre-lockdown. Façade, MEP and interior works currently in progress
► Awarded ‘Best Hotel Architecture’ for 2020-21 by Asia Pacific Property Awards
Note: October 2020 picture
392Q FY2021 Earnings Materials VIII. Financial Update Embassy TechZone, Pune
2Q FY2021 Earnings Materials
VIII. Financial Update

Revenue Contribution by Segment and Geography
 Commercial Office segment contributed 93% of Revenues in Q2. Bengaluru, our core market, is least
 impacted due to its technology sector focus and contributed 57% of Revenues in Q2

Revenue from Operations(1)                                                                                                     ₹5,401 mn
                                                                                                                        Revenue from Operations(1)
                                                                                           2Q FY2021   % of                   (2Q FY2021)
                     Asset                                Segment                City                                 Others
                                                                                             (₹ mn)    Total
                                                                                                                       7%
Embassy Manyata                                    Commercial Office           Bengaluru     2,690     50%

Express Towers                                     Commercial Office           Mumbai         350       6%

Embassy Oxygen                                     Commercial Office            Noida         352       7%
                                                                                                                               Contribution by
Embassy TechZone                                   Commercial Office             Pune         320       6%                       Segment

Embassy Quadron                                    Commercial Office             Pune         278       5%

FIFC                                               Commercial Office           Mumbai         260       5%                                       Commercial
                                                                                                                                                   Office
Embassy 247                                        Commercial Office           Mumbai         334       6%
                                                                                                                                                   93%
Embassy Qubix                                      Commercial Office             Pune         228       4%              NCR (Noida)
Embassy Galaxy                                     Commercial Office            Noida         197       4%                 10%

Embassy One                                        Commercial Office           Bengaluru       8        0%
                                                                                                               Pune
Hilton at Embassy GolfLinks                                 Others             Bengaluru      15        0%
                                                                                                               15%
Four Seasons at Embassy One                                 Others             Bengaluru      15        0%
                                                                                                                               Contribution by
Embassy Energy                                              Others             Bengaluru      355       7%                       Geography

Revenue From Operations                                                                      5,401     100%

Portfolio Investment(2)                                                                                        Mumbai                                Bengaluru
                                                                                                                18%                                    57%
Embassy GolfLinks                                  Commercial Office           Bengaluru     1,005

Notes:
(1)    Revenue from Operations does not include contribution from GLSP                                                                               41
(2)    Amount represents 100% of GLSP. Embassy REIT owns a 50% stake in GLSP
2Q FY2021 Earnings Materials
VIII. Financial Update
Strong Balance Sheet with Ample Liquidity
At 16% Net Debt to TEV, our conservative Balance Sheet provides significant flexibility to weather
near-term COVID-19 impact and pursue accretive growth opportunities
Total Enterprise Value (‘TEV’)
Net Debt to TEV(1)
Particulars (₹ mn) September 30, 2020
Net Debt
Gross Asset Value (GAV)(2,3) 337,366 ₹51,799
16%
Add: Other Assets 67,060
Less: Other Liabilities (54,199)
As of Sep’20
Less: Gross Debt (60,838)
Net Asset Value (NAV) 289,388
Equity
Number of Units 771,665,343 ₹278,401
84%
NAV per Unit (₹) 375.02
Leverage Metrics Available Debt Headroom
Particulars September 30, 2020
₹164,545
Net Debt to TEV 16%
Net Debt to EBITDA(4) 2.8x
Interest Coverage Ratio
‒ excluding capitalized interest 3.5x ₹51,799
‒ including capitalized interest 3.3x
Available Debt Headroom ₹113 bn Existing Net Debt Proforma Net Debt
Capacity (2)
Notes:
(1) Closing price on National Stock Exchange as at September 30, 2020
(2) GAV per September 2020 valuation by independent valuer. Valuation exercise undertaken semi-annually. For further details refer notes on slide 54 42
(3) Given Embassy REIT owns 50% economic interest in GLSP, GAV includes fair value of equity investment in GLSP basis equity valuation method
(4) EBITDA has been annualized for comparability purposes
(5) $1 = ₹752Q FY2021 Earnings Materials
VIII. Financial Update
Proactive Capital Management
Existing cash and undrawn commitments total ₹12.2 billion. Successfully raised ₹7,500 mn during Q2
at 7.25% coupon, refinanced ₹6,752 mn in-place debt resulting in 140 bps interest savings
Principal Maturity Schedule (₹ mn)
₹9,039 mn
Existing Cash Balance(1) 36,773
12,994
₹3,216 mn
Undrawn Committed Facilities
5,453
AAA / Stable 123 251
Listed Bond Rating by CRISIL
FY2021 FY2022 FY2023 FY2024 FY2025+
Key Updates
0.7% Placed ₹15,000 mn rupee-denominated, listed, secured, non-convertible
Debt Maturities until FY2022 debentures
‒ During Q2, raised ₹7,500 mn at 7.25%, utilized to refinance ₹6,752 mn
resulting in 140 bps savings
₹113 bn ‒ Post Q2, raised additional ₹7,500 mn at 6.70%, utilized ₹4,740 mn to
acquire property maintenance operations(2)
Available Debt Headroom Coupon bearing bond at REIT Trust level with CRISIL AAA/Stable
Notes:
(1) Includes treasury balances, fixed deposits etc., net of 2Q FY2021 distributions of ₹4,244 mn 43
(2) Refers to acquisition of property maintenance operations for 20.3 msf existing REIT properties at Embassy Manyata, Bengaluru and Embassy TechZone, Pune2Q FY2021 Earnings Materials
VIII. Financial Update
Portfolio Valuation
Gross Asset Value of the portfolio stood at ₹337 bn with 92% of value in commercial office segment,
underpinning Embassy REIT’s asset quality
As at As at
Variance
Property Segment September 30, 2020 March 31, 2020
(₹ mn) (₹ mn) (%)
Embassy Manyata Commercial Office 156,439 150,106 4%
Embassy TechZone Commercial Office 21,607 21,032 3%
Embassy Oxygen Commercial Office 21,242 21,416 (1%)
Express Towers Commercial Office 17,722 17,866 (1%)
Embassy 247 Commercial Office 16,404 16,624 (1%)
FIFC Commercial Office 13,908 13,911 (0%)
Embassy Quadron Commercial Office 13,104 13,838 (5%)
Embassy Qubix Commercial Office 10,153 10,085 1%
Embassy Galaxy Commercial Office 8,783 8,696 1%
Embassy One Commercial Office 4,532 4,897 (7%)
Four Seasons at Embassy One Hospitality 7,545 7,673 (2%)
Hilton at Embassy GolfLinks Hospitality 4,375 4,436 (1%)
U/C Hilton at Embassy Manyata Hospitality 4,122 3,800 8%
Embassy Energy Others 10,002 10,289 (3%)
Subtotal - Portfolio Asset 309,938 304,669 2%
(2)
Embassy GolfLinks Commercial Office 27,428 27,014 2%
Subtotal - Investment Asset 27,428 27,014 2%
Gross Asset Value 337,366 331,683 2%
Other Assets 67,060 69,672
Other Liabilities (115,038) (112,254)
NAV 289,388 289,100
NAV per unit 375.02 374.64 0.1%
Notes: As per September’20 valuation by independent valuer. Valuation exercise undertaken semi-annually. For further details refer notes on slide 54
Given the COVID-19 related uncertainties and any impact on real estate market, the independent valuer has, as a precautionary measure, referenced material valuation uncertainty in arriving at his valuation 44
(1) Includes completed, under construction & proposed future development
(2) Details include 50% GLSP. Embassy REIT owns 50% economic interest in GLSP2Q FY2021 Earnings Materials IX. Looking Ahead Embassy GolfLinks, Bengaluru
2Q FY2021 Earnings Materials
IX. Looking Ahead
Resilient Business – Navigating COVID-19 Impact
Our high-quality properties, technology focused global occupiers and disciplined balance sheet will
help navigate near-term COVID-19 challenges and strongly positions us for growth opportunities
Landlord of choice with a high-quality difficult-to-replicate office portfolio in gateway cities providing
total business ecosystem
Diversified & high credit quality occupier base with 50% technology & 48% Fortune 500 companies
Strong Occupier
Portfolio
92% value in rent yielding office assets, hotels contribute < 1% of pre-COVID NOI (FY2020)
Stable cash flows expected due to long-term lease structure (WALE of 6.5 years) and contracted
rental increases, with only 6.6% of rents due for expiry in remainder of FY2021
Ample liquidity with ₹9,039 mn existing cash and ₹3,216 mn undrawn committed facilities
16% Net Debt to TEV with less than 1% of total debt maturing prior to FY2022
Robust Financial
Position
ICRA AAA (Stable) and CRISIL AAA / Stable credit ratings(1), reaffirmed / issued as of Sep’20
Additional ₹113 bn debt headroom provides significant flexibility to access capital, if needed
Proactive management of leases with focus on occupier retention and rent collections
Hands-on approach ensuring occupier business continuity, employee wellness & safety
Proactive Asset
Management
Leverage from industry-level consolidation & considerable supply shrinkage in next 2-3 years
Disciplined approach in reducing costs and discretionary capital expenditure
Our high-quality portfolio is well positioned to meet the anticipated increase in demand due to ‘flight to quality’
and capitalize on the continued consolidation in office market
Note:
(1) Credit ratings by ICRA and CRISIL for Embassy REIT as Issuer and for ₹51.5 billion Listed Bond respectively 462Q FY2021 Earnings Materials
IX. Looking Ahead
Our Strategy remains unchanged
We continue to focus on maintaining high occupancy levels and maximizing NOI, growing our existing
campuses and prudently managing our capital
On-Campus Capital
Leasing Acquisitions
Development Management
Capitalize on record
Deliver ongoing campus Actively seek
absorption and market Build leverage
development ahead of opportunistic
momentum for Indian selectively
Pre schedule acquisitions (3rd party,
commercial office space
COVID-19 ROFO) Quarterly distribution
Bring forward new
Actively manage lease with minimum 90% of
development in line with Undertake value
expiries to achieve NDCF to be distributed
anticipated demand accretive acquisitions
MTM upside
Deepen dialogue, focus Continue with ongoing Continue to evaluate Maintain prudent
on occupier retention 2.7 msf initial stage opportunities which are leverage levels
development projects, strategic and accretive
Proactive lease Focus on cash
monitor capex financing
renewals and rent Monitor financing optimization
Now
collections Monitor market markets closely
Continue to pay
dynamics and timing of
Deliver 3.4 msf rental distributions
new supply
escalations, build robust
leasing pipeline
Committed to our business strategy of delivering total returns through regular quarterly distributions
supplemented by our organic and inorganic growth initiatives
472Q FY2021 Earnings Materials X. Appendix Embassy Galaxy, Noida
2Q FY2021 Earnings Materials
X. Appendix

Portfolio Summary
  26.2 msf completed Grade A office assets (91.7% occupied, 6.5 years WALE, 28% MTM opportunity)

                                                             Leasable Area (msf)/Keys/MW                                WALE(2)           Occupancy                       Rent (₹ psf / mth)                       GAV(3)

               Property                        Completed               Development                  Total                 (yrs)               (%)             In-place         Market          MTM (%)    ₹ mn          % of total

Embassy Manyata                                    11.8                     3.1                      14.8                  7.3               97.0%               61              91             49%      156,439            46%
                     (1)
Embassy GolfLinks                                  2.7                        -                      2.7                   8.3               98.6%              116             148             27%      27,428             8%

Embassy One                                        0.3                        -                      0.3                   8.4               5.5%               156             147             (6%)      4,532             1%

Bengaluru Sub-total                               14.7                      3.1                     17.8                   7.6               95.7%               72             102             42%      188,399            56%

Express Towers                                     0.5                        -                      0.5                   3.4               90.2%              266             270              1%      17,722             5%

Embassy 247                                        1.2                        -                      1.2                   4.0               85.6%               99             110             11%      16,404             5%

FIFC                                               0.4                        -                      0.4                   3.5               77.5%              297             285             (4%)     13,908             4%

Mumbai Sub-total                                   2.0                        -                      2.0                   3.6               85.2%              173             178              3%      48,034             14%

Embassy TechZone                                   2.2                      3.3                      5.5                   5.2               90.6%               49              48             (3%)     21,607             6%

Embassy Quadron                                    1.9                        -                      1.9                   2.8               77.0%               44              48              8%      13,104             4%

Embassy Qubix                                      1.5                        -                      1.5                   4.9               97.6%               40              48             21%      10,153             3%

Pune Sub-total                                     5.5                      3.3                      8.8                   4.4               87.8%               45              48              7%      44,864             13%

Embassy Oxygen                                     2.5                      0.7                      3.3                  10.7               77.7%               48              54             13%      21,242             6%

Embassy Galaxy                                     1.4                        -                      1.4                   2.7               98.9%               35              45             28%       8,783             3%

Noida Sub-total                                    3.9                      0.7                      4.6                   8.0               85.2%               43              50             18%      30,025              9%

Subtotal (Office)                                 26.2                      7.1                     33.3                   6.5               91.7%               70              89             28%      311,322            92%

Four Seasons at Embassy One                     230 Keys                      -                   230 Keys                  -                1.4%                 -               -               -       7,545             2%

Hilton at Embassy GolfLinks                     247 Keys                      -                   247 Keys                  -                9.3%                 -               -               -       4,375             1%

Hilton at Embassy
                                                     -                   619 Keys                 619 Keys                  -                   -                 -               -               -       4,122             1%
Manyata (5 & 3 star)

Embassy Energy                                   100MW                        -                    100MW                    -                   -                 -               -               -      10,002             3%

Subtotal (Infrastructure Assets)          477 Keys / 100MW               619 Keys           1096 Keys / 100MW                                                                                            26,044              8%

                                         26.2 msf / 477 Keys /                             33.3 msf / 1096 Keys
Total                                                              7.1 msf / 619 Keys                                                                                                                    337,366            100%
                                               100MW                                             / 100MW

Notes:
(1)    Details included in the above table are for 100% stake in Embassy GolfLinks, except GAV which reflects only our 50% economic interest                                                                                49
(2)    Weighted against Gross Rentals assuming occupier exercise their renewal options after the end of the initial commitment period
(3)    Gross Asset Value (GAV) per September 2020 valuation by independent valuer. Valuation exercise undertaken semi-annually. For further details refer notes on slide 54
2Q FY2021 Earnings Materials
X. Appendix
Walkdown of Key Financial Metrics
(Amount in ₹ mn)
Particulars 2Q FY2021 2Q FY2020 Variance (%) 1H FY2021 1H FY2020 Variance (%)
Revenue from Operations 5,401 5,206 4% 10,564 10,557 0%
NOI
Property Taxes and Insurance (196) (181) 8% (389) (359) 8%
Direct Operating Expenses (392) (641) (39%) (792) (1,287) (38%)
Net Operating Income 4,814 4,384 10% 9,383 8,912 5%
Other Income 389 300 30% 769 442 74%
NDCF at SPV level
(1)
Property Management Fees (119) (115) 4% (235) (234) 1%
Indirect Operating Expenses (111) (180) (38%) (199) (353) (44%)
EBITDA 4,974 4,390 13% 9,717 8,768 11%
Distributions
Working Capital Adjustments (276) 245 NM (160) 1,102 NM
Cash Taxes (124) (356) (65%) (366) (682) (46%)
Principal Repayment on external debt (48) (20) 136% (97) (285) (66%)
Interest on external debt (388) (217) 79% (784) (568) 38%
Non-Cash Adjustments (80) (142) (44%) (133) (283) (53%)
NDCF at SPV level 4,056 3,900 4% 8,178 8,052 2%
Distribution from SPVs to REIT 4,088 4,249 (4%) 8,268 7,998 3%
Distribution from Embassy Golflinks 258 480 (46%) 738 960 (23%)
REIT Management Fees (1) (55) (61) (11%) (113) (103) 10%
Other Inflows at REIT level (Net of Expenses) (62) (7) NM (169) (13) NM
NDCF at REIT level 4,229 4,661 (9%) 8,724 8,841 (1%)
Distribution 4,244 4,630 (8%) 8,728 8,797 (1%)
Notes: Walkdown of Financial Metrics upto 'NDCF at SPV Level' represents financial numbers of all SPV's consolidated excluding Trust standalone numbers
(1) Property management fees includes 3% of facility rentals from only Commercial Office segment and does not include fees on Hospitality and Other segments and REIT Management Fees is 1% of REIT distribution 502Q FY2021 Earnings Materials
X. Appendix
Environment, Social & Governance
Embassy REIT has adopted world class corporate governance standards
Minimum 80% of value in completed and income producing
Asset Minimum 90% of distributable cash flows to be distributed
Restrictions on speculative land acquisition
Majority unitholder approval required if debt exceeds 25% of asset value
Debt
Debt cannot exceed 49% of asset value
50% independent directors on the Board, with 50% representation on all committees
Manager Manager can be removed with 60% approval of unrelated Unitholders
Alignment with Unitholder interests due to a distribution-linked management fees structure
Sponsors are prohibited from voting on their related party transactions
Majority Unitholder approval required for acquisition or disposal of asset which exceeds 10% of REIT
value
Strong Related Party
Safeguards Acquisition or sale price of new asset cannot deviate from average valuation of two independent valuers
by + / - 10%
Fairness opinion from independent valuer required if related party leases exceed 20% of the underlying
asset
512Q FY2021 Earnings Materials
X. Appendix
Environment, Social & Governance (Cont’d)
Continued focus on environment and social engagement, several COVID-19 related support initiatives
in communities surrounding our properties
Community Outreach - COVID-19 Relief measures
Dry Rations: Distribution of provisions to students Support for healthcare workers: Frontline workers & Health & Hygiene: Distribution of heath kits,
and parents of adopted Government schools doctors wearing PPE suits donated by Embassy REIT nutritional supplements to kids in government schools
ESG Independent Assurance Certificate Green Energy Initiatives
Embassy Energy, 100MW
Received assurance certificate solar park, supplies power to
from the British Standards our Bengaluru assets
Institution for our Environmental,
‒ Offsets an estimated
Social & Governance processes
200mn kg of CO2
‒ Certified adherence to Global annually(1)
Reporting Initiative (GRI)
framework Awarded the ‘Best Green
Building Project of the Year’
‒ Covered FY2020 Sustainability award for implementing 525
report of Embassy REIT kW Roof top solar project at
Embassy 247
Note:
(1) Indicative based on “CO2 baseline database for the Indian power sector June 2018 and assuming 215 mn units generation p.a. 52You can also read