Embassy Office Parks REIT - 4Q FY2020 Earnings Materials May 19, 2020
←
→
Page content transcription
If your browser does not render page correctly, please read the page content below
Embassy Office Parks REIT
4Q FY2020 Earnings Materials
May 19, 2020

                               1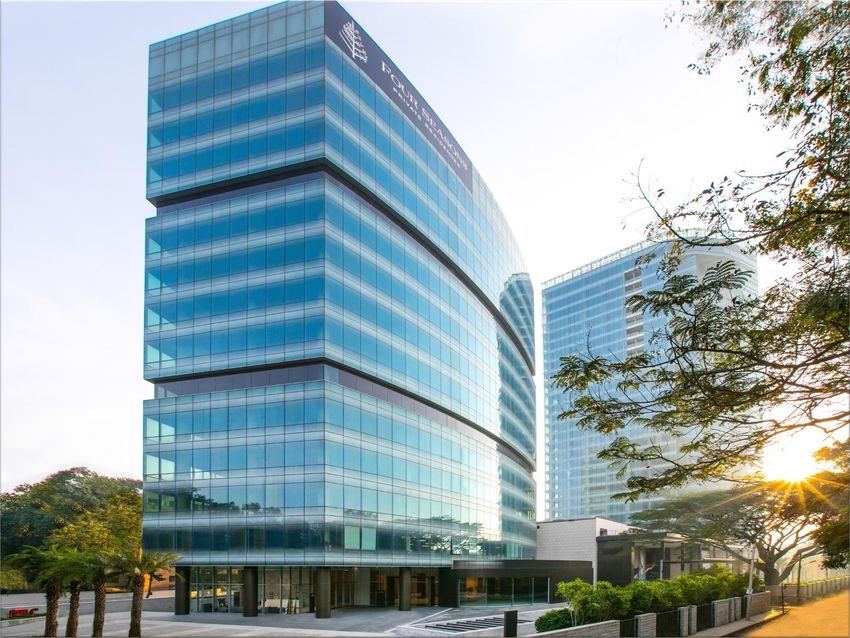
4Q FY2020 Earnings Materials

Press Release
Embassy Office Parks REIT Announces Results for Fourth Quarter and Fiscal Year FY2019-20
Distributes ₹18,821 million in first full year since listing
Bengaluru, India, May 19, 2020
Embassy Office Parks REIT (NSE: EMBASSY / BSE: 542602) (‘Embassy REIT’), India’s first listed REIT and the largest in Asia by
area, reported results today for the fourth quarter and full year ended March 31, 2020.

The Board of Directors of Embassy Office Parks Management Services Private Limited (‘EOPMSPL’), Manager to Embassy REIT, at
its Board Meeting held earlier today, declared a distribution of ₹5,317 million or ₹6.89 per unit for 4Q FY2020. The cumulative
distribution for FY2020 totals ₹18,821 million or ₹24.39 per unit. The record date for the 4Q FY2020 distribution is May 28, 2020 and
the distribution will be paid on or before June 3, 2020.

Michael Holland, Chief Executive Officer, said, “We are very pleased with our strong business performance in fiscal 2019-20.
Since Embassy REIT listed in April 2019, we have delivered a total return of c.25%. Our fourth quarter income and distribution
payout once again illustrate the stability and resilience of Embassy REIT delivering cash flows that are backed by the covenants of
our 160+ largely multinational occupier base.
While the COVID-19 pandemic has resulted in an uncertain near-term outlook for many businesses worldwide, we are uniquely
positioned to weather this pandemic-induced storm with our best-in-class office portfolio and strong balance sheet. While demand is
likely to moderate considerably through 2020, we believe that in this environment, Grade-A supply will reduce considerably over the
medium term, consolidation in the office market will continue and high-quality institutional landlords, such as Embassy REIT, will gain
market share.”

Financial Highlights for the Fourth Quarter and Fiscal Year
 •   Revenue from Operations for 4Q FY2020 grew year-on-year by c.8% to ₹5,434 million and cumulatively grew year-on-year by
     c.14% for FY2020
 •   Net Operating Income for 4Q FY2020 grew year-on-year by c.10% to ₹4,618 million and cumulatively grew year-on-year by
     c.15% for FY2020
 •   Distribution for 4Q FY2020 of ₹5,317 million or ₹6.89 per unit, representing c.100% payout ratio and full year cumulative
     distribution totals ₹18,821 million or ₹24.39 per unit representing c.99.8% payout ratio
 •   Strong balance sheet with ample liquidity and low leverage of c.15% Net Debt to TEV as of March 31, 2020, existing cash and
     undrawn committed facilities totals ₹13.5 billion and only c.1.3% of total debt matures in the next two years
                                                                                                                                  2
4Q FY2020 Earnings Materials

Press Release (Cont’d)
Business Highlights for the Fourth Quarter and Fiscal Year
 •   Achieved overall occupancy of c.92.8% on c.26.2 msf operating office portfolio, with same-store occupancy of c.94.5%
     considering March 2019 as base year
 •   Leased c.389k sf new area during the fourth quarter, with full year lease-up of c.2.4 msf being the highest absorption in
     previous 5 years
 •   Re-leased c.1.1 msf during the year at c.53% releasing spread, renewed an additional c.600k sf at c.19% renewal spread,
     illustrating the embedded growth in our portfolio
 •   Delivered c.1.4 msf new office buildings within existing campuses during the year, c.62% of these new completions already
     committed

COVID-19 Update
 •   Activated our business continuity plan on March 4, 2020, and our centralized taskforce focused on ensuring safe workspaces,
     on-premise health screenings, and business continuity for occupiers
 •   Our properties remained open to support core business functions of our occupiers throughout the national lockdown within the
     parameters laid out by the government
 •   Rent collections from office occupiers remained strong at c.92% for the month of April 2020
 •   Halted all construction activity and hotel operations to comply with government directives during the lockdown. We will resume
     these activities once the government eases lockdown restrictions

Vikaash Khdloya, Deputy CEO and COO, said, “Our fourth quarter operating performance was resilient, led by business continuity
support for our occupiers and employee wellness support. We would like to thank all our employees, the civic authorities, and
healthcare professionals who continue to work tirelessly during this challenging period. Our immediate focus remains ensuring the
health and safety of all our stakeholders as they return to work in our parks.”

Investor Materials and Quarterly Investor Call Details
Embassy REIT has released a package of information on the quarterly results and performance, that includes (i) audited condensed
standalone and audited condensed consolidated financial statements for the quarter and financial year ended March 31, 2020, (ii) an
investor presentation covering 4Q FY2020 results, and (iii) supplemental operating and financial data book that is in line with leading
reporting practices across global REITs. All these materials are available in the Investor Relations section of the REIT’s website at
ir.embassyofficeparks.com
                                                                                                                                  3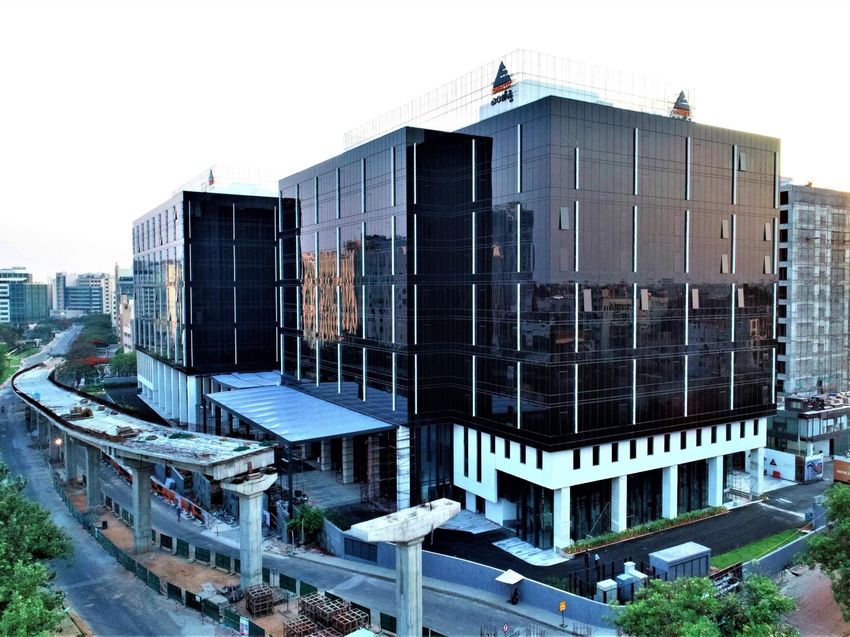
4Q FY2020 Earnings Materials

Press Release (Cont’d)
Investor Materials and Quarterly Investor Call Details (Cont’d)
Embassy REIT will host a conference call on May 19, 2020 at 18:30 hours Indian Standard Time to discuss the 4Q FY2020 results. A
replay of the call will be available till June 2, 2020 on the Investor Relations section of the website at ir.embassyofficeparks.com
Disclaimer
This press release is prepared for general information purposes only. The information contained herein is based on management information and estimates. It is
only current as of its date, has not been independently verified and may be subject to change without notice. Embassy Office Parks Management Services Private
Limited (“the Manager”) in its capacity as the Manager of the Embassy Office Parks REIT (“Embassy REIT”), and Embassy REIT make no representation or
warranty, express or implied, as to, and do not accept any responsibility or liability with respect to, the fairness and completeness of the content hereof. Each
recipient will be solely responsible for its own assessment of the market and the market position of Embassy REIT.
This press release contains forward-looking statements based on the currently held beliefs, opinions and assumptions of the Manager. Forward-looking statements
involve known and unknown risks, uncertainties and other factors, which may cause the actual results, financial condition, performance, or achievements of the
Embassy REIT or industry results, to differ materially from the results, financial condition, performance or achievements expressed or implied by such forward-
looking statements. Given these risks, uncertainties and other factors, including the impact of COVID-19 on us, our occupiers and the Indian and global economies,
recipients of this press release are cautioned not to place undue reliance on these forward-looking statements. The Manager disclaims any obligation to update
these forward-looking statements to reflect future events or developments or the impact of events which cannot currently be ascertained, such as COVID-19. In
addition to statements which are forward looking by reason of context, the words ‘may’, ‘will’, ‘should’, ‘expects’, ‘plans’, ‘intends’, ‘anticipates’, ‘believes’,
‘estimates’, ‘predicts’, ‘potential’ or ‘continue’ and similar expressions identify forward-looking statements.
This press release also contains certain financial measures which are not measures determined based on GAAP, Ind-AS or any other internationally accepted
accounting principles, and the recipient should not consider such items as an alternative to the historical financial results or other indicators of the Embassy REIT's
cash flow based on Ind-AS or IFRS. These non-GAAP financial measures, as defined by the Manager, may not be comparable to similarly titled measures as
presented by other REITs due to differences in the way non-GAAP financial measures are calculated. Even though the non-GAAP financial measures are used by
management to assess the Embassy REIT's financial position, financial results and liquidity and these types of measures are commonly used by investors, they
have important limitations as analytical tools, and you should not consider them in isolation or as substitutes for analysis of the Embassy REIT's financial position or
results of operations as reported under Ind-AS.
Investors should also take note that Embassy REIT was listed on April 1, 2019 and the Embassy REIT assets were acquired between March 22, 2019 to March 25,
2019. Accordingly, the comparative quarterly and financial year financial information has been prepared by comparing unaudited combined financial statements for
the quarter ended March 31 2019 and audited combined financial statements for the financial year ended March 31, 2019 (assuming that the Embassy REIT held
the REIT assets in its present form as of April 1, 2018) as against audited condensed consolidated financial statements for the quarter and financial year ended
March 31, 2020.
About Embassy REIT
Embassy Office Parks is India’s first and only listed REIT. The REIT comprises c.26.2 msf of completed and operational commercial properties across India. With
approximately c.7.1 msf of on-campus development in the pipeline, the total portfolio spans c.33.3 msf across seven Grade A office parks and four city-center office
buildings in India’s best performing office markets of Bengaluru, Mumbai, Pune and the National Capital Region (NCR). The portfolio is home to over 160 blue chip
corporate occupiers, and comprises 78 buildings with strategic amenities, including two completed hotels, two under-construction hotels, and a 100MW(AC) solar
park that supplies renewable energy to park occupiers.
                                                                                                                                                                4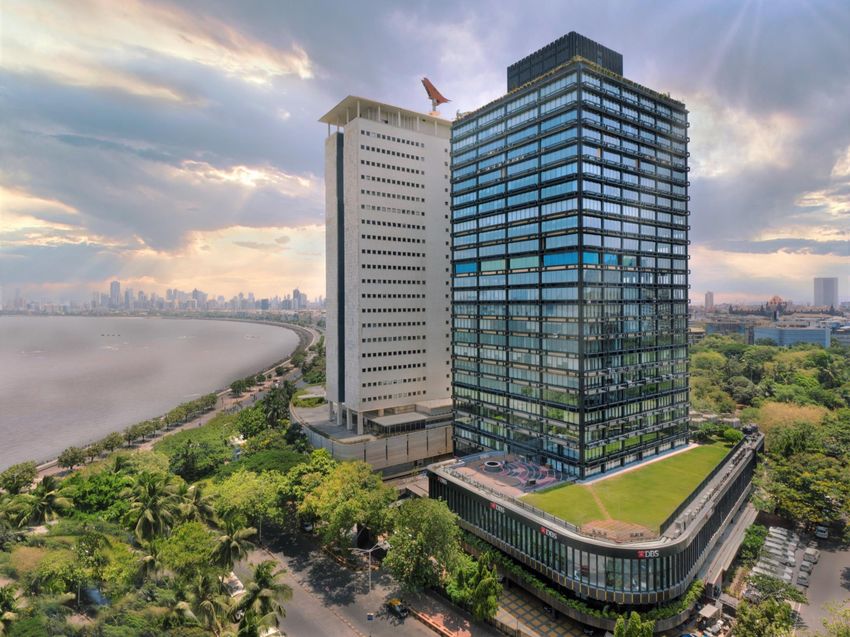
4Q FY2020 Earnings Materials

Table of Contents
 I.            Key Highlights                        6

 II.           Overview                              12

 III.          Market Outlook                        20

 IV.           Business Continuity during COVID-19   24

 V.            Commercial Office Update              28

 VI.           Development Update                    32

 VII.          Asset Management Update               35

 VIII.         Financial Update                      38

 IX.           Looking Ahead                         43

 X.            Appendix                              46

                                                          5
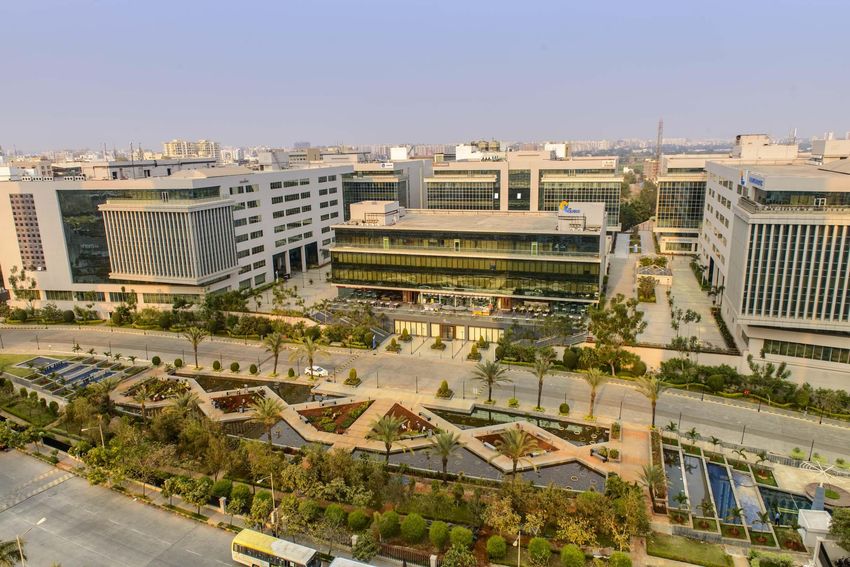
4Q FY2020 Earnings Materials

I. Key Highlights

Embassy Manyata, Bengaluru
4Q FY2020 Earnings Materials
I. Key Highlights
Business Highlights for FY2020
Strong business performance and distribution mainly driven by robust leasing, mark-to-market rental
reversions and early delivery of on-campus development projects
Operating Levers Performance Returns
New lease-up of c.2.4 msf to 25+ occupiers
Re-leased c.1.1 msf at c.53% re-leasing
Leasing spread
Renewed c.0.6 msf at c.19% renewal
spread
₹18,821 mn
Delivered c.1.4 msf; 2-3 quarters ahead of Total Distribution
schedule, c.62%(1) already committed
On-Campus Development
Launched c.2.6 msf on-campus office
development, to drive next phase of growth
₹24.39
Achieved c.12-15% contractual escalations DPU
on c.5.5 msf, 50+ occupiers
Asset Management Executed ₹1.7 bn infra & upgrade projects
Raised ₹22 bn debt, refinanced ₹30 bn
25%
Acquired c.0.6 msf leasable area upon Total Return(2)
completion in Jun’23 at c.9.25% yield
Acquisitions
‒ Located within overall Embassy
Manyata campus, Bengaluru
Notes:
(1) Excludes c.45k sf growth options at Embassy Oxygen. Factoring the growth options, area committed would be c.65%. These options are exercisable till Mar’21 7
(2) Computed as % of unit price appreciation upto March 31, 2020 and FY2020 distribution yield upon listing price of ₹300/ unit. Past performance is not indicative of future results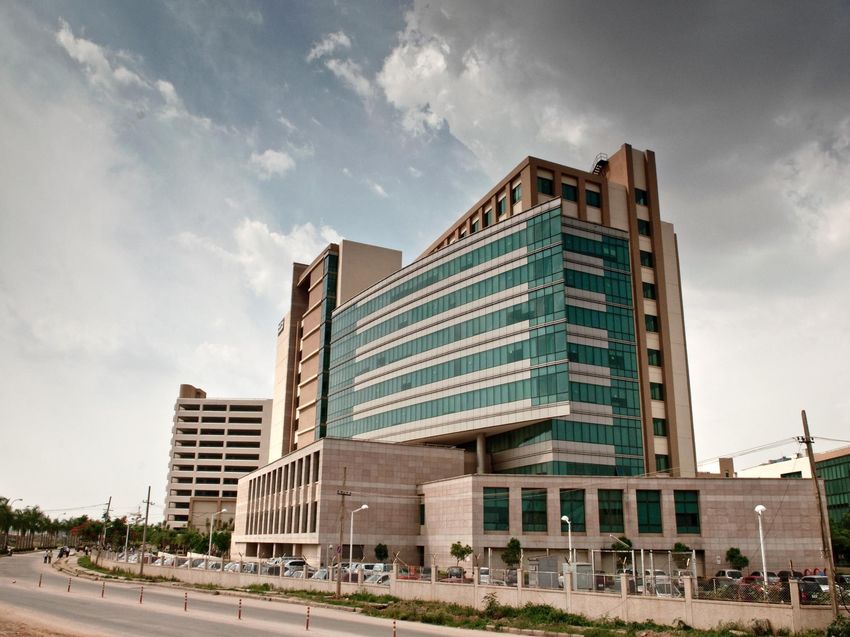
4Q FY2020 Earnings Materials
I. Key Highlights
Business Highlights for 4Q FY2020
Despite COVID-19 outbreak, resilient operating performance led by business continuity support for
our occupiers, employee wellness support and significant rental collections
All business parks & buildings open for business throughout lockdown with complete on-ground support
Business Continuity Early activation of Business Continuity Plan on March 4, seamless pan-India response across portfolio
during COVID-19
‒ Focused on twin priorities of (i) facilitating business continuity for occupiers and, (ii) ensuring health,
well-being and safety of all stakeholders
c.92.8% occupancy as at Mar’20 on c.26.2 msf completed office portfolio
‒ c.94.5% Same-store occupancy on c.24.8 msf (Mar’19 as base year)
Leasing
c.389k sf new lease-up during 4Q FY2020, with advanced lease discussions / LOIs totaling c.0.3 msf
c.75k sf re-leased at c.20% re-leasing spread, with c.138k sf renewed at c.46% renewal spread
OC received for c.1.4 msf on-campus office development; TIs / fit-out work underway by occupiers
‒ c.62%(1) already committed, including to global corporations
Development
c.2.6 msf on-campus office development projects under pre-construction stages
‒ Delivery timelines likely to be impacted by 1-2 quarters due to COVID-19 related disruptions
Collected c.92% of Apr’20 rents with further c.3% commitments by month-end
Achieved c.12-15% contractual escalations on c.1.6 msf, 20+ occupiers
Asset Management Occupancy at both operational hotels significantly impacted due to COVID-19
‒ Four Seasons achieved break-even occupancy for Jan’20 prior to travel restrictions
AAA / Stable credit rating reaffirmed by CRISIL for ₹36.5 bn listed bond issued in FY2020
Note:
(1) Excludes c.45k sf growth options at Embassy Oxygen. Factoring the growth options, area committed would be c.65%. These options are exercisable till Mar’21 8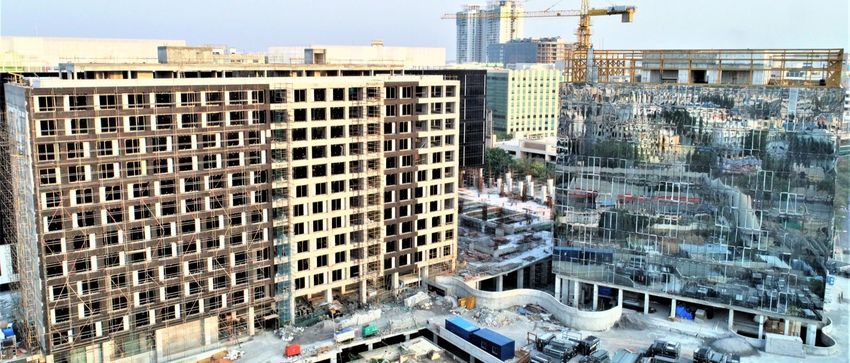
4Q FY2020 Earnings Materials
I. Key Highlights
Financial Highlights for FY2020
Revenue from Operations and NOI for FY2020 up c.14% and c.15% respectively YoY. NOI and EBITDA
margins stood at c.85% and c.82% respectively due to scale efficiencies and cost optimization efforts
FY2020 FY2019
Variance % Remarks
(mn) (mn)
Revenue Contracted lease escalations on c.8.8 msf
from ₹21,449 ₹18,771 +14% Lease-up of c.2.3 msf vacancy across Embassy Manyata,
Operations FIFC, Embassy 247, Embassy TechZone & others
Increase in Revenue from Operations
NOI ₹18,170 ₹15,741
Decrease in expenses due to cost saving initiatives at
+15% Embassy Manyata
Margin (%) 85% 84%
c.100 bps NOI margin improvement vs. FY2019
Increase in NOI
EBITDA ₹17,647 ₹15,137 One-off items(1) in previous year FY2019
+17% ‒ Adjusted for these one-off items, EBITDA margin for
Margin (%) 82% 81% FY2019 was c.79% vs. c.82% in FY2020
c.100 bps EBITDA margin improvement vs. FY2019
Cumulative distribution of ₹18,821 mn or ₹24.39 per unit for
Distribution ₹18,821 – FY2020
NA ‒ Represents payout ratio of c.99.8% of NDCF at REIT
Payout ratio 99.8% – level
Notes: Above results exclude Revenue, NOI and EBITDA from Embassy GolfLinks since Embassy REIT owns 50% economic interest in GLSP. Embassy GolfLinks revenue is ₹3,911 mn and NOI is ₹3,585 mn for FY2020
Figures for FY2020 are basis audited condensed consolidated financials. Figures for FY2019 are basis audited combined financials and may not be comparable. For further details refer notes on slide 52 9
(1) One-off items relate to FY2019 (pre-listing period) and comprise of certain interest income on inter-corporate deposits offset by loss on settlement of financial instruments through issue of equity
4Q FY2020 Earnings Materials
I. Key Highlights
Financial Highlights for 4Q FY2020
Revenue from Operations and NOI for 4Q FY2020 up c.8% and c.10% respectively YoY. Distribution
payout ratio for the quarter stood at c.100%
4Q FY2020 4Q FY2019
Variance % Remarks
(mn) (mn)
Revenue Contracted lease escalations on c.6.4 msf
from ₹5,434 ₹5,011 +8% Lease-up of c.1.4 msf vacancy across FIFC, Embassy 247,
Operations Embassy TechZone & others
NOI ₹4,618 ₹4,200 Increase in Revenue from Operations
+10% Decrease in expenses due to cost saving initiatives at
Margin (%) 85% 84% Embassy Manyata
Increase in NOI
EBITDA ₹4,622 ₹3,751 Interest Income on advance consideration for M3 Block B
+23% One-off items(1) in previous year FY2019
Margin (%) 85% 75% ‒ Adjusted for these one-off items, EBITDA margin for 4Q
FY2019 was c.83% vs. c.85% in 4Q FY2020
Distribution ₹5,317 – Distribution of ₹5,317 mn or ₹6.89 per unit for 4Q FY2020
NA ‒ Represents payout ratio of c.100% of NDCF at REIT
level
Payout ratio 100.0% –
Notes: Above results exclude Revenue, NOI and EBITDA from Embassy GolfLinks since Embassy REIT owns 50% economic interest in GLSP. Embassy GolfLinks revenue is ₹1,136 mn and NOI is ₹1,058 mn for 4Q FY2020
Figures for 4Q FY2020 are basis audited condensed consolidated financials. Figures for 4Q FY2019 are basis unaudited combined financials and may not be comparable. For further details refer notes on slide 52 10
(1) One-off items relate to FY2019 (pre-listing period) and comprises of loss on settlement of financial instruments through issue of equity and marketing expenses relating to public issue4Q FY2020 Earnings Materials
I. Key Highlights
Distribution Overview
Distribution for 4Q FY2020 stood at ₹5,317 mn i.e. ₹6.89 per unit with scheduled payment date on or
before June 3, 2020
Particulars 4Q FY2020 FY2020
Distribution period Jan'20 – Mar'20 Apr'19 – Mar'20
Distribution amount (mn) ₹5,317 ₹18,821
Outstanding units (mn) 772 772
Distribution per unit ₹6.89 ₹24.39
- Interest ₹2.49 ₹9.99
- Amortization of SPV level debt ₹4.17 ₹14.03
- Dividend ₹0.23 ₹0.37
Announcement date May 19, 2020 -
Record date May 28, 2020 -
Payment date On or before June 3, 2020 -
Embassy
EmbassyREIT
REITis
isfocused on delivering
committed quarterly distribution
to regular quarterly distribution to
to Unitholders
Unitholders,with
withminimum
minimum90%
90%of
ofNet
Net
Distributable CashCash
Distributable Flows (‘NDCF’)
Flows required
(‘NDCF’) to betodistributed
be distributed
114Q FY2020 Earnings Materials II. Overview Express Towers, Mumbai
4Q FY2020 Earnings Materials
II. Overview

Who We Are: Quick Facts
  We run a commercial office portfolio that serves as essential corporate infrastructure to global
  occupiers, including many Fortune 500 corporations

       33.3 msf(1)                                      160+                                   92.8%
            Portfolio                                Blue-chip                               Occupancy
                                                     occupiers

                11                                   1,096(1)                               100 MW                                                                        NCR (9%)

        Commercial                                  Hotel Keys                               Solar Park
          Offices

              30%                                       42%                                7.0 Years                                                      Mumbai (15%)

     Mark-to-Market                               Gross Rents                                     WALE                                                        Pune (14%)
        Upside                                   from Fortune
                                                 500 occupiers

                                                                                                                                                                           Bengaluru (62%)

   ₹21,449 mn                                 ₹18,821 mn                                          15%
         FY2020                                      FY2020                                  Net Debt to
      Revenue from                                 Distribution                                 TEV
       Operations
Notes: City wise split by % of GAV per Mar’20 valuation by independent valuer. Valuation exercise undertaken semi-annually. For further details refer notes on slide 52
(1)   Includes completed, under construction & proposed future development                                                                                                                   13
4Q FY2020 Earnings Materials II. Overview Seven Infrastructure-like Office Parks (31 msf)(1) Embassy Manyata Embassy Quadron Bengaluru (14.8 msf) Pune (1.9 msf) Embassy GolfLinks Embassy TechZone Bengaluru (2.7 msf) Pune (5.5 msf) Embassy Oxygen Embassy Galaxy Embassy Qubix Noida (3.3 msf) Noida (1.4 msf) Pune (1.5 msf) Note: (1) Includes completed, under construction & proposed future development 14
4Q FY2020 Earnings Materials
II. Overview

Four Prime City-center Offices (2.3 msf)
Express Towers                 FIFC
Mumbai (0.5 msf)               Mumbai (0.4 msf)

                               Embassy 247        Embassy One
                               Mumbai (1.2 msf)   Bengaluru (0.3 msf)

                                                                        15
4Q FY2020 Earnings Materials
II. Overview
What We Do: Our Strategy
Maximize distribution and NAV per unit through organic growth and new acquisitions
4
Capital
Management
3
Acquisitions Build leverage
2 selectively
On-campus Use strong balance
Capitalize on
1 Development sheet to drive accretive
fragmented office
growth through
market and undertake
Leasing Deliver c.7.1 msf on-
disciplined acquisitions
value accretive
campus development acquisitions Quarterly distribution
with minimum 90% of
Grow NOI by leasing Proactive pre-leasing to Pan-India acquisition
NDCF to be distributed
existing vacancy de-risk new potential from 3rd parties
development Low expenses and fees
Manage lease expiries c.43 msf of ROFO
Select infrastructure
enhancing Unitholders’
& capture mark-to- opportunity from
ancillary projects value
market upside Embassy Sponsor
(hotels, flyovers etc.) to
Experienced on-ground increase entry barriers
teams & hands-on
approach to leasing Provide “total business
ecosystem”
Best-in-class occupier
engagement
Proactive asset management to drive value with strong corporate governance
164Q FY2020 Earnings Materials
II. Overview
Our Opportunity: India as the Global Technology Innovation Hub
India to continue to attract global technology corporations due to availability of highly educated and
skilled talent at a reasonable cost. COVID-19 response likely to accelerate technology spends globally
India Advantage FY2020 Performance(1) Evolving Technology Landscape
$191 bn
India leads in STEM(3) Services
(7.7% growth)
talent for technology • Information Technology • Engineering R&D
Talent assignments
Availability Revenue • BPM • Digital and Media
Over 2 million(1)
students
graduating each year $147 bn
(8.1% growth) Software
• Systems • Cybersecurity
Employee cost in India is Exports
• Enterprise • Fintech / Edtech
around c.20-25% of
Cost
Advantage comparable cost in the
occupier’s country of $44 bn
origin (2) (7.3% growth) eCommerce / Omni Channel Retail
• Social Shopping • Intelligence
Domestic • Voice Commerce • Digital Payments
India is one of the most
affordable office market
Affordable globally 4.4 mn Technologies
Rentals Rental costs merely (4.9% growth)
• Cloud / Robotics • Blockchain
c.2-6% of occupier
revenues(2) Employees • Intelligent Automation • Reality AR / VR
COVID-19 response likely to accelerate technology spends globally, especially digital, cloud, data services, cyber security etc.
Focus on Business Continuity Plan (BCP) and increased cost pressures on global businesses likely to increase GCCs /
outsourcing to India in medium-term
Notes:
(1) Source: NASSCOM - The Technology Sector in India: Strategic Review 2020 (Techade – the new decade) 17
(2) Source: CBRE Research, ICICI Securities Research, Embassy REIT
(3) Science, Technology, Engineering, Mathematics4Q FY2020 Earnings Materials
II. Overview
Our Occupier Base
Global business with a diversified and high credit quality occupier base
Industry Diversification(1) c.42% of Gross Rentals Originate From Top 10 Occupiers
Top 10 % of
Sector
Occupiers Rentals
Financial
Technology Services IBM Technology 12%
50% 12%
Cognizant Technology 9%
Research, NTT Data Technology 4%
Consulting &
Analytics ANSR Research & Analytics 3%
10%
Cerner Healthcare 3%
J.P. Morgan NOKIA PwC Research & Analytics 2%
Facebook Google India Technology 2%
Others NOKIA Telecom 2%
10%
JP Morgan Financial Services 2%
MetLife PwC
L&T Infotech Technology 2%
NTT DATA
Total 42%
Retail
7% Potential COVID-19 Impact
Healthcare c.6% occupiers from directly impacted sectors
Telecom 6%
5% Co-working Hospitality Aviation Retail(2)
c.2.8% c.0.6% c.0.6% c.2.0%
Notes:
(1) Represents industry diversification percentages based on Embassy REIT’s share of gross rentals 18
(2) Includes front line brick & mortar retail and excludes eCommerce / technology focused omni channel retail activities for global parent companies4Q FY2020 Earnings Materials
II. Overview
Our Portfolio: Commercial Office-focused
Predominantly an office REIT with commercial office segment contributing over 90% of Portfolio Value
and NOI. Hospitality segment contributed only c.0.6% of NOI in FY2020
Contribution by Gross Asset Value Contribution by Net Operating Income
Others
3% Others
8%
Hospitality
5% Hospitality
0.6%
₹331,683 mn(1) ₹18,170 mn(2)
Gross Asset Value Net Operating Income
Commercial Commercial
Office Office
92% 91%
c.26.2 msf completed best in-class Grade A Office properties (c.92.8% occupied, 7.0 years WALE)
Notes:
(1) GAV per Mar’20 valuation by independent valuer. Valuation exercise undertaken semi-annually. For further details refer notes on slide 52 19
(2) NOI for FY2020 excludes revenue of GLSP given Embassy REIT owns 50% economic interest in GLSP4Q FY2020 Earnings Materials III. Market Outlook Embassy One, Bengaluru
4Q FY2020 Earnings Materials
III. Market Outlook
Market Fundamentals
CY2019 was a record year for India office market with c.61 msf gross absorption. REIT markets
witnessed strong fundamentals resulting in record absorption and low vacancy levels
Absorption Trends City-wise Performance – CY2019
Absorption(2) Supply Vacancy
60.8
Average Absorption 46.4 msf
City (msf) (msf) (%)
48.9 Bengaluru 16.1 10.8 4.1%
45.8 46.1 47.2
44.8 Pune 7.0 4.5 5.6%
39.7
35.1 Mumbai 7.1 4.3 21.0%
33.8
29.3 NCR 11.1 10.5 23.4%
Embassy REIT Markets 41.3 30.1 13.8%
Hyderabad 12.9 13.5 10.4%
18.9 Chennai 5.5 3.3 8.5%
16.9 15.0 14.4 14.0
Kolkata 1.1 0.2 36.7%
Other Markets 19.5 17.1 14.6%
CY2015 CY2016 CY2017 CY2018 CY2019
Grand Total 60.8 47.2 14.0%
Supply (msf) Gross Absorption (msf) Vacancy (%)
Absorption: Record absorption for Indian commercial office space in CY2019, c.31%(1) higher compared to historical average
‒ Bengaluru, REIT’s dominant market, continued as India’s leading market with c.30%(1) share of historical annual leasing
Supply: Significant pre-commitments witnessed in CY2019 supply of c.47 msf, c.37% YoY supply growth average
Vacancy: Vacancy declined c.500 bps to c.14% in the past 5 years, primarily driven by technology sector demand
‒ Core REIT markets of Bengaluru and Pune witnessed sub-6% vacancy levels
Source: CBRE Research, Embassy REIT
Note: 21
(1) Based on average annual gross absorption from CY2015 to CY2018
(2) Represents gross absorption figures4Q FY2020 Earnings Materials
III. Market Outlook
Market Fundamentals (Cont’d)
Demand impacted by 30%(1) in Q1 due to COVID-19 and is softening in short-term. In medium-term,
high-quality assets to benefit from supply shrinkage and demand from increased technology spends
Proforma Demand Analysis Remarks
Gross Absorption (msf)
Short-term Outlook
Pre COVID-19 Post COVID-19
‒ Limited impact for existing leases in Grade A properties
‒ Demand softening as occupiers defer decision-making
‒ Low quality stock likely to come under intense pressure
63.2
Medium-term Outlook
‒ Absorption recovery timeline uncertain – multiple
49.3 possible outcomes based on lockdown timeframe
44.5 ‒ Increased technology spends to support new lifestyles
and outsourcing likely given global business pressures
34.5
‒ Evolving themes such as WFH, de-densification,
wellness, industry consolidation, flight to quality etc.
‒ India office demand well placed given talent pool, cost
advantage & depreciating rupee
Portfolio Implications
‒ Limited impact on operational portfolio given asset
CY2020F Last 5 Years CY2020F 30% lower of quality, long leases, below market rents &
CBRE Prior Average CBRE Revised Last 5 Years occupier stickiness
Estimate Estimate Average ‒ c.1.4 msf upcoming expiries in FY2021, c.32% in
advanced stages; no new REIT supply until FY2023
Illustrative ‒ Opportunity given industry consolidation, preference for
Scenario 1 Scenario 2 Scenario 3
Outcomes institutional assets & low supply in key micro-markets
Source: CBRE Research, Embassy REIT
Note: 22
(1) Jones Lang LaSalle – India Real Estate Market Update Q1 2020 dated Apr’204Q FY2020 Earnings Materials
III. Market Outlook
Market Fundamentals (Cont’d)
Considerable supply shrinkage from 1Q CY2020 owing to COVID-19 and likely to continue in medium-
term. Comparable and competing supply for REIT properties assessed to be even lower
Proforma Supply Analysis (2020-2021) Remarks
Comparable and competing c.12 msf Short-term Outlook
supply in REIT Markets (~10%)
‒ Sharp drop likely due to COVID-19 disruptions on
supply chain and labor remobilization
‒ Only well-funded developers to complete projects
‒ 1Q CY2020 supply down c.32% YoY per C&W, trend to
Announced Pan-India Supply
Non-comparable or unrealistic c.35 msf continue
supply in REIT Markets (~30%)
Medium-term Outlook
(2020-2021) ~ c.119 msf
‒ Dramatic liquidity squeeze to disrupt new projects
Pre-committed Supply c.9 msf ‒ Announced supply for next 2 years expected to
in REIT Markets (~8%) drastically shrink by c.25% to c.89 msf per CBRE
‒ Supply recovery likely to lag demand recovery
Portfolio Implications
c.33 msf
Supply in Non-REIT Markets
(~28%) ‒ Comparable & competing supply in next 2 years is
significantly lower at c.10% of announced supply
‒ REIT has no near-term new supply, c.2.6 msf ongoing
developments to be delivered FY2023 onwards
‒ REIT developments are part of existing campuses,
COVID-19 Impacted Supply c.30 msf REIT’s low leverage to enable ongoing capex financing
per CBRE estimate (~25%)
‒ REIT has flexibility to control supply timing over the
medium-term
Source: CBRE Research, Embassy REIT
Note: Comparable and competing supply has been arrived factoring supply considerations including city, micro-markets, location, project completion timing, quality etc. 234Q FY2020 Earnings Materials
IV. Business Continuity
during COVID-19
Embassy Manyata, Bengaluru4Q FY2020 Earnings Materials
IV. Business Continuity during COVID-19
COVID-19 Response
Our response to COVID-19 focused on twin priorities of facilitating business continuity for our
occupiers and ensuring health, safety and well-being of all stakeholders
COVID-19 Impact Our Response
March 25, 2020 Business Continuity Plan (BCP) Health, Safety & Well-being
Pan-India lockdown
implemented for 21 days
Early precautionary measures in Feb’20 Instituted stringent measures for
employee well-being
Activated BCP on March 4, ahead of
April 14, 2020
Government lockdown announcement Mandatory thermal screening
Pan-India lockdown
extended for further 3 All properties operational throughout Social distancing measures in elevators,
weeks lockdown with full on-ground support(1) entry points, walkways etc.
Over 50% of our occupiers operated their Closure of food courts, sports area, gym
April 20, 2020 critical business continuity operations(2)
IT / ITeS firms allowed to Enhanced sanitization & cleaning
function at 50% strength Daily pan-India and property-specific
Self e-declaration by visitors
updates to 1,000+ CRE touchpoints
Daily training to on-ground staff
May 01, 2020 24x7 centralized COVID-19 helpdesk to
Pan-India lockdown further address occupier needs and queries Awareness campaigns in public areas
extended for 2 weeks with
partial relaxations
March 4 100% 1,600+ 220k+
May 04, 2020
Private firms / offices Business Parks On-ground staff
Early activation of Thermal scans
allowed to function at 33% and buildings deployed during
BCP conducted
strength operational(2) the lockdown
Notes:
(1) Business Parks and buildings operational throughout lockdown to support business continuity of critical services of occupiers within the parameters laid out by the Government 25
(2) As per Advisory from Ministry of Electronics and Information Technology (dated March 24, 2020), certain IT / ITeS firms supporting essential functions such as Government services, Healthcare and Insurance, Transport and
Logistics etc. were deemed as “Mission critical” and were allowed to operate from the company offices during the lockdown.4Q FY2020 Earnings Materials
IV. Business Continuity during COVID-19
Occupier Accolades
Early activation of our business continuity plan and comprehensive execution of safety measures
enabled business continuity of our occupiers during the challenging COVID-19 lockdown period
“I would like to extend my sincere thanks to the entire Embassy Office Parks team for the excellent support & consistent updates
in response to the COVID-19 situation. From the first BCP response email received on 04-Mar-20, the Embassy team has been
sending us regular updates, actions taken, and mitigation plans on a daily basis. The team identified the COVID-19 challenges
much earlier to the Government response and we truly appreciate our association with Embassy Manyata Tech Park.”
Global Specialty Software & QA services firm at Embassy Manyata, Bengaluru
“Appreciate all the incredible efforts put in to ensure health & safety of employees working within the business park. The proactive &
preventive measures implemented by your team were truly commendable & the results of zero positive cases in the park speak
for itself. One of the most comprehensive approach I have witnessed for COVID-19 among many parks that we work with..”
Global Cybersecurity major at Embassy GolfLinks, Bengaluru
“Thank you so much for your efforts to prevent COVID-19 in the Embassy One building. From the 1st day of COVID-19 case in
India, your company implemented strict measures for preventing COVID-19 & actively helped all employees to follow the
guidelines. Thanks to that, all our employees are able to work safely in the office.”
Asian Trade and Investment organization at Embassy One, Bengaluru
“We really appreciate the proactive and professional approach adopted by Embassy Office Parks team. Your thought process
was ahead of the curve & the far sightedness along with thought provoking ideas helped to take situational controls very well. The
implementation of thoughts to action was quick enough & gave the confidence that we are in safe hands. Your teams have set a
precedence for creating the much-needed safe environment...”
Fortune 500 B2B Technology services firm at Embassy Galaxy, Noida
“Phenomenal support extended by Embassy Oxygen team during COVID-19 lockdown. Appreciate the way team proactively
implemented COVID-19 safety measures at the very onset of the pandemic. This has been quite reassuring for us and our
employees. Appreciate your professionalism and sincerely hope this relationship grows many times in the years to come.”
Fortune 10 Healthcare services firm at Embassy Oxygen, Noida
264Q FY2020 Earnings Materials
IV. Business Continuity during COVID-19
Occupier Accolades (Cont’d)
“Thanks for extending continuous support and being accommodative at all times, we really appreciate the commitments & efforts
your team has taken in responding to COVID-19 to ensure all occupiers are operating and safe.”
Fortune 20 Internet Search and Technology major at FIFC, Mumbai
“I thank your entire team who have kept us well informed every day of the latest developments and the health & hygiene
measures actioned on ground to safeguard the personnel in Embassy Office Park facilities. It gives us great comfort to know that
all personnel are safe and secure in these facilities under the care of your teams...”
Singaporean Banking major at Embassy 247 & Express Towers, Mumbai
“Embassy Office Parks management & team have done a fantastic job in ensuring that appropriate measures have been
undertaken in the premises during this COVID-19 lockdown. The team has been transparent in their communication and have
ensured a safe, hygienic and healthy working environment to support our business functions in the park.”
Global Energy Logistics major at Embassy 247, Mumbai
“Embassy Office Parks is taking really good initiative and efforts in making Embassy Qubix a safe place to work during this
pandemic. Regularly interacting with us and updating us on the action plan, the team is supportive and whenever needed we
found them available. Appreciate the approach and focus Embassy Office Parks team has.”
Fortune 100 Global Telecommunications firm at Embassy Qubix, Pune
“It has been a pleasure being an occupier at Embassy Quadron for over 10 years, we have enjoyed quality office space and
property management service. Your support to keep office campus safe and timely updates on status of campus is really
commendable during this difficult time of COVID-19. We look forward to staying at Embassy Quadron for years to come.”
Indian specialty IT-BPM firm at Embassy Quadron, Pune
“Thanks for sharing regular updates on the COVID-19 status and special mention for calling and updating on the on-goings at park
and seek feedback on our preparedness. It is heartening to see that we are getting timely updates even during the crisis period.”
Fortune 50 Technology major at Embassy Manyata, Bengaluru & Embassy TechZone, Pune
274Q FY2020 Earnings Materials V. Commercial Office Update FIFC, Mumbai
4Q FY2020 Earnings Materials
V. Commercial Office Update

Leasing Highlights for 4Q FY2020
 c.389k sf leased during fourth quarter despite COVID-19 disruptions. Immediate focus is to convert
 c.300k sf LOIs into binding lease contracts
                                   4Q FY2020 Highlights                                Key Leases Signed

New Leases signed (‘000 sf)                                     389     Occupier            Property        City      Area ('000 sf)

                                                                        ANSR          Embassy Manyata     Bengaluru        232
Releasing (‘000 sf)                                              75
                                                                        GlobalLogic   Embassy Oxygen       Noida           72
  ‒ Re-leasing Spread (%)                                       20%     NICE          Embassy TechZone      Pune           27

                                                                        Colliers      Embassy GolfLinks   Bengaluru        21
Renewals (‘000 sf)                                              138
                                                                        Volkswagen    Embassy TechZone      Pune           21
  ‒ Renewals Spread (%)                                         46%
                                                                        Various       Various              Various         17

Non binding LOIs (‘000 sf)                                      c.300   Total                                              389

New Leases & Renewals in 4Q FY2020:

Note: New leases signed includes re-leases, excludes renewals
                                                                                                                            29
4Q FY2020 Earnings Materials
V. Commercial Office Update
Record Leasing in FY2020
Achieved our highest absorption in previous 5 years with c.2.4 msf new leases and c.53% re-leasing
spread. Demand likely to soften in the short-term given COVID-19 disruptions
Particulars FY2020 Average FY2019 FY2018 FY2017 FY2016
Completed Area msf 26.2 (2016-19) 24.8 24.2 23.1 22.5
Occupancy % 92.8% 94.0% 94.3% 93.5% 94.7% 93.4%
New Leases Signed msf 2.4 1.8 1.8 1.3 1.9 2.1
Re-Leasing msf 1.1 0.8 1.2 0.5 1.1 0.3
Re-Leasing Spread % 53% 42.2% 34.9% 35.3% 60.7% 26.6%
Existing Occupier Expansion % 71% 61.8% 59.0% 69.0% 50.0% 71.0%
Renewals msf 0.6 1.9 0.9 2.9 1.6 2.3
c.1.8 msf average new leases signed between FY2016-19 c.42.2% Average re-leasing spread between FY2016-19
60.7%
2.4 53.1%
2.1
1.9
1.8
35.3% 34.9%
26.6%
1.3
FY2016 FY2017 FY2018 FY2019 FY2020 FY2016 FY2017 FY2018 FY2019 FY2020
Re-Leased
Area (msf) Area (msf) 0.3 1.1 0.5 1.2 1.1
Note: New leases signed includes re-leases, excludes renewals
304Q FY2020 Earnings Materials
V. Commercial Office Update
Embedded Mark-to-Market Growth
Of c.1.4 msf ultimate lease expiries in FY2021, advanced lease discussions underway for c.32% of rent
expiries
Market rents are c.30% above in-place rents c.25% of leases expire between FY2021–24
Area Expiring (msf)
Rent (₹ psf / month)
3.1
Average Lease Expiries
~ 6.2% of rents
89
1.4
68 1.2
1.1 1.1
FY2020 FY2021 FY2022 FY2023 FY2024
Mark-to-market
13% 62% 36% 19%
opportunity
Rents Expiring 5.5% 4.4% 8.9% 6.0%
(1)
In-place Rents Market Rents ► FY2021 Expiries: Advanced lease discussions for c.0.4 msf
(c.32% of rent expiries)
Note:
(1) CBRE Research, Embassy REIT 314Q FY2020 Earnings Materials
VI. Development
Update
Embassy Manyata, Bengaluru4Q FY2020 Earnings Materials
VI. Development Update
Development Pipeline
Evaluating potential impact of COVID-19 on supply chain disruptions and labour migration challenges,
likely impact on delivery timelines of c.2.6 msf ongoing on-campus office projects by 1-2 quarters
Development Pipeline(1) (msf) Development Status as of May 19, 2020
Embassy Manyata Occupancy certificate received in
2.4 Jan’20; TIs / fit-out works underway
(NXT, c.0.8 msf ) c.75% or c.594k sf committed
Embassy Oxygen Occupancy certificate received in
Feb’20; TIs / fit-out works underway
(Tower 2, c.0.6 msf ) c.43% or c.246k sf committed(3)
Hudson Block – Design, excavation &
sub-structure works completed; super
Embassy TechZone
structure work initiated
0.9 Ganges Block – Design & excavation
(Hudson, c.0.5 msf) work completed; sub-structure work
1.5 (Ganges, c.0.4 msf) underway
0.6
0.7 Targeting Jun’22 completion
1.0
0.8
Embassy Manyata M3 Block A – Excavation and sub-
0.6
0.5 structure works underway. Targeting
M3 Parcel
Dec’22 completion
(Block A – c.1.0 msf)
FY2019 FY2020 FY2023 FY2024
(2)
Post FY2024 M3 Block B – Pre-construction works
(Block B – c.0.6 msf) initiated. Targeting Jun’23 completion
Embassy Manyata Embassy Oxygen Embassy TechZone
Design completed; excavation and pre-
Recent c.1.4 msf new deliveries over 62% Embassy Oxygen
construction works initiated
committed. No near-term new supply until FY2023 (Tower 1, c.0.7 msf)
Targeting Jun’23 completion
Notes:
(1) Excludes 619 hotel keys across Hilton & Hilton Garden Inn at Embassy Manyata due for delivery in 1Q FY2023 33
(2) Includes acquisition of c.0.6 msf M3 Block B located within overall Embassy Manyata upon building completion in 1Q FY2024
(3) Excludes c.45k sf growth options. Factoring the growth options, area committed would be c.51%. These options are exercisable till Mar’214Q FY2020 Earnings Materials
VI. Development Update
Embassy Manyata (Front Parcel)
NXT office blocks delivered in Dec’19 is c.75% committed. COVID-19 disruptions likely to impact
delivery of 619 key dual branded Hilton hotels by 2 quarters, completion now estimated in Jun’22
Hilton Garden Inn NXT Office Tower 2
(3-Star) 353 keys 392k sf
Hilton 58k sf Retail & NXT Office Tower 1
(5-Star) 266 keys Convention Centre 401k sf
Note: May’20 picture
344Q FY2020 Earnings Materials
VII. Asset Management
Update
Hilton at Embassy GolfLinks, Bengaluru4Q FY2020 Earnings Materials
VII. Asset Management Update
Hospitality Update for 4Q FY2020
Four Seasons achieved break-even occupancy for Jan’20. Since Feb’20, occupancy severely impacted
at both operational hotels due to COVID-19 related travel restrictions and lockdown
Hilton at Embassy GolfLinks Four Seasons at Embassy One Hilton Hotels at Embassy Manyata
247 Keys 230 Keys 619 Keys
5-Star Hotel 5-Star Luxury Hotel 5-Star & 3-Star Hotel
Operations Suspended(1) Operations Suspended(1) Under Construction
4Q Occupancy: c.51% (vs. c.62% in 3Q) 4Q Occupancy: c.24% (vs. c.26% in 3Q) Expected completion in Jun’22
Occupancy in Jan’20 (Pre COVID-19): c.69% Occupancy in Jan’20 (Pre COVID-19): c.36% 100k+ sf Retail & Convention Centre
4Q ADR: ₹9,490 4Q ADR: ₹9,393 ‘Best Hotel Architecture’
4Q RevPAR: ₹4,797 4Q RevPAR: ₹2,298 ‒ by Asia Pacific Property Awards
► Outlook – Hospitality demand likely to be severely impacted in short to medium-term given COVID-19 related travel restrictions
► Action Plan – Instituted several cash conservation measures and safety standards for guests; to re-open based on COVID-19
situation and consequent business travel revival
Impact of COVID-19 induced Hospitality slowdown limited given Hotels contribute < 5% of Embassy REIT’s
GAV, NOI and Distribution
Note:
(1) Both operational hotels were temporarily closed in Mar’20 in accordance with state government guidelines given COVID-19 lock-down 364Q FY2020 Earnings Materials
VII. Asset Management Update
Hospitality Update (Cont’d)
Delivery of U/C 619 key Hilton hotels likely to be impacted by 1-2 quarters, completion now estimated
in Jun’22. Given COVID-19 disruptions, identifying alternate sources to procure interior materials
Hilton Garden Inn: 3-Star Hilton Hotel: 5-Star
353 keys 266 keys
► Hilton – 5 Star (266 keys) at Embassy Manyata
‒ Structure and façade completed. MEP and interior design work stalled, expected to re-commence in Jun’20
► Hilton Garden Inn – 3 Star (353 keys) at Embassy Manyata
‒ Structure completed. Façade, MEP and interior design work stalled, expected to re-commence in Jun’20
Awarded ‘Best Hotel Architecture’ for 2020-21 by Asia Pacific Property Awards
374Q FY2020 Earnings Materials VIII. Financial Update Embassy Quadron, Pune
4Q FY2020 Earnings Materials
VIII. Financial Update
Key Drivers of Net Operating Income
NOI for FY2020 was higher by c.15% YoY with contracted escalations, new lease-up and MTM
contributing over 95% of YoY increase
Net Operating Income (₹ mn) 181 (97)
1,132
1,174
38.8
18,170
15,741
FY2019 Contracted Vacancy lease-up Development Others FY2020
Revenue and MTM
% of NOI increase 48% 47% 7% (2%) NOI Growth YoY
Contracted lease escalation Lease up of c.2.4 msf Lease-up of c.0.5 msf Launch of 230 key Four
on c.8.8 msf across Embassy Manyata, Tower 3 at Embassy Seasons hotel in May’19,
FIFC, Embassy 247, Oxygen hotel under stabilization
Increase in maintenance
Embassy TechZone &
and other contracted Revenue from Solar and
Key income
others
others 15%
Drivers MTM on c.1.1 msf of
ultimate lease expiries at
Embassy Manyata,
Embassy 247 & others
Net of downtime
394Q FY2020 Earnings Materials
VIII. Financial Update
Strong Balance Sheet
At c.15% Net Debt to TEV, our conservative Balance Sheet provides significant flexibility to weather
the near-term COVID-19 impact
Net Asset Value
Net Debt to Capitalization(1)
Particulars (₹ mn) March 31, 2020
Gross Asset Value (GAV)(3,4) 329,746
Net Debt
Add: Other Assets 71,608 ₹79,111
25%
Less: Other Liabilities (54,793)
As of Mar’19
Less: Gross Debt (57,461) (Pre-Listing)
Equity
Net Asset Value (NAV) 289,100 ₹231,500
75%
Number of Units 771,665,343
NAV per Unit (₹) 374.64
Leverage Metrics Net Debt to TEV(2)
Particulars March 31, 2020
Net Debt
Net Debt to TEV 15% ₹47,947
15%
Net Debt to EBITDA 2.7x
Interest Coverage Ratio
As of Mar’20
‒ excluding capitalized interest 5.1x
‒ including capitalized interest 4.0x
Equity
Available Debt Headroom ₹114 bn ₹270,654
85%
Notes:
(1) Computed on listing price of ₹300/unit and excludes ₹47,500 mn cash raised through Initial Public Offering 40
(2) Closing price on National Stock Exchange as at March 31, 2020
(3) GAV per Mar’20 valuation by independent valuer. Valuation exercise undertaken semi-annually. For further details refer notes on slide 52
(4) Given Embassy REIT owns 50% economic interest in GLSP, GAV includes fair value of equity investment in GLSP basis equity valuation method4Q FY2020 Earnings Materials
VIII. Financial Update
Proactive Capital Management
With ₹13.5 bn in existing cash and undrawn committed facilities coupled with negligible near-term
debt repayment obligations, REIT has ample liquidity for business continuity and organic growth
Principal Maturity Schedule (₹ mn)
₹9,514 mn 40,188
Existing Cash Balance(1)
8,333
₹3,997 mn
4,904
Undrawn committed facilities
346 425
AAA / Stable FY2021 FY2022 FY2023 FY2024 FY2025+
Listed Bond Rating by CRISIL Available Debt Headroom
₹161,576
1.3%
Debt Maturity in next 2 years
₹47,947
₹114 bn
Available Debt Headroom (3)
Existing Net Debt Proforma Net Debt Capacity
Notes:
(1) Includes treasury balances, fixed deposits etc., net of 4Q FY2020 distribution of ₹5,137 mn 41
(2) $1 = ₹75
(3) Computed based on Gross Asset Value (GAV ) per Mar’20 valuation by independent valuer4Q FY2020 Earnings Materials
VIII. Financial Update
Portfolio Valuation
Gross Asset Value of the portfolio stood at ₹332 bn with c.92% of value in commercial office segment,
underpinning Embassy REIT’s asset quality
March 31, 2020(1) September 30, 2019(1) Variance
Property Segment
(₹ mn) (₹ mn) (%)
Embassy Manyata Commercial Office 150,106 135,968 10%
Embassy TechZone Commercial Office 21,032 21,325 (1%)
Embassy Oxygen Commercial Office 21,416 20,657 4%
Express Towers Commercial Office 17,866 18,590 (4%)
Embassy 247 Commercial Office 16,624 17,256 (4%)
FIFC Commercial Office 13,911 14,912 (7%)
Embassy Quadron Commercial Office 13,838 14,609 (5%)
Embassy Qubix Commercial Office 10,085 9,962 1%
Embassy Galaxy Commercial Office 8,696 8,914 (2%)
Embassy One Commercial Office 4,897 5,608 (13%)
Four Seasons at Embassy One Hospitality 7,673 8,244 (7%)
Hilton at Embassy GolfLinks Hospitality 4,436 5,045 (12%)
U/C Hilton at Embassy Manyata Hospitality 3,800 3,079 23%
Embassy Energy Others 10,289 10,519 (2%)
Subtotal - Portfolio Asset 304,669 294,688 3%
(2)
Embassy GolfLinks Commercial Office 27,014 26,432 2%
Subtotal - Investment Asset 27,014 26,432 2%
Gross Asset Value 331,683 321,120 3%
Other Assets 69,672 67,140
Other Liabilities (112,254) (98,943)
NAV 289,100 289,317
NAV per unit 374.64 374.93 (0.1%)
Notes: As per Mar’20 valuation by independent valuer. Valuation exercise undertaken semi-annually. For further details refer notes on slide 52
Given the COVID-19 related uncertainties and any impact on real estate market, the independent valuers have, as a precautionary measure, referenced material valuation uncertainty in arriving at their valuation 42
(1) Includes completed, under construction & proposed future development
(2) Details include 50% GLSP. Embassy REIT owns 50% economic interest in GLSP4Q FY2020 Earnings Materials IX. Looking Ahead Embassy Qubix, Pune
4Q FY2020 Earnings Materials
IX. Looking Ahead
Resilient Business – Navigating COVID-19 Impact
Our high-quality properties, diverse creditworthy occupiers and disciplined balance sheet will help in
navigating near-term COVID-19 challenges
Landlord of choice with a high-quality difficult-to-replicate office portfolio in gateway cities providing
total business ecosystem
Diversified & high credit quality occupier base c.78% MNCs, c.42% Fortune 500 companies
Strong Occupier
Portfolio c.92% value in rent yielding office assets, hotels contributed only c.0.6% to NOI in FY2020
Stable cash flows expected due to long-term lease structure (WALE of 7.0 years) and contracted
rental escalations, with only c.5.5% of leases due for expiry in FY2021
Ample liquidity with ₹9,514 mn existing cash and ₹3,997 mn undrawn committed facilities
c.15% Net Debt to TEV with only c.1.3% debt maturities until 1Q FY2023
Robust Financial
Position ICRA AAA (Stable) and CRISIL AAA / Stable credit ratings(2), reaffirmed as of May’20
Additional ₹114 bn debt headroom provides significant flexibility to access capital, if needed
Proactive management of leases with focus on occupier retention and rent collections, only 6%(1)
occupiers from directly impacted sectors
Proactive Asset Hands-on institutional approach ensuring occupier business continuity, employee wellness & safety
Management
Leverage from industry-level consolidation & Grade A supply shrinkage in next 2-3 years
Disciplined approach in reducing costs and discretionary capital expenditure
Our high-quality portfolio is resilient and well positioned for the medium-term
Notes:
(1) Occupiers related to co-working, hospitality, aviation & retail sectors 44
(2) Credit ratings by ICRA and CRISIL for Embassy REIT as Issuer and for ₹36.5 bn Listed Bond respectively4Q FY2020 Earnings Materials
IX. Looking Ahead
Our Strategy remains unchanged
We continue to focus on maintaining high occupancy levels and maximizing NOI, growing our existing
campuses and prudently managing our capital
On-Campus Capital
Leasing Acquisitions
Development Management
Capitalize on record
Deliver ongoing campus Actively seek
absorption and market Build leverage
development ahead of opportunistic
momentum for Indian selectively
Pre schedule acquisitions (3rd party,
commercial office space
COVID-19 ROFO) Quarterly distribution
Bring forward new
Actively manage lease with minimum 90% of
development in line with Undertake value
expiries to achieve NDCF to be distributed
anticipated demand accretive acquisitions
MTM upside
Deepen dialogue, focus Continue with ongoing
on occupier retention c.2.6 msf early stage Continue to evaluate Maintain prudent
development projects, opportunities which are leverage levels
Proactive lease
renewals and rent monitor capex financing strategic and accretive Focus on cash
Now
collections Monitor market Monitor volatile optimization
Deliver c.7.1 msf dynamics prior to financing markets Continue to pay
contracted escalations, committing any closely distribution
convert c.300k sf LOIs additional development
Continue to support critical business continuity of existing occupiers and increased wellness & safety needs
454Q FY2020 Earnings Materials X. Appendix Embassy Galaxy, Noida
4Q FY2020 Earnings Materials
X. Appendix

Portfolio Summary
  c.26.2 msf completed Grade A office assets (c.92.8% occupied, 7.0 years WALE, c.30% MTM opportunity)

                                                             Leasable Area (msf)/Keys/MW                                  WALE(3)          Occupancy                       Rent (₹ psf / mth)                       GAV(4)

               Property                        Completed               Development                   Total                 (yrs)                (%)             In-place        Market          MTM (%)    ₹ mn          % of total

Embassy Manyata                                    11.8                      3.1                      14.8                  7.7               97.7%                   60          90             51%      150,106            45%
                     (1)
Embassy GolfLinks                                   2.7                       -                       2.7                   8.9               98.3%               115            148             29%      27,014             8%

Embassy One                                         0.3                       -                       0.3                   8.9                5.5%               156            147             (6%)      4,897             1%

Bengaluru Sub-total                                14.7                      3.1                     17.8                   8.0               96.2%               70             101             44%      182,017            55%

Express Towers                                      0.5                       -                       0.5                   4.6               93.5%               256            270              5%      17,866             5%

Embassy 247                                         1.2                       -                       1.2                   4.0               90.2%                   99         110             11%      16,624             5%

FIFC                                                0.4                       -                       0.4                   4.0               77.8%               297            285             (4%)     13,911             4%

Mumbai Sub-total                                   2.0                        -                       2.0                   4.2               88.8%               169            177              5%      48,401             15%

Embassy TechZone                                    2.2                      3.3                      5.5                   5.6               93.9%                   50          48             (3%)     21,032             6%

Embassy Quadron                                     1.9                       -                       1.9                   4.2               78.4%                   43          48             11%      13,838             4%

Embassy Qubix                                       1.5                       -                       1.5                   5.1               99.8%                   39          48             23%      10,085             3%

Pune Sub-total                                     5.5                       3.3                      8.8                   5.1               90.1%               45              48              8%      44,955             14%

Embassy Oxygen                                      2.5                      0.7                      3.3                  11.0               78.5%                   48          54             13%      21,416             6%

Embassy Galaxy                                      1.4                       -                       1.4                   3.1               98.9%                   34          45             34%       8,696             3%

Noida Sub-total                                    3.9                       0.7                      4.6                   8.4               85.6%               42              50             19%      30,112              9%

Subtotal (Office)                                  26.2                      7.1                     33.3                   7.0               92.8%               68              89             30%      305,485            92%
                                   (2)                                                                                                               (5)
Four Seasons at Embassy One                     230 Keys                      -                    230 Keys                  -                17%                     -            -               -       7,673             2%
                                                                                                                                                     (5)
Hilton at Embassy GolfLinks                     247 Keys                      -                    247 Keys                  -                64%                     -            -               -       4,436             1%

Hilton at Embassy
                                                     -                   619 Keys                  619 Keys                  -                   -                    -            -               -       3,800             1%
Manyata (5 & 3 star)

Embassy Energy                                   100MW                        -                     100MW                    -                   -                    -            -               -      10,289             3%

Subtotal (Infrastructure Assets)           477 Keys / 100MW              619 Keys            1096 Keys / 100MW                                                                                            26,198              8%

                                          26.2 msf / 477 Keys /                             33.3 msf / 1096 Keys
Total                                                               7.1 msf / 619 Keys                                                                                                                    331,683            100%
                                                100MW                                             / 100MW

Notes:
(1)    Details included in the above table are for 100% stake in Embassy GolfLinks, except GAV which reflects only our 50% economic interest
(2)    Four Seasons at Embassy One was launched in May'19 and is under stabilization                                                                                                                                         47
(3)    Weighted against Gross Rentals assuming occupier exercise their renewal options after the end of the initial commitment period
(4)    Gross Asset Value (GAV) per Mar’20 valuation by independent valuer. Valuation exercise undertaken semi-annually. For further details refer notes on slide 52
(5)    Represents occupancy for FY2020 / average since launch in May’19 for Four Seasons at Embassy One
4Q FY2020 Earnings Materials
X. Appendix
Walkdown of Key Financial Metrics
(Amount in ₹ mn)
For the Quarter ended For the Financial Year ended
4Q FY2020 4Q FY2019 Variance (%) FY2020 FY2019 Variance (%)
Revenue from Operations 5,434 5,011 8% 21,449 18,771 14%
NOI
Property Taxes and Insurance (210) (478) (56%) (771) (970) (21%)
Direct Operating Expenses (605) (332) 82% (2,509) (2,059) 22%
Net Operating Income 4,618 4,200 10% 18,170 15,741 15%
Other Income 697 367 90% 1,293 1,539 (16%)
NDCF at SPV level
Property Management Fees (1) (127) (77) 65% (486) (303) 61%
Indirect Operating Expenses (168) (645) (74%) (660) (1,747) (62%)
EBITDA 5,021 3,845 31% 18,316 15,231 20%
Distribution
Working Capital Adjustments 679 1,126 NR 1,969 30 NR
Cash Taxes (343) (383) (10%) (1,381) (1,863) (26%)
(2)
Other Adjustments (732) (218) 235% (1,500) (1,034) 45%
Cash Flow from Operating Activities 4,624 4,369 6% 17,403 12,364 41%
External Debt (Interest & Principal) (403) NA NA (1,515) NA NA
Other Income from Investments 642 NA NA 1,054 NA NA
NDCF at SPV level 4,863 NA NA 16,943 NA NA
Distribution from SPVs to REIT 4,885 NA NA 17,206 NA NA
Distribution from Embassy Golflinks 480 NA NA 1,920 NA NA
(1)
REIT Management Fees (56) NA NA (215) NA NA
Other Inflows at REIT level (Net of Expenses) 5 NA NA (45) NA NA
NDCF at REIT level 5,314 NA NA 18,866 NA NA
Distribution 5,317 NA NA 18,821 NA NA
Notes: Walkdown of Financial Metrics upto 'NDCF (SPV Level)' represents financial numbers of all SPV's consolidated excluding Trust standalone numbers
Figures for 4Q FY2020 are basis audited condensed consolidated financials. Figures for 4Q FY2019 are basis unaudited combined financials and may not be comparable. For further details refer notes on slide 52 48
(1) Property management fees includes c.3% of facility rentals from only Commercial Office segment and does not include fees on Hospitality and Other segments and REIT Management Fees is c.1% of REIT distribution
(2) Mainly includes income from investments, dividend income & other non-cash income / expensesYou can also read