Embassy Office Parks REIT - 3Q FY2021 Earnings Materials February 12, 2021
←
→
Page content transcription
If your browser does not render page correctly, please read the page content below
Embassy Office Parks REIT
3Q FY2021 Earnings Materials
February 12, 2021

                               1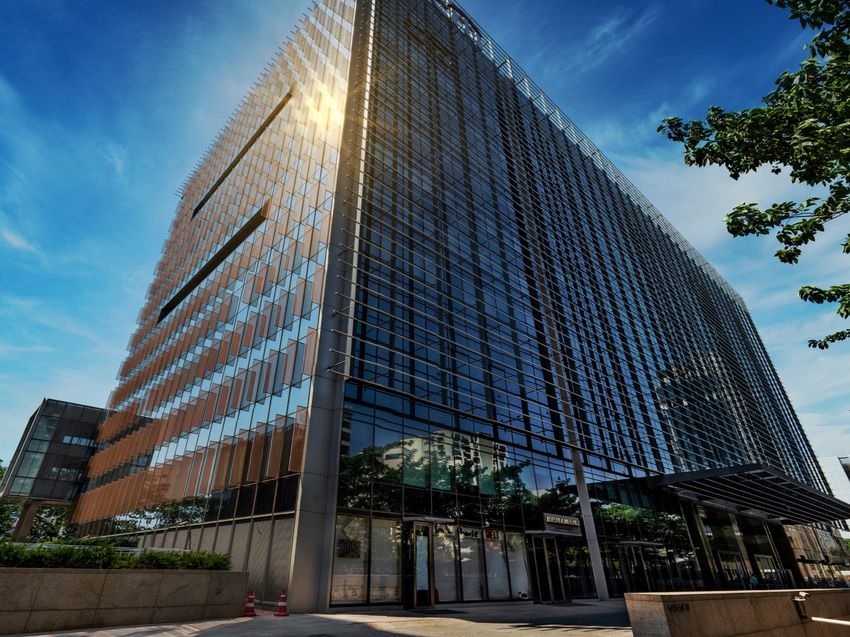
3Q FY2021 Earnings Materials

Press Release
Embassy REIT Announces Third Quarter FY2020-21 Results and Quarterly
Distributions of ₹4,313 million
Bengaluru, India, February 12, 2021

Embassy Office Parks REIT (NSE: EMBASSY / BSE: 542602) (‘Embassy REIT’), India’s first listed REIT and the largest office REIT
in Asia by area, reported results today for the third quarter ended December 31, 2020.

The Board of Directors of Embassy Office Parks Management Services Private Limited (‘EOPMSPL’), Manager to Embassy REIT, at
its Board Meeting held earlier today, declared a distribution of ₹4,313 million for 3Q FY2021. This translates to a Distribution per Unit
(‘DPU’) of ₹4.55 for the third quarter on the expanded unit base of 947.89 million units, post the issuance of 176.23 million new units
in December 2020 in connection with the acquisition of Embassy TechVillage (‘ETV’). The record date for the distribution is February
22, 2021 and the distribution will be paid on or before February 27, 2021.

Michael Holland, Chief Executive Officer of Embassy REIT commented, “This quarter marked another resilient performance for
Embassy REIT, as illustrated by our operating performance and distribution to Unitholders. As India’s outlook steadily improves with a
continued downward trend in active COVID-19 cases and the encouraging progress on vaccine roll-out, we remain optimistic that
Indian office leasing demand will continue to increase as occupiers accelerate their return-to-work programs. Additionally, our recent
successful ₹97.8 billion acquisition of Embassy TechVillage in India’s best-performing office sub-market of ORR in Bengaluru
cements our position as a landlord of choice for the world’s top companies.”

Financial Highlights
•    Net Operating Income (‘NOI’) for 3Q FY2021 grew year-on-year by 3% to ₹4,780 million and cumulatively by 5% to ₹14,163
     million for YTD FY2021, with operating margins of 85% for the quarter and 87% for YTD FY2021
•    Distributed ₹4,313 million or ₹4.55 per unit for 3Q FY2021 and cumulatively ₹13,056 million or ₹15.88 per unit for YTD FY2021,
     representing a 100% payout ratio for both the periods
•    Raised ₹7.5 billion of listed debentures during 3Q FY2021 at an attractive 6.70% coupon; raised further ₹26.0 billion of listed
     debentures in Jan’21 at 6.40% coupon primarily to refinance the ETV debt
•    Balance sheet remains strong with low leverage of 23% Net Debt to TEV, liquidity of ₹9.4 billion and additional debt headroom of
     ₹120 billion

                                                                                                                                   2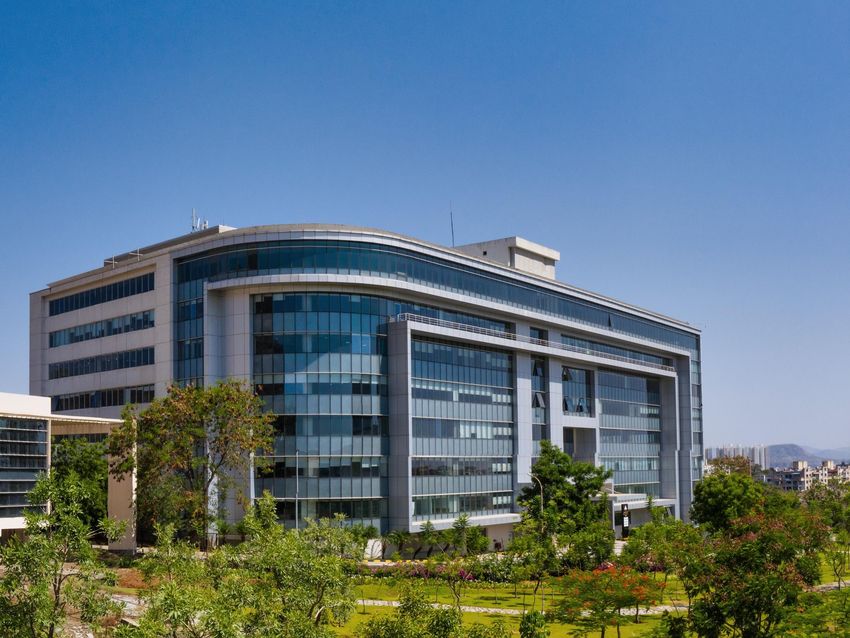
3Q FY2021 Earnings Materials

Press Release (Cont’d)
Business Highlights
•   Lease deals signed for 3Q FY2021 stood at 311k sf, with 1.0 msf lease deals signed YTD
•   Achieved 13% spreads on 206k sf re-leased area in 3Q FY2021, with 16% spreads on 450k sf re-leased YTD
•   Achieved rental increases of 15% on 1.5 msf in 3Q FY2021, with YTD rental increases of 13% on 5.3 msf
•   Rent collections for 3Q FY2021 from office occupiers remained strong at 99.5%, in-line with office rent collections of 100% for
    1Q FY2021 and 99.9% for 2Q FY2021 (as of February 11, 2021)
•   Portfolio occupancy stood at 90.6% on our enlarged 32.3 msf operating portfolio, with same-store occupancy of 90.5%
•   Ongoing support to occupiers as they bring forward ‘Back to Office’ plans encouraged by vaccine roll-out; 97% of occupiers and
    daily average of ~20k employees operated from our properties in 3Q FY2021, up 27% since 2Q FY2021

Growth Initiatives
•   Completed ₹97.8 billion ETV acquisition in December 2020 and successfully raised ₹36.8 billion through an Institutional
    Placement to fund the acquisition
•   Post ETV acquisition, integrated on-ground teams and the 1.1 msf built-to-suit project, initiated restructuring of the 2-tier holdings
    at the ETV level and refinanced ₹26.4 billion of in-place ETV debt at 328 bps refinancing spread
•   Launched 1.9 msf of new on-campus office development at ETV. Along with the existing 2.7 msf development, organic growth
    through 5.7 msf on-campus development across portfolio, with 19% area pre-committed to JP Morgan

Investor Materials and Quarterly Investor Call Details
Embassy REIT has released a package of information on the quarterly results and performance, that includes (i) reviewed condensed
standalone and reviewed condensed consolidated financial statements for the quarter and nine month period ended December 31,
2020, (ii) an earnings presentation covering 3Q FY2021 results, and (iii) supplemental operating and financial data book that is in line
with leading reporting practices across global REITs. All these materials are available on our website at
www.embassyofficeparks.com under the “Investors” section.

Embassy REIT will host a conference call on February 12, 2021 at 18:30 hours Indian Standard Time to discuss the 3Q FY2021
results. A replay of the call will be available till February 26, 2021 on our website at www.embassyofficeparks.com under the
“Investors” section.

                                                                                                                                    3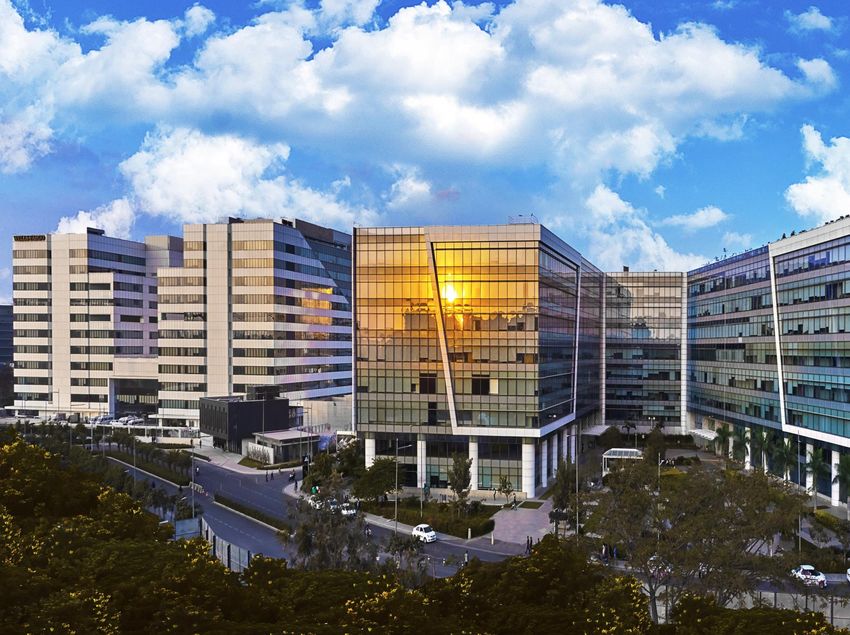
3Q FY2021 Earnings Materials

Table of Contents
 I.            Key Highlights             5

 II.           Overview                   11

 III.          Market Outlook             20

 IV.           Navigating COVID-19        25

 V.            Commercial Office Update   28

 VI.           Development Update         33

 VII.          Acquisition Update         37

 VIII.         Asset Management Update    41

 IX.           Financial Update           45

 X.            Appendix                   49

                                               4
3Q FY2021 Earnings Materials

I. Key Highlights

Embassy TechVillage, Bengaluru
3Q FY2021 Earnings Materials
I. Key Highlights
Business Highlights
Successfully acquired ETV for ₹97.8 bn. Delivered resilient operating performance in Q3 with robust
rent collections, stable occupancy and new growth cycle through 5.7 msf on-campus development
Ongoing support to occupiers as they bring forward ‘Back to Office’ plans encouraged by vaccine roll-out
Business Continuity ‒ 97% of occupiers and 20k employees operated from our properties in Q3, up 27% since Q2
and Resilience
Rent collections for Q3 remained strong at 99.5%, in-line with office rent collections of 100% for Q1 and
99.9% for Q2
Lease deals signed for Q3 stood at 311k sf across 11 deals, with YTD lease deals signed at 1.0 msf
across 36 deals
Achieved 14% spread on 206k sf re-leased in Q3, with 16% spread on 450k sf re-leased in YTD FY2021
Leasing and Lease
Management Achieved rental increases of 15% on 1.5 msf in Q3 across 24 office leases, with YTD rental increases of
13% on 5.3 msf across 66 office leases
Portfolio occupancy stood at 90.6% on enlarged 32.3 msf operating portfolio, with same-store occupancy
of 90.5%
Organic growth through 5.7 msf on-campus development, 19% pre-committed to JP Morgan
‒ Launched 1.9 msf of new on-campus office development at ETV
Development
‒ Integrated 1.1 msf JP Morgan built-to-suit project, on track for Sep’21 delivery
‒ Construction activity continued at pace on existing 2.7 msf development
Completed ₹97.8 bn ETV Acquisition in Dec’20, successfully raised ₹36.8 bn equity through an
Institutional Placement
Acquisitions
Post ETV acquisition, refinanced ₹26.4 bn of in-place ETV debt at 328 bps refinancing spread
Integrated on-ground teams and initiated restructuring 2-tier holdings at the ETV level
6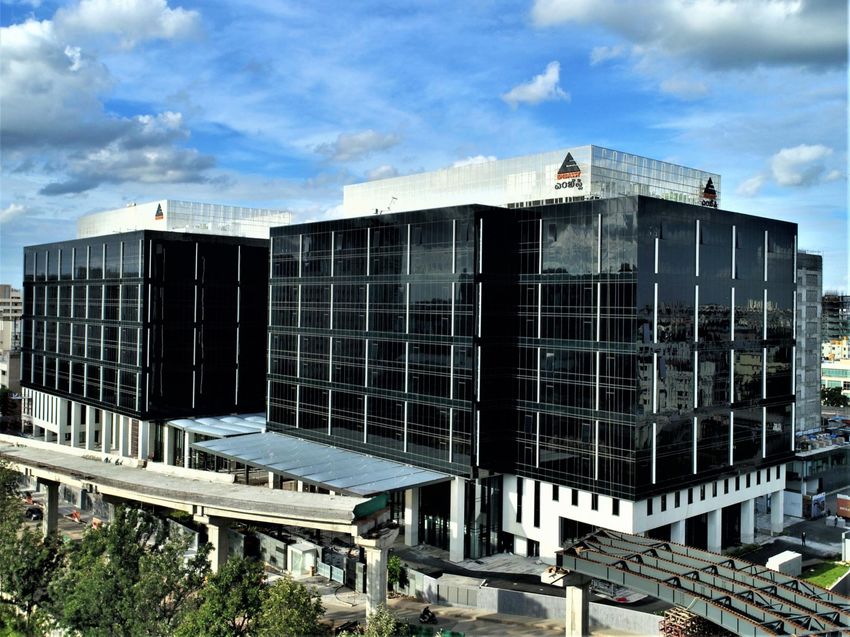
3Q FY2021 Earnings Materials
I. Key Highlights
Financial Highlights 3Q FY2021
NOI and EBITDA for Q3 up 3% and 8% year-on-year respectively with NOI margin at 85%. Distribution
for Q3 stood at ₹4,313 mn
3Q FY2021 3Q FY2020
Variance % Remarks
(mn) (mn)
Contracted rental escalations on 6.9 msf
Revenue from 1.4 msf of new deliveries in 4Q FY2020
Revenue
Increase in CAM and other operating revenues
from ₹5,653 ₹5,459 +4% Partially offset by:
Operations ‒ Decrease in commercial office revenues due to exits
‒ Decrease in hotel revenues due to COVID-19 impact(3)
NOI ₹4,780 ₹4,639
+3% Increase in Revenue from Operations
Margin (%) 85% 85%
Increase in NOI
EBITDA ₹4,830 ₹4,462
Interest income on purchase consideration advanced for
+8% Embassy Manyata M3 Block B
Margin (%) 85% 82% Savings due to cost optimization initiatives
Distribution ₹4,313 ₹4,707
Distribution of ₹4,313 mn for 3Q FY2021
(8%) ‒ Represents payout ratio of 100% of NDCF at REIT level
Payout ratio 100% 100%
Notes:
(1) Above financial results exclude Revenue, NOI and EBITDA from Embassy GolfLinks since Embassy REIT owns 50% economic interest in GLSP. GLSP NOI in 3Q FY2021 was up 10% year-on-year 7
(2) ETV was acquired on December 24, 2020 by Embassy REIT. The relevant asset SPVs and Holdco holding ETV have been consolidated from December 31, 2020, a date close to the acquisition date, as there are no significant
transactions or events that have occurred between December 24, 2020 and December 31, 2020 and the effect thereof is not consi dered to be material to the results for the quarter and nine month period ended Dec’20
(3) Both operational hotels were temporarily closed in Mar’20 in accordance with state government guidelines given COVID-19 lock-down and subsequently reopened in Jun’20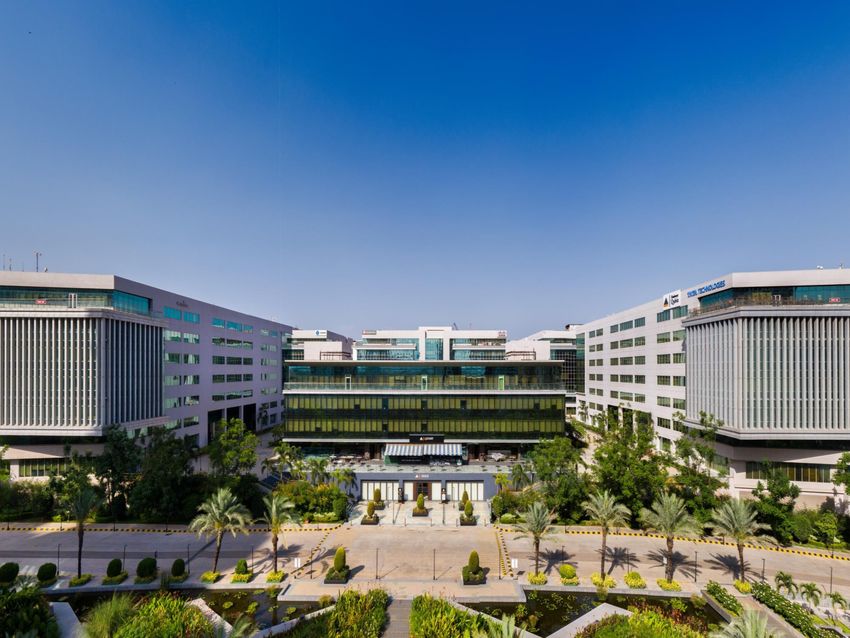
3Q FY2021 Earnings Materials
I. Key Highlights
Financial Highlights YTD FY2021
NOI and EBITDA for YTD FY2021 up 5% and 8% year-on-year respectively with NOI margin at 87%.
Distribution for YTD FY2021 stood at ₹13,056 mn
YTD FY2021 YTD FY2020
Variance % Remarks
(mn) (mn)
Contracted rental escalations on 8.1 msf
Revenue from 1.4 msf of new deliveries in 4Q FY2020
Increase in CAM and other operating revenues
Revenue
Partially offset by:
from ₹16,217 ₹16,016 +1% ‒
Decrease in commercial office revenues due to exits
Operations ‒ Decrease in hotel revenues due to COVID-19 impact(3)
One-off items(4) in PY; adjusted for these one-off items,
revenue would have been higher by 3% YoY
NOI ₹14,163 ₹13,551 Increase in Revenue from Operations
+5% Savings due to cost optimization initiatives
Margin (%) 87% 85% Lower hotel, power & fuel expenses
Increase in NOI
EBITDA ₹14,067 ₹13,025
Interest Income on purchase consideration advanced for
+8% Embassy Manyata M3 Block B
Margin (%) 87% 81% Savings in corporate overheads
Distribution ₹13,056 ₹13,504 Distribution of ₹13,056 mn for YTD FY2021
(3%) ‒ Represents payout ratio of 100% of NDCF at REIT level
Payout ratio 100% 100%
Notes
(1) Above financial results exclude Revenue, NOI and EBITDA from Embassy GolfLinks since Embassy REIT owns 50% economic interest in GLSP. GLSP NOI in YTD FY2021 was up 7% year-on-year
(2) ETV was acquired on December 24, 2020 by Embassy REIT. The relevant asset SPVs and Holdco holding ETV have been consolidated from December 31, 2020, a date close to the acquisition date, as there are no significant 8
transactions or events that have occurred between December 24, 2020 and December 31, 2020 and the effect thereof is not consi dered to be material to the results for the quarter and nine month period ended Dec’20
(3) Both operational hotels were temporarily closed in Mar’20 in accordance with state government guidelines given COVID-19 lock-down and subsequently reopened in Jun’20
(4) One-time surrender premium of ₹300 mn received from an occupier of Embassy TechZone during YTD FY2020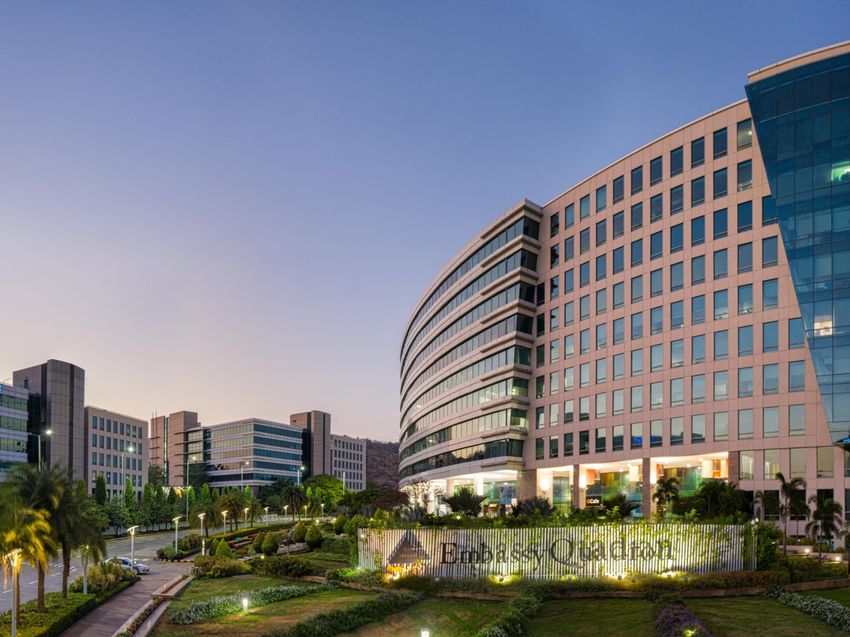
3Q FY2021 Earnings Materials
I. Key Highlights

Distribution Overview
  Distribution for Q3 stood at ₹4,313 mn i.e. ₹4.55 per unit(1) representing a 100% payout ratio.
  Scheduled payment date is on or before February 27, 2021
  Particulars                                                                                                                     3Q FY2021                                                       YTD FY2021

  Distribution period                                                                                                         Oct'20 – Dec'20                                                  Apr'20 – Dec'20

  Distribution amount (mn)                                                                                                            ₹4,313                                                          ₹13,056

                                                                                                                                                                                                 Q1 & Q2: 772
  Outstanding units (mn)                                                                                                                948
                                                                                                                                                                                                   Q3: 948

  Distribution per unit
                                  (1)
                                        (DPU)                                                                                          ₹4.55                                                           ₹15.88

    - Interest                                                                                                                        ₹2.03                                                             ₹6.07

    - Dividend                                                                                                                        ₹0.02                                                             ₹0.80

    - Amortization of SPV level debt                                                                                                  ₹2.50                                                             ₹9.01

  Announcement date                                                                                                         February 12, 2021                                                               -

  Record date                                                                                                               February 22, 2021                                                               -

  Payment date                                                                                                    On or before February 27, 2021                                                             -

             Embassy REIT is committed to regular quarterly distribution to Unitholders with minimum 90% of Net
                                   Distributable Cash Flows (‘NDCF’) to be distributed

Note:
(1)   DPU for 3Q FY2021 factors 176.23 mn new units issued pursuant to the preferential allotment and the institutional placement in connection with the ETV acquisition. However, given ETV acquisition was completed on   9
      December 24, 2020, and given relevant asset SPVs and Holdco holding ETV have been consolidated from December 31, 2020, there has not been any corresponding increase in 3Q FY2021 distribution due to ETV
      acquisition. For comparability purposes, the Proforma DPU excluding 176.23 mn new units issued in Dec’20 is ₹5.59 per unit for 3Q FY2021 and ₹16.92 per unit for YTD FY2021
3Q FY2021 Earnings Materials
I. Key Highlights

FY2021 Guidance post ETV acquisition
 DPU Guidance for Initial portfolio increased to ₹22.25 per unit for FY2021 (up by ₹0.21 per unit).
 Revised DPU guidance for Current portfolio (post ETV acquisition) at ₹21.45 per unit for FY2021

                                              Guidance Update                                                                                                          Guidance Reconciliation

                                                                    Mid-Point

                                                                                             Revised Guidance                                                                                               Units
                                      Initial                Revised Guidance                                                                                                           NOI Distribution                                DPU
Particulars                                                                                     on Current                      Particulars                                                              outstanding
                                     Guidance                on Initial Portfolio                                                                                                      (₹ mn)  (₹ mn)                                    (₹)
                                                                                                 Portfolio                                                                                                   (mn)
                                     (Nov'20)                     (Feb'21)
                                                                                                  (Feb'21)

                                                                                                                                Initial Guidance as at
NOI                                              19,005                         19,005                         20,314                                                                   19,005             17,010              772      22.04
                                                                                                                                Nov 02, 2020

                                                                                                                                (+) Update in assumptions for Initial
NDCF                                             17,010                         17,170                         18,340                                                                        -                  160            772          0.21
                                                                                                                                portfolio

                                                                                                                                Revised Guidance as at
Distribution(3)                                  17,010                         17,170                         18,340                                                                   19,005             17,170              772      22.25
                                                                                                                                Feb 12, 2021 (Initial portfolio)

                                                                                                              H1 - 772          (-) Factoring 176.23 mn new units
No. of Units (mn)                                     772                            772                                                                                                     -                   -             948      (1.04)
                                                                                                              H2 - 948          issued during ETV acquisition(2)

DPU                                                22.04                          22.25                          21.45          (+) Increase due to ETV acquisition                      1,309               1,170             948          0.24

                                                                                                                                Revised Guidance as at
Proforma DPU(4)                                        NA                             NA                         22.49                                                                  20,314             18,340              948      21.45
                                                                                                                                Feb 12, 2021 (Current portfolio)

Notes:
(1)   Initial portfolio refers to Embassy REIT’s portfolio of 33.3 msf prior to ETV acquisition in Dec'20. Current portfolio refers to Embassy REIT’s enlarged portfolio of 42.4 msf post factoring ETV acquisition on December
      24, 2020
(2)   Increase in units due to issue of units through an Institutional Placement aggregating to ₹36,852.02 million, comprising 111.34 million units at a price of ₹331.00 per unit to institutional investors and issue of units
      through a Preferential Issue of 64.89 million units at a price of ₹356.70 per unit to the third-party shareholders of VTPL aggregating to ₹23,147.33 million as consideration for the transfer of their shareholding in ETV to
      the Embassy REIT
(3)   Assumes 100% payout ratio for 4Q FY2021 and includes actual payout for nine month period ended December 31, 2020
                                                                                                                                                                                                                                       10
(4)   DPU computed for three and nine month period ended Dec’20 excluding 176.23 mn new units issued pursuant to the preferential allotment and the institutional placement of units in connection with ETV acquisition.
      For comparability purposes, the Proforma DPU excluding 176.23 mn new units issued in Dec’20 is ₹5.59 per unit for 3Q FY2021 and ₹16.92 per unit for YTD FY2021
3Q FY2021 Earnings Materials II. Overview Express Towers, Mumbai
3Q FY2021 Earnings Materials
II. Overview

Who We Are: Quick Facts
  We run a commercial office portfolio that serves as essential corporate infrastructure to global
  occupiers, including many Fortune 500 corporations

      42.4 msf(1)                                      200                                 90.6%
           Portfolio                               Blue-chip                             Occupancy
                                                   occupiers

               12                                  1,614(1)                              100 MW                                                                          NCR (7%)

       Commercial                                 Hotel Keys                              Solar Park
         Offices

             29%                                      48%                              7.1 Years                                                Mumbai (11%)

    Mark-to-Market                              Gross Rents                                   WALE                                                  Pune (10%)
       Upside                                  from Fortune
                                               500 occupiers

                                                                                                                                                                            Bengaluru (72%)

   ₹16,217 mn                               ₹13,056 mn                                        23%
      YTD FY2021                                YTD FY2021                               Net Debt to
     Revenue from                               Distribution                                TEV
      Operations
Notes: City wise split by % of Gross Asset Value (GAV) considered per Sep’20 valuation undertaken by iVAS Partners, represented by Mr. Manish Gupta, in conjunction with value assessment services undertaken by CBRE.
Valuation exercise undertaken semi-annually. For further details refer notes on slide 55                                                                                                                                 12
(1)    Includes completed, under construction and proposed future development
3Q FY2021 Earnings Materials
II. Overview
Eight Infrastructure-like Office Parks (40.1 msf)(1)
Embassy Manyata Embassy TechVillage
Bengaluru (14.8 msf) Bengaluru (9.2 msf)
Embassy Golflinks
GolfLinks Embassy Quadron Embassy TechZone
Bengaluru (2.7 msf) Pune (1.9 msf) Pune (5.5 msf)
Embassy Oxygen Embassy Galaxy Embassy Qubix
Noida (3.3 msf) Noida (1.4 msf) Pune (1.5 msf)
Note:
(1) Includes completed, under construction and proposed future development 133Q FY2021 Earnings Materials
II. Overview
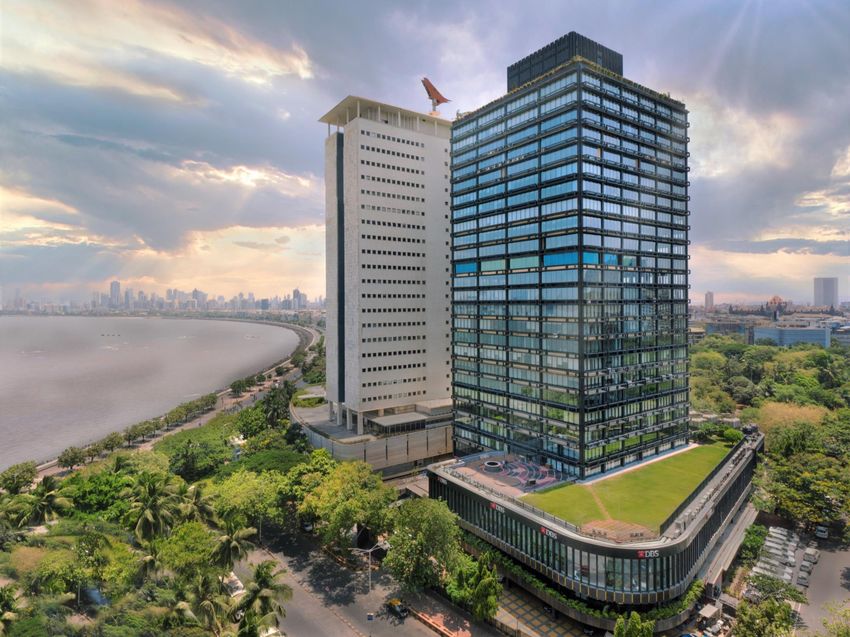
Four Prime City-center Offices (2.3 msf)
Express Towers FIFC
Mumbai (0.5 msf) Mumbai (0.4 msf)
Embassy 247 Embassy One
Mumbai (1.2 msf) Bengaluru (0.3 msf)
143Q FY2021 Earnings Materials
II. Overview
What We Do: Our Strategy
Maximize distribution and NAV per unit through organic growth and new acquisitions
4
Capital
Management
3
Acquisitions Build leverage
2 selectively
On-campus Use strong balance
Capitalize on
1 Development sheet to drive accretive
fragmented office
growth through
market and undertake
Leasing Deliver 10.1(1) msf on-
disciplined acquisitions
value accretive
campus development acquisitions Quarterly distribution
with minimum 90% of
Grow NOI by leasing Proactive pre-leasing to Pan-India acquisition
NDCF to be distributed
existing vacancy de-risk new potential from 3rd parties
development Low expenses and fees
Manage lease expiries 31.2 msf of ROFO
Select infrastructure
enhancing Unitholders’
& capture mark-to- opportunity from
ancillary projects value
market upside Embassy Sponsor and
(hotels, flyovers etc.) to upto 4.2 msf of ROFO
Experienced on-ground increase entry barriers opportunity from others
teams & hands-on
approach to leasing Provide ‘total business
ecosystem’
Best-in-class occupier
engagement
Proactive asset management to drive value with strong corporate governance
Note:
(1) Includes U/C area of 5.7 msf and proposed future development of 4.4 msf 153Q FY2021 Earnings Materials
II. Overview
Our Opportunity: India as the Global Technology Innovation Hub
India continues to attract global technology companies due to availability of highly educated and
skilled talent at a reasonable cost
India Advantage FY2020 Performance(2) Evolving Technology Landscape
India leads in STEM(1)
$191 bn Services
(7.7% growth) • Information Technology • Engineering R&D
talent for technology
Talent assignments • BPM • Digital and Media
Availability Revenue
Over 2 million(2) students
graduating each year
$147 bn
(8.1% growth) Software
• Systems • Cybersecurity
Employee cost in India is
around 20-25% of Exports • Enterprise • Fintech / Edtech
Cost
Advantage comparable costs in
occupier’s country of
origin(3)
$44 bn
eCommerce / Omni Channel Retail
(7.3% growth)
• Social Shopping • Intelligence
India is one of the most Domestic • Voice Commerce • Digital Payments
affordable office markets Revenue
globally
Affordable
‒ Average rentals of $1
Rentals 4.4 mn
psf / month(3) Technologies
(4.9% growth) • Cloud / Robotics • Blockchain
Rental costs merely 2-6%
of occupier revenues(3) • Intelligent Automation • Reality AR / VR
Employees
Notes:
(1) STEM refers to Science, Technology, Engineering, Mathematics 16
(2) Source: NASSCOM - The Technology Sector in India: Strategic Review 2020 (Techade – the new decade)
(3) Source: CBRE Research, ICICI Securities Research, Embassy REIT3Q FY2021 Earnings Materials
II. Overview
Our Opportunity: Technology Sector Resiliency and Growth
COVID-19 response has accelerated digital transformation and technology spends globally. Increased
costs and scaling pressures likely to further increase offshoring to India
Digital Tech spends to witness exponential growth GCCs expected to expand similar to post GFC
Global Digital Transformation Spends (USD Bn)(1) Number of GCCs in India(2)
1,470
1,400
879 1,250
1,182
789
981
647
506
620
413
337
285
2020E 2021E 2022E 2023E 2024E 2025E Pre-2000 2005 2010 2015 2019 2020 2021E
Strong performance by technology businesses throughout COVID-19 pandemic
‒ Acceleration of digital transformation globally, and
‒ Bring-forward of technology spends, especially for cloud, digital, data services and cyber security
Indian IT industry expected to grow at a 13% CAGR to $350 billion by 2025(2), given
‒ Focus on Business Continuity Plan (BCP) and increased cost pressures on global businesses
Similar trend witnessed post 2008 Global Financial Crisis (GFC) with record absorption by GCCs
Source:
(1) Morgan Stanley Global Insights, ‘Stronger for Longer in Digital Transformation, Sept 2020’ 17
(2) NASSCOM Research, C&W Research3Q FY2021 Earnings Materials
II. Overview
Our Occupier Base
Global business with a diversified, resilient and high credit-quality occupier base
Industry Diversification(1) 38% of Gross Rentals From Top 10 Occupiers
Financial Services
14%
Top 10 % of
Sector
Occupiers Rentals
Technology
43%
Global Technology
Technology 10%
Others & Consulting Major
JP Morgan 13%
Cognizant Technology 7%
PwC
NTT Data Technology 3%
Research, Flipkart E-commerce 3%
Facebook Consulting &
Analytics JP Morgan Financial Services 3%
Sony 9%
Wells Fargo Financial Services 3%
MetLife NOKIA
ANSR Research & Analytics 3%
Healthcare
6%
Cerner Healthcare 2%
Telecom PwC Research & Analytics 2%
5%
E-Commerce Wework Co-working 2%
Retail
5%
5%
Total 38%
Notes: Actual legal entity names of occupiers may differ
(1) Represents industry diversification percentages based on Embassy REIT’s share of gross rentals 183Q FY2021 Earnings Materials
II. Overview
Our Portfolio: Commercial Office-focused
Predominantly an office REIT with commercial office segment contributing to 94% of Portfolio Value
and 95% of Net Operating Income
Contribution by Gross Asset Value Contribution by Net Operating Income
Others Others
6% 5%
₹445 bn ₹14.2 bn
Gross Asset Value(1) Net Operating Income(2,3)
Commercial Commercial
Office Office
94% 95%
32.3 msf completed best in-class Grade A Office properties (90.6% occupied, 7.1 years WALE)
Notes:
(1) Gross Asset Value (GAV) considered per Sep’20 valuation undertaken by iVAS Partners, represented by Mr. Manish Gupta, in conjunction with value assessment services undertaken by CBRE. Valuation exercise undertaken
semi-annually. For further details refer notes on slide 55 19
(2) ETV was acquired on December 24, 2020 by Embassy REIT. The relevant asset SPVs and Holdco holding ETV have been consolidated from December 31, 2020, a date close to the acquisition date, as there are no significant
transactions or events that have occurred between December 24, 2020 and December 31, 2020 and the effect thereof is not consi dered to be material to the results for the quarter and nine month period ended Dec’20
(3) YTD FY2021 NOI excluding Embassy GolfLinks since Embassy REIT owns 50% economic interest in GLSP3Q FY2021 Earnings Materials III. Market Outlook FIFC, Mumbai
3Q FY2021 Earnings Materials
III. Market Outlook

Market Fundamentals – CY2020 Update
 Gross absorption of 33.7 msf in CY2020 was lowest in last 5 years due to COVID-19 induced pause in
 decision making. However, Q4 witnessed resurgence of new deal activity given positive sentiments
                      Absorption Trends over last 5 years                                                     City-wise Performance – CY2020

                                                                                                                     Absorption(1)   Supply    Vacancy
                                                                     60.8
                           Average Absorption 46.9 msf
                                                                                               City                      (msf)       (msf)       (%)
           48.9                                                                                Bengaluru                 11.3         11.7       8%
                                  46.1                        47.2
                                                      44.8
                                                                                               Pune                       3.2         3.6       12%
                                                                                39.5
   35.1                                                                                        Mumbai                     2.7         5.0       24%
                                               33.8                                    33.7
                          29.3                                                                 NCR                        4.8         6.9       26%
                                                                                              Embassy REIT Markets       22.0         27.2      17%
                                                                                               Hyderabad                  7.1         8.2       13%
       16.9                                                                       17.2         Chennai                    4.1         3.7       12%
                              15.0                14.4           14.0
                                                                                               Kolkata                    0.5         0.4       36%
                                                                                              Other Markets              11.7         12.3      17%
    CY2016                 CY2017               CY2018         CY2019           CY2020
                                                                                              Grand Total                33.7         39.5      17%
               Supply (msf)                 Gross Absorption (msf)          Vacancy (%)

CY2020 Highlights
       ► Gross absorption of 33.7 msf in CY2020, 32% lower than five-year average
             ‒      Occupiers paused their real estate plans in Q2 & Q3 CY2020 given COVID-19 related uncertainty
             ‒      Bengaluru and Tech sector remained resilient, contributed to 34% and 33% of pan-India absorption respectively
       ► Positive occupier sentiment with resurgence in deal activity levels in Q4
             ‒      Continued downward trend in active COVID-19 cases, return-to-work programs commenced by occupiers
             ‒      29% increase in Q4 absorption (vs. Q3), pre-commitments contributed 45% of transacted volumes during Q4 CY2020
Source: CBRE Research, Embassy REIT
Note:                                                                                                                                             21
(1)   Represents gross absorption figures
3Q FY2021 Earnings Materials
III. Market Outlook
Market Fundamentals – Demand Trends
Demand resurgence likely from H2 CY2021 given vaccine roll-out and return-to-work by occupiers.
High-quality properties to benefit from increased wellness-orientation and industry consolidation
Proforma Demand Analysis Demand Trends
Gross Absorption (msf)
Short-term Outlook
‒ With decrease in active COVID cases, occupiers looking
Average 45.2 msf
to ramp-up their ‘return-to work’ programs
‒ Grade A stock to remain resilient given occupier and asset
quality coupled with robust rent collections
45.9 46.9
‒ A broad base vaccine roll-out and ramp-up of employees
42.9
at offices likely to fuel reactivation of RFPs
Medium-term Outlook
33.7
‒ Resurgence in demand owing to occupiers implementing
real estate strategies to support business needs
‒ Expansion driven demand likely from GCCs - large scale
consolidations, expansions to come back gradually
‒ Most active deals likely to see traction / conclusion over
next 6-12 months, a full rebound is expected in CY2022
Portfolio Implications
‒ Limited impact on existing portfolio given asset and
CY2020A CY2021E CY2021E Last 5 Years occupier quality, stable occupancy, long WALE and below
CBRE Estimate C&W Estimate Average market rents
(2016-2020)
‒ Limited risk on 20+ msf contracted escalations in next 3
years
Illustrative ‒ Market consolidation, occupier expansion and preference
Scenario 1 Scenario 2 Scenario 3
Outcomes for quality, wellness-oriented properties to drive demand
Source: CBRE Research, C&W Research, Embassy REIT
223Q FY2021 Earnings Materials
III. Market Outlook
Market Fundamentals – Supply Trends
Considerable supply shrinkage of over 23% since Jan’20 per CBRE, supply expected to recover
modestly post demand rebound in H2 CY2021
Supply Trends
Comparable and competing 14 msf
supply in REIT Markets (~12%) Short-term Outlook
(CY2021F – CY2022F) ~ 119 msf announced supply
‒ Supply slippages to continue due to COVID-19 disruptions
in labour, material and financing availability
Proforma Supply Analysis (pre-COVID)
‒ Delay in construction of ongoing projects, focus on
Non-comparable or unrealistic delivery of pre-committed properties
35 msf
supply in REIT Markets (~30%) ‒ Institutional landlords continue to pour concrete given
financing availability
Medium-term Outlook
Pre-committed Supply 9 msf ‒ CBRE’s 2-year forward supply estimate has decreased
in REIT Markets (~7%) from 119 msf in Jan’20 to 92 msf in Jan’21, a 23% decline
in 4 quarters
‒ Supply likely to recover modestly when demand rebounds
in H2 CY2021
Supply in Non-REIT Markets 34 msf
(~28%) ‒ Institutional landlords to deliver smarter buildings in sync
with changing market dynamics
Portfolio Implications
‒ Comparable & competing supply for REIT is significantly
lower at 12% of announced supply for next 2 years
COVID-19 Impacted Supply ‒ 1.1 msf due for delivery in Sep’21, is already 100% pre-
27 msf
per CBRE estimate leased. No other near-term new supply until FY2023
(~23%)
‒ REIT has liquidity to help labour and financing availability
and flexibility to control supply timing
Source: CBRE Research, Embassy REIT
Note: Comparable and competing supply has been arrived factoring supply considerations including city, micro-markets, location, project completion timing, quality etc. 233Q FY2021 Earnings Materials
III. Market Outlook
Evolution of Workplace
Office to emerge as the core business hub providing better quality, lower density spaces with high
standards of safety and security, favoring institutional landlords like Embassy REIT
Flexible Work Styles Workplace Design and De-densification
Physical office remains a necessity
Occupiers accelerating return-to-work programs
WFH challenges, especially for young tech demographic
Adoption of smart office systems such as sensors, QR
‒ Physical and digital infrastructure at home codes, voice & IoT enabled devices etc.
‒ Softer aspects of career, learning and culture Social distancing now an imperative at the workplace
Many functions require office spaces for social interaction, Space per person likely to increase, reversing densification
client engagement and collaboration trends over last 2 decades
More flexibility - hybrid of traditional offices & home working Workplace density estimated to reduce by over 20%
Flight to Quality Market Consolidation
Employee safety a key priority for companies Occupiers prefer locations with access to large talent pools
Increased emphasis on health & wellness, sustainability Skilled young STEM talent typically favours urban living and
and environmental management seek vibrant, collaborative, creative environments
Focus on recovery readiness & operational best practices Market likely to witness significant supply slippages
Greater demand for ‘Total Business Ecosystem’ product ‒ Material, labor and financing challenges
‒ High-quality, accessible, safe & sustainable Indian Strong preference for institutionally held properties with
offices owned by institutional landlords access to liquidity, leading to market consolidation
Large-scale, safe and sustainable properties like Embassy REIT to emerge as ‘Next Generation Workplaces’
243Q FY2021 Earnings Materials
IV. Navigating
COVID-19
Embassy One, Bengaluru3Q FY2021 Earnings Materials
IV. Navigating COVID-19
Facilitating Occupiers’ Return-to-Work Programs
Ongoing support to occupiers as they bring forward ‘Back-to-Office’ plans, witnessed gradual ramp-
up in employee numbers working in our parks
100%
Business parks and buildings
operational(1)
1,200+
CRE touchpoints for daily
property-specific updates
Ensured post-COVID space readiness
~97% ‒ Building enhancement initiatives
Occupiers operating from our ‒ Support to occupiers in their space re-modelling
properties across India(2)
Continued to engage with park users on health and safety initiatives through #OfficeAgain
campaign
Gradual ramp-up in number of employees working from our parks
~20k ‒ Driven by continued downward trend in active COVID-19 cases, gradual re-opening of the
Employees working from our economy and global vaccine roll-out
properties across India(2) ‒ ~20k employees operated from our properties in 3Q FY2021, up 27% since 2Q FY2021
Notes:
(1) Our properties remained open throughout the lockdown period and complied with all government regulations to support business continuity of our occupiers 26
(2) Data basis mid week average for 3Q FY20213Q FY2021 Earnings Materials
IV. Navigating COVID-19
Rent Collections and Rolling Renewals Update
Rent collections for 3Q FY2021 from office occupiers remained robust at 99.5%; achieved rolling
renewals of 2.0 msf YTD FY2021 across 15 leases, on track to renew remaining 0.9 msf during Q4
Robust Office Rent Collections Continued Momentum in Rolling Renewals
Area (msf)
5.4
2.9
Committed 0.9 3.2
Rents
0.5% 3Q FY2021 2.2
2.0
0.6
FY2020 FY2021 FY2022 FY2023 FY2024
Rents 18 22 8 21 43
Collected
99.5% Rolling Renewals Completed No. of Occupiers
Office rent collections for 3Q FY2021 at 99.5% (99.5% for Continued momentum in rolling renewals given in-place rents
Oct’20, 99.6% for Nov’20 and 99.5% for Dec’20) are significantly below market
In-line with robust office rent collections of 99.9% for 2Q Achieved rolling renewals on 2.0 msf during YTD Q3
FY2021 and 100% for 1Q FY2021 representing 6.5% of annual rents
No waivers to office occupiers. Rebate granted to food court On track for remaining 0.9 msf, or 100% of rolling renewals due
and ancillary retail tenants, representing 0.9% of annual rents in Q4
Note: Rolling renewals refer to lease renewals by occupiers exercising their renewal options after the end of the initial commitment period which is typically 5 years
273Q FY2021 Earnings Materials V. Commercial Office Update Embassy Quadron, Pune
3Q FY2021 Earnings Materials
V. Commercial Office Update

Leasing Highlights for 3Q FY2021
 311k sf leases signed across 11 deals in Q3, comprising of 206k sf new leases with 14% re-leasing
 spread and 104k sf renewals at 6% renewal spread
                              3Q FY2021 Highlights                                                New Leases Signed

New Leases signed (‘000 sf)                                      206    Occupier       Property              Sector               Area ('000 sf)
                                                                        Telstra        Embassy Quadron       Telecom                   51
  ‒ Existing Occupier Expansion                                  72%
                                                                        Wells Fargo    Embassy TechVillage   Financial Services        51
Releasing (‘000 sf)                                              206    Maxlinear      Embassy TechVillage   Others                    27

  ‒ Re-leasing Spread                                            14%    Enfusion       Embassy TechVillage   Technology                26
                                                                                                             Engineering &
                                                                        Halliburton    Embassy TechVillage                             16
Renewals (‘000 sf)                                               104                                         Manufacturing
                                                                        Bain Capital   Express Towers        Financial Services        10
  ‒ Renewal Spread                                               6%
                                                                        Others         Various               Various                   26

Pipeline discussions (‘000 sf)                                   ~150   Total                                                          206

New Leases & Renewals in 3Q FY2021

             Bain Capital

Notes:
(1)    New leases signed includes re-leases, excludes renewals                                                                            29
(2)    Actual legal entity names of occupiers may differ
3Q FY2021 Earnings Materials
V. Commercial Office Update
Leasing Performance Across Years
Maintained healthy occupancy of 90.6% as of December 2020 on the enlarged 32.3 msf completed
portfolio with same-store occupancy of 90.5%
Particulars YTD FY2021 Average FY2020 FY2019 FY2018 FY2017
Completed Area msf 32.3 (FY2017-20) 26.2 24.8 24.2 23.1
Occupancy % 90.6% 93.8% 92.8% 94.3% 93.5% 94.7%
New Leases Signed(1) (A) msf 0.5 1.8 2.4 1.8 1.3 1.9
Re-Leasing msf 0.4 1.0 1.1 1.2 0.5 1.1
Re-Leasing Spread % 16% 47% 53% 35% 35% 61%
Existing Occupier Expansion % 67% 62% 71% 59% 69% 50%
Renewals(2) (B) msf 0.5 1.5 0.6 0.9 2.9 1.6
Total Leases Signed (A+B) msf 1.0 3.3 2.9 2.7 4.2 3.5
1.8 msf average new leases signed between FY2017-20 47% average re-leasing spread between FY2017-20
2.4 61%
53%
1.9 1.8
1.3 35% 35%
0.5 16%
FY2017 FY2018 FY2019 FY2020 YTD FY2021 FY2017 FY2018 FY2019 FY2020 YTD FY2021
Re-Leased
Area (msf) 1.1 0.5 1.2 1.1 0.4
Area (msf)
Notes:
(1) New leases signed includes re-leases, excludes renewals 30
(2) Renewal of ultimate lease expiries3Q FY2021 Earnings Materials
V. Commercial Office Update
Embedded Rental Escalations
Achieved rental increase of 15% on 1.5 msf across 24 leases in Q3 (achieved 13% rental increase on
5.3 msf YTD). On track to deliver 13% rental increase due on 3.0 msf across 28 leases in Q4
Market rents 29% above in-place rents Embedded rental escalations of 10-15% aids NOI growth
Rent (₹ psf / month) Area (msf)
8.3
3.0 8.5
7.7
6.8
90
5.5 5.3
70
FY2020 FY2021 FY2022 FY2023 FY2024
55 94 88 68 65
Rental Escalations Achieved No. of Occupiers
Rental
12.8% 14.2% 14.4% 12.8%
Escalations
Post-escalation
40.1% 12.3% 14.1% 35.5%
(1) MTM opportunity
In-place Rents Market Rents
3Q FY2021 Update: Achieved 15% rental increase on 1.9 msf
Source:
(1) CBRE Research Dec’20, Embassy REIT 313Q FY2021 Earnings Materials
V. Commercial Office Update
Embedded Mark-to-Market Potential
Of 2.2 msf lease expiries in FY2021, successfully backfilled 0.7 msf at 11% MTM spread. 0.6 msf leases
representing 2.3% of annual rents are likely exits in Q4
19% of leases expire between FY2021–24 FY2021 Lease Expiries Update
Area Expiring (msf)
Renewal / Re-lease
Exits Completed
0.7 msf
Average Lease Expiries 0.9 msf
3.4% of Rents(1)
~ 1.9 msf / 6.1% of Rents 2.9% of Rents(1)
MTM 11.4%
MTM 11.3%
(achieved)
2.7
2.2
FY2021
1.5 Expiries
19%
MTM 1.5
0.6 msf
1.1 1.1
2.3% of Rents(1)
MTM 2.0%
0.7
Likely Exits
0.7 msf backfilled at 11.4% MTM spread to 24 occupiers
FY2020 FY2021 FY2022 FY2023 FY2024
1.5 msf total exits in FY2021 – ‘business as usual’ churn
Mark-to-market and COVID-19 induced occupier exits
2.0% 55.5% 42.2% 17.1%
opportunity ‒ 0.9 msf exits till Q3, 0.6 msf likely exits in Q4
(includes ETV and additional exits on initial portfolio)
Rents Expiring 2.3% 4.7% 6.5% 5.0% 1.0 msf avg annual backfill achieved in previous 4 years
Note:
(1) Refers to annualized rental obligations 323Q FY2021 Earnings Materials
VI. Development
Update
Embassy Manyata, Bengaluru3Q FY2021 Earnings Materials
VI. Development Update
Development Pipeline
Launched 1.9 msf of new office development at ETV. Along with the existing 2.7 msf development,
organic growth through 5.7 msf on-campus development across portfolio
Development Pipeline(1) (msf) Development Status as of February 12, 2021
Area (msf) JP Morgan BTS
‒ Tower A – 8th floor slab work in
1.1 2.7 2.5 3.9 progress. MEP & façade works initiated
Embassy ‒ Tower B – Structural works completed.
2.4 TechVillage MEP & façade works in progress
(JPM BTS, 1.1 msf) ‒ Targeting Sep’21 completion
(Parcel 8, 1.9 msf) Parcel 8
‒ Design finalized & excavation initiated
‒ Targeting Mar’24 completion
0.9
1.9
Pre-leased
to Embassy Manyata M3 Block A – Sub-structure works
JP Morgan completed; structural steel works on 2nd
0.7 M3 Parcel floor underway
0.6
1.5 (Block A – 1.0 msf) Targeting Dec’22 completion
1.1
1.0
0.8 Hudson and Ganges Block – Design,
0.6 Embassy TechZone excavation and sub-structure works
(Hudson, 0.5 msf) completed; 2nd floor slab work in
progress
FY2020 FY2022 FY2023 FY2024(2) Post FY2024 (Ganges, 0.4 msf)
Targeting Jun’22 completion
Embassy Manyata Embassy Oxygen
Embassy TechZone Embassy TechVillage
Design and excavation work completed;
Embassy Oxygen sub-structure works underway
1.1 msf JP Morgan built-to-suit 100% pre-committed (Tower 1, 0.7 msf)
and on track for Sep’21 delivery Targeting Mar’23 completion
Notes:
(1) Excludes 1,137 hotel keys across Hilton & Hilton Garden Inn at Embassy Manyata and Embassy TechVillage 34
(2) Includes acquisition of 0.6 msf M3 Block B located within overall Embassy Manyata upon estimated building completion in Sep’233Q FY2021 Earnings Materials
VI. Development Update
Under Development Projects
5.7 msf on-campus projects across 4 properties in various stages of development, with earliest
delivery of 1.1 msf JP Morgan built-to-suit targeted for September 2021
Embassy TechVillage – JP Morgan BTS (1.1 msf) Embassy Manyata – M3 Block A (1.0 msf)
Design Perspective
Actual Progress at Site(1)
Note:
(1) Feb’21 pictures 353Q FY2021 Earnings Materials
VI. Development Update
Under Development Projects
For the ongoing 5.7 msf on-campus development, adequate financing available. Additionally, REIT has
the flexibility to control supply timing
Embassy TechZone – Hudson & Ganges Blocks (0.9 msf) Embassy Oxygen – Tower 1 (0.7 msf)
Design Perspective
Actual Progress at Site(1)
Note:
(1) Feb’21 pictures 363Q FY2021 Earnings Materials VII. Acquisition Update Embassy TechVillage, Bengaluru
3Q FY2021 Earnings Materials
VII. Acquisition Update

Embassy TechVillage Overview
 9.2 msf office park with 6.1 msf of completed office (97.8% occupancy), 3.1 msf of U/C office (36% pre-
 leased), 518 proposed Hilton hotel keys and a planned metro station at the park entrance

            Location            Outer Ring Road, Bengaluru

      Total Leasable Area /
        Completed Area /        9.2 msf / 6.1 msf / 518 keys
      Proposed Hotel Keys

        No. of Occupiers                    45+

     In-Place Rent (psf p.m.)               ₹69

       MTM Potential (%)                   32%

           Occupancy                      97.8%

              WALE                       9.5 years

        Pre-Leased Area
                                      1.1 msf (36%)
   (% of Under Construction)

                                                                                                   38
3Q FY2021 Earnings Materials
VII. Acquisition Update
Transaction Update
Successfully acquired ETV asset for ₹97.8 bn and integrated asset into REIT portfolio. Raised ₹36.8 bn
equity through an Institutional Placement and ₹26 bn listed debt at 6.4% quarterly coupon
Strategic acquisition of a best-in-class office park totaling 9.2 msf; located on ORR, Bengaluru, India’s
best performing office sub-market
Acquisition
Stable cash flows with 97.8% occupancy and 9.5 years WALE, strong growth through contractual
Rationale
escalations and 3.1 msf on-campus development
Accretive acquisition basis – at a discount to independent valuations; NOI, DPU and NAV accretive
Purchase Price (Enterprise Value) of ₹97,824 mn
Purchase Price ‒ Implied 4.6% discount to average of two independent valuations (₹102,555 mn)
‒ Implied Trailing NOI Yield(1) of 7.5% on completed portion
Purchase consideration funded through equity
‒ Institutional Placement of ₹36.8 bn (111.34 mn units) at ₹331 per unit to institutional investors
Financing
‒ Preferential Allotment of ₹23.1 bn (64.89 mn units) to third-party shareholders at ₹356.70 per unit
Debt raise of ₹26 bn at 6.4% quarterly coupon & roll-over of ₹12 bn in-place target net debt
1.9 msf new on-campus office development kick-started
1.1 msf of JP Morgan built-to-suit project integrated, on track for Sep’21 delivery
Asset Integration
₹26.4 bn of in-place ETV debt refinanced at 328 bps refinancing spread
On-ground teams integrated and initiated restructuring 2-tier holdings at the ETV level
Notes:
(1) Purchase Price Trailing NOI Yield calculated as ratio of annualized 1H FY2021 NOI of ETV divided by Purchase Price of ₹87,000 mn multiplied by percentage of completed portion of GAV of ETV including the associated CAM
business (as per Independent valuation undertaken by iVAS Partners, represented by Mr Manish Gupta (independent valuer of the Embassy REIT) with value assessment services provided by CBRE South Asia Private
Limited) 393Q FY2021 Earnings Materials
VII. Acquisition Update
ETV Acquisition – Financing Update
ETV acquisition financed through (i) ₹37 bn equity raise through an Institutional Placement and (ii) ₹23
bn through Preferential Allotment. Additionally, raised ₹26 bn debt at 6.4% to refinance in-place debt
(In ₹ mn)
Sources of Funds Amount Uses of Funds Amount
Consideration to Embassy and
Equity Issuance
Blackstone entities
‒ Institutional Placement(2) 36,852 ‒ Embassy Group 21,986
‒ Preferential Issue(3) 23,147 ‒ Blackstone Entities 10,972
Debt Issuance(4) 26,000 Units Issued to Sellers
In-place Target Net Debt 11,612 ‒ Third-party Shareholders 23,147
Debt Repayment, General Corporate
29,894
Purposes and Transaction Expenses(5)
Target Net Debt Rolled-over 11,612
Total Sources of Funds 97,611 Total Uses of Funds 97,611
Notes:
(1) Net acquisition cost of ₹97,611 mn arrived at after adjusting for closing adjustments such as security deposits and other balance sheet items. Net Acquisition Cost = Enterprise Value - Security Deposits + Transaction
Expenses + Other Adjustments
(2) Issue of Units through an Institutional Placement aggregating to ₹36,852.02 mn, comprising 111.34 mn Units at a price of ₹331.00 per Unit to institutional investors
(3) Issue of Units through a Preferential Issue of 64.89 mn units at a price of ₹356.70 per unit to the third-party shareholders of VTPL aggregating to ₹23,147.33 mn as consideration for the transfer of their shareholding to
the Embassy REIT
(4) Series III Debentures issued by Embassy REIT on January 15, 2021 amounting to ₹26,000 mn at a quarterly coupon of 6.40% p.a
40
(5) Includes amounts aggregating to ₹2,489 mn from the proceeds of equity and debt issuance which is pending utilization as at December 31, 20203Q FY2021 Earnings Materials
VIII. Asset Management
Update
Embassy Qubix, Pune3Q FY2021 Earnings Materials
VIII. Asset Management Update
Hospitality Update
477 key operating hotels continued to witness low occupancy due to COVID-19 induced travel
disruptions. Instituted global safety protocols for guests and initiatives to improve occupancy
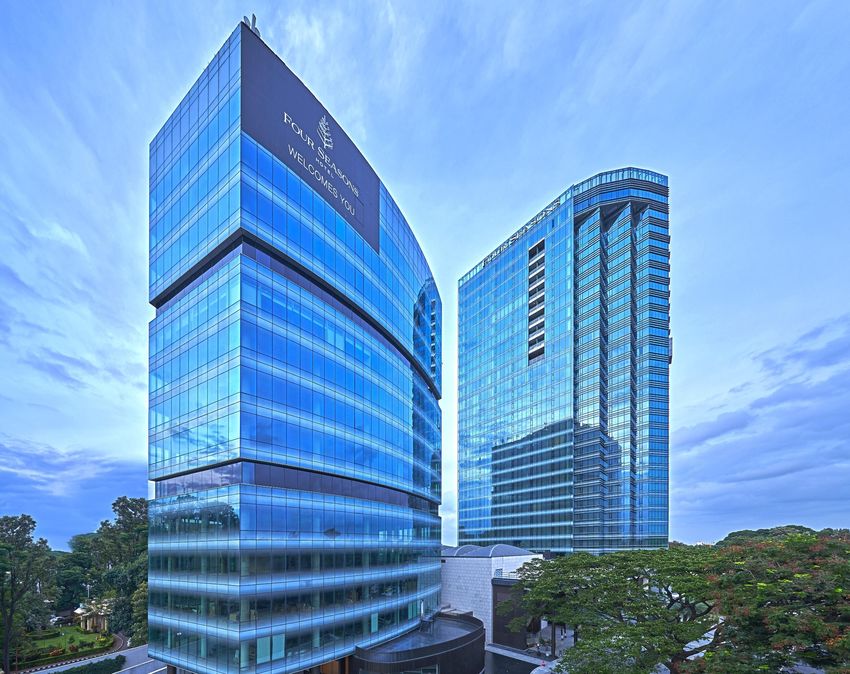
Hilton at Embassy GolfLinks Four Seasons at Embassy One Hilton Hotels at Embassy Manyata
* Perspective
247 Keys 230 Keys 619 Keys
5-Star Hotel 5-Star Luxury Hotel 5-Star & 3-Star Hotel
Operational Operational Under Construction
Q3 Occupancy : 14% Q3 Occupancy : 11% Expected completion in June 2022
Q3 EBITDA: ₹(29) mn Q3 EBITDA: ₹(45) mn 100k+ sf Retail & Convention Centre
‘Ranked #9 - TripAdvisor’ ‘Best New Business Hotel’ ‘Best Hotel Architecture’
- out of 1,548 hotels in Bengaluru ‒ by Travel + Leisure ‒ by Asia Pacific Property Awards
► Outlook – Hospitality demand recovery expected to remain muted until FY2022 given COVID-19 related disruptions
► Action Plan – Implemented significant cost saving measures and initiatives to improve occupancy. Also, implemented global safety
protocols for guests to aid in occupancy ramp-up
Limited impact of COVID-19 induced hospitality slowdown on our portfolio given – Hotels contribute < 5% of
GAV and < 1% of pre-COVID NOI (FY2020)
423Q FY2021 Earnings Materials
VIII. Asset Management Update
Infrastructure and Upgrade Projects
Construction activity underway for 619 key dual branded Hilton hotels at Embassy Manyata. Initiated
pre-operational activities, on track for Jun’22 launch
Hilton Garden Inn: 3-Star Hilton Hotel: 5-Star
353 keys 266 keys
► Hilton – 5 Star (266 keys) at Embassy Manyata
‒ Structure and façade work completed. MEP and Guest Room works currently in progress
► Hilton Garden Inn – 3 Star (353 keys) at Embassy Manyata
‒ Structure work completed. Façade, MEP and Guest Room works currently in progress
► Initiated pre-operational activities and key leadership hires in collaboration with Hilton
Note: Feb’21 picture
433Q FY2021 Earnings Materials
VIII. Asset Management Update
Infrastructure and Upgrade Projects
Comprehensive asset re-positioning underway at Embassy Quadron, on target for Sep’21 completion
Lobby Refurbishment Façade Upgrade
Landscape and Community Areas Upgrade Food Court Revamp
Note: Perspectives
443Q FY2021 Earnings Materials IX. Financial Update Embassy TechZone, Pune
3Q FY2021 Earnings Materials
IX. Financial Update

Walkdown of Key Financial Metrics
                                                                                                                                                                                                           (Amount in ₹ mn)
   Particulars                                                                 3Q FY2021             3Q FY2020           Variance (%) YTD FY2021 YTD FY2020 Variance (%)
   Revenue from Operations                                                         5,653                5,459                   4%                 16,217              16,016                   1%

                                                                                                                                                                                                               NOI
   Property Taxes and Insurance                                                    (192)                 (180)                  7%                  (581)               (538)                   8%
   Direct Operating Expenses                                                       (681)                 (639)                  7%                (1,473)              (1,926)               (24%)
Net Operating Income                                                               4,780                4,639                   3%                 14,163              13,551                   5%
   Other Income                                                                     290                   153                  89%                   793                 402                  97%

                                                                                                                                                                                                                        NDCF at SPV level
                                                         (2)
   Dividends from Embassy GolfLinks                                                 300                      -                  NR                   565                 194                  191%

   Property Management Fees (3)                                                    (126)                 (125)                  1%                  (361)               (359)                   1%
   Indirect Operating Expenses                                                     (162)                 (139)                 16%                  (361)               (493)                (27%)
EBITDA                                                                             5,082                4,528                   12%                14,799              13,295                  11%

                                                                                                                                                                                                                                            Distributions
   Working Capital Adjustments                                                     (187)                  431                   NM                   129                1,889                (93%)
   Cash Taxes                                                                      (209)                 (356)                (41%)                 (576)              (1,038)               (45%)

   Principal Repayment on external debt                                              (9)                  (40)                (78%)                 (106)               (325)                (68%)
   Interest on external debt                                                       (117)                 (218)                (46%)                 (901)               (786)                 15%
   Non-Cash Adjustments                                                             (59)                 (317)                (81%)                 (667)               (955)                (30%)
NDCF at SPV level                                                                  4,501                4,028                   12%                12,679              12,080                   5%

   Distribution from SPVs to REIT                                                  4,532                4,323                   5%                 12,801              12,321                   4%
   Distribution from Embassy Golflinks                                                 -                  480                (100%)                  738                1,440                (49%)
   Interest on external debt                                                       (243)                     -                  NR                  (277)                   -                   NR
                                        (2)
   REIT Management Fees                                                             (45)                  (55)                (19%)                 (158)               (159)                 (1%)
   Other Inflows at REIT level (Net of Expenses)                                     63                   (38)                  NR                   (72)                (51)                 40%
NDCF at REIT level                                                                 4,308                4,710                  (9%)                13,032              13,552                  (4%)
Distribution                                                                       4,313                4,707                  (8%)                13,056              13,504                  (3%)
Notes: Walkdown of Financial Metrics upto 'NDCF at SPV Level' represents financial numbers of all SPV's consolidated excluding Trust standalone numbers
(1)   ETV was acquired on December 24, 2020 by Embassy REIT. The relevant asset SPVs and Holdco holding ETV have been consolidated from December 31, 2020, a date close to the acquisition date, as there are no significant 46
      transactions or events that have occurred between December 24, 2020 and December 31, 2020 and the effect thereof is not consi dered to be material to the results for the quarter and nine month period ended Dec’20
(2)   Given EOPPL currently owns 50% economic interest in Embassy GolfLinks, dividends from Embassy GolfLinks is paid to EOPPL
(3)   Property management fees includes 3% of facility rentals from only Commercial Office segment and does not include fees on Hospitality and Other segments and REIT Management fees is 1% of REIT distribution
3Q FY2021 Earnings Materials
IX. Financial Update
Revenue Contribution by Segment and Geography
Commercial Office segment contributed 92% of Revenues in Q3. Bengaluru, our core market, is least
impacted due to its technology sector focus and contributed 57% of Revenues in Q3
3Q FY2021 % of Revenue from Operations(1)
Property Segment City
(₹ mn) Total
Others
Embassy Manyata Commercial Office Bengaluru 2,782 49%
8%
Embassy 247 Commercial Office Mumbai 414 7%
Embassy TechZone Commercial Office Pune 382 7%
Embassy Oxygen Commercial Office Noida 371 7% Contribution by
Segment
Express Towers Commercial Office Mumbai 344 6%
FIFC Commercial Office Mumbai 253 4%
Embassy Quadron Commercial Office Pune 238 4% Commercial
Office
Embassy Qubix Commercial Office Pune 217 4% 92%
NCR (Noida)
Embassy Galaxy Commercial Office Noida 190 3% 10%
Embassy One Commercial Office Bengaluru 8 0%
Four Seasons at Embassy One Others Bengaluru 53 1% Pune
15%
Hilton at Embassy GolfLinks Others Bengaluru 29 1%
Contribution by
Embassy Energy Others Bengaluru 372 7% Geography
Revenue From Operations 5,653 100%
Portfolio Investment(2) Mumbai
18%
Embassy GolfLinks Commercial Office Bengaluru 1,014 Bengaluru
57%
Notes:
(1) Revenue from Operations does not include contribution from Embassy GolfLinks. Embassy REIT owns 50% economic interest in Embassy GolfLinks 47
(2) Amount represents 100% of Embassy GolfLinks. Embassy REIT owns 50% economic interest in Embassy GolfLinks3Q FY2021 Earnings Materials
IX. Financial Update
Strong Balance Sheet with Ample Liquidity
Post recent ETV acquisition, REIT’s leverage stands at 23%. Our conservative Balance Sheet provides
flexibility to pursue growth through on-campus development and accretive acquisitions
Net Debt to TEV
Total Enterprise Value (‘TEV’)
Particulars December 31, 2020 Net Debt
₹96,975
23%
Market Capitalization(1) 326,284
Add: Net Debt 96,975
As of Dec’20
Gross Debt 102,877
Less: Cash & Cash Equivalents investments(2) (5,902) Equity
₹326,284
77%
Total Enterprise Value (TEV) 423,259
Leverage Metrics Debt Headroom
Particulars December 31, 2020 ₹217,114
Net Debt to TEV 23%
Net Debt to EBITDA(3,4) 3.1x
Interest Coverage Ratio(4) ₹96,975
‒ excluding capitalized interest 3.6x
‒ including capitalized interest 3.4x
Available Debt Headroom ₹120 bn Existing Net Debt Proforma Net Debt
Notes:
Capacity (6)
(1) Closing price on National Stock Exchange as at December 31, 2020
(2) Includes short term liquid funds, fixed deposits etc net of 3Q FY2021 distribution of ₹4,313 mn
(3) EBITDA has been annualized for comparability purposes
(4) ETV was acquired by Embassy REIT on December 24, 2020. The relevant asset SPVs and Holdco holding ETV have been consolidated from December 31, 2020, a date close to the acquisition date, as there are no
significant transactions or events that have occurred between December 24, 2020 and 31 December 2020 and the effect thereof not considered to be material to the results for the quarter and nine month period ended
Dec'20. Hence, Interest Coverage Ratio ('ICR') and Net Debt to EBITDA ratios have been computed and presented for the Initial portfolio of 33.3 msf prior to ETV acquisition 48
(5) $1 = ₹73
(6) Gross Asset Value (GAV) considered per Sep’20 valuation undertaken by iVAS Partners, represented by Mr. Manish Gupta, in conjunction with value assessment services undertaken by CBRE. Valuation exercise
undertaken semi-annually. For further details refer notes on slide 553Q FY2021 Earnings Materials
IX. Financial Update
Proactive Capital Management
Existing cash and undrawn commitments total ₹9.4 bn. Successfully raised ₹33.5 bn at 6.5% coupon.
Also, refinanced ₹32.8 bn in-place debt resulting in 336 bps interest savings
Refinanced ₹32.8 bn at 336 bps spread
₹9,368 mn 10.3%
Cash & Undrawn Committed Facilities(1)
6.9%
₹33,500 mn
Listed NCD Issuances(2) Pre-refinancing Post-refinancing
Interest Cost Interest Cost
Principal Maturity Schedule
(Amount in ₹ mn)
6.5% 46,332
Average Interest Cost 36,648
14,319
AAA / Stable
Rating of Listed Bonds by CRISIL 32 171
FY2021 FY2022 FY2023 FY2024 FY2025+
Notes: All figures on this slide reflect the recent Series III NCD of ₹26,000 mn raised on January 15, 2021
(1) Includes treasury balances, fixed deposits etc., net of 3Q FY2021 distribution of ₹4,313 mn 49
(2) Raised Series II NCD (Tranche B) of ₹7,500 mn in Oct’20 at 6.70% coupon to fund Embassy Manyata and Embassy TechZone CAM acquisition and for general purposes. Further, rai sed ₹26,000 mn in Jan’21 at
6.40% coupon to refinance in-place ETV debt post acquisition and for general purposes
(3) Savings of 328 bps on ₹26.4 bn refinance of in-place debt at ETV and 367 bps on ₹6.4 bn refinance of existing debt at Embassy Energy3Q FY2021 Earnings Materials X. Appendix Embassy Galaxy, Noida
3Q FY2021 Earnings Materials
X. Appendix
Portfolio Summary
32.3 msf completed Grade A office assets (90.6% occupied, 7.1 years WALE, 29% MTM opportunity)
Leasable Area (msf)/Keys/MW WALE
(2)
Occupancy Rent (₹ psf / mth) (3)
GAV
Property Completed Development Total (yrs) (%) In-place Market MTM (%) ₹ mn % of total
Embassy Manyata 11.8 3.1 14.8 7.0 95.5% 61 91 50% 160,291 36%
Embassy TechVillage 6.1 3.1 9.2 9.5 97.8% 69 91 33% 100,818 23%
(1)
Embassy GolfLinks 2.7 - 2.7 8.3 97.2% 116 148 27% 27,428 6%
Embassy One 0.3 - 0.3 8.2 5.5% 159 147 (8%) 4,532 1%
Bengaluru Sub-total 20.9 6.1 27.0 7.4 95.3% 72 102 43% 293,069 66%
Express Towers 0.5 - 0.5 3.9 87.6% 269 270 0% 17,722 4%
Embassy 247 1.2 - 1.2 3.9 82.1% 101 110 9% 16,404 4%
FIFC 0.4 - 0.4 3.3 77.5% 297 285 (4%) 13,908 3%
Mumbai Sub-total 2.0 - 2.0 3.7 82.6% 176 178 2% 48,034 11%
Embassy TechZone 2.2 3.3 5.5 5.1 88.6% 49 48 (1%) 22,747 5%
Embassy Quadron 1.9 - 1.9 4.0 61.7% 47 48 2% 13,104 3%
Embassy Qubix 1.5 - 1.5 5.1 93.9% 40 48 20% 10,153 2%
Pune Sub-total 5.5 3.3 8.8 4.8 80.7% 46 48 5% 46,004 10%
Embassy Oxygen 2.5 0.7 3.3 10.7 75.6% 48 54 13% 21,242 5%
Embassy Galaxy 1.4 - 1.4 2.4 98.6% 35 45 28% 8,783 2%
Noida Sub-total 3.9 0.7 4.6 7.9 83.7% 43 50 18% 30,025 7%
Subtotal (Office) 32.3 10.1 42.4 7.1 90.6% 70 90 29% 417,132 94%
Four Seasons at Embassy One 230 Keys - 230 Keys - 4.5% - - - 7,545 2%
Hilton at Embassy GolfLinks 247 Keys - 247 Keys - 10.8% - - - 4,375 1%
Hilton & Hilton Garden Inn at
- 619 Keys 619 Keys - - - - - 4,122 1%
Embassy Manyata (5 & 3 star)
Hilton & Hilton Garden Inn at
- 518 Keys 518 Keys - - - - - 1,474 0%
Embassy TechVillage (5 & 3 star)
Embassy Energy 100MW - 100MW - - - - - 10,002 2%
Subtotal (Infrastructure Assets) 477 Keys / 100MW 1,137 Keys 1,614 Keys / 100MW 27,518 6%
32.3 msf / 477 Keys / 10.1 msf / 1,137 42.4 msf / 1,614
Total 444,650 100%
100MW Keys Keys / 100MW
Notes:
(1) Details included in the above table are for 100% stake in Embassy GolfLinks, except GAV which reflects Embassy REIT’s 50% economic interest in GLSP 51
(2) Weighted against Gross Rentals assuming occupier exercise their renewal options after the end of the initial commitment period
(3) Gross Asset Value (GAV) considered per Sep’20 valuation undertaken by iVAS Partners, represented by Mr. Manish Gupta, in conjunction with value assessment services undertaken by CBRE. Valuation exercise
undertaken semi-annually. For further details refer notes on slide 553Q FY2021 Earnings Materials
X. Appendix
Environment, Social & Governance
Continued focus on environment and community engagement is core to our CSR philosophy
100 MW (AC) Solar Plant ESG Assurance Certificate Green Energy Initiatives
Awarded the ‘Best
Environment
Granted assurance
Green Building
certificate on our
Project of the Year’
Environment,
award for
Social &
implementing 525
Governance
kW Roof top solar
processes for
project at Embassy
FY2020
247
Awarded COVID-19
Assurance
Awards
Certificate for
Global Benchmark
in Control
Measures
COVID-19 support to Infrastructure Upgrade at Health Kits distribution for
State Government Hospitals Karnataka Public School Government School Students
Social
52You can also read