Engineering and Commercial Infrastructure - Waste Services - Monthly Review September 2020 - Mackay Regional Council
←
→
Page content transcription
If your browser does not render page correctly, please read the page content below
Engineering and
Commercial Infrastructure -
          Waste Services
                Monthly Review
               September 2020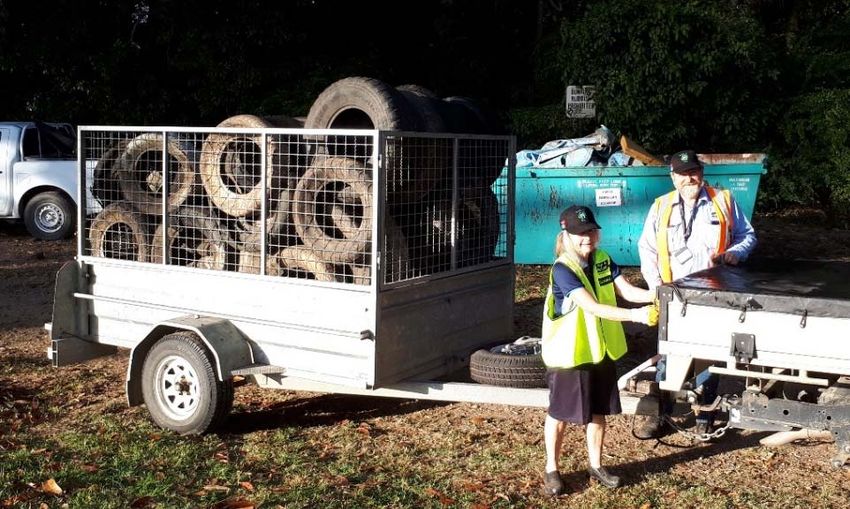
Engineering & Commercial Infrastructure
                                                                                   Monthly Review > September 2020

Contents
OVERVIEW ........................................................................................... 3
SAFETY ................................................................................................ 4
1.1       Safety Incidents and Lost Time Injuries ............................................................................ 4
1.2       Lost Time Injuries ................................................................................................................. 4
FINANCE .............................................................................................. 5
2.1       Community Service Obligations – Fee Waivers .............................................................. 5
2.2       Waste Financial Report ....................................................................................................... 6
2.3       Operating Result for Waste Fund....................................................................................... 6
CLIENT SERVICE .................................................................................. 7
3.1       Number of Bin Requests Actioned by Bin Contractors ................................................... 7
3.2       Dump Vouchers .................................................................................................................... 8
3.4       Community Engagement ...................................................................................................12
3.5       Facebook Feedback ...........................................................................................................12
ASSET MANAGEMENT ........................................................................ 13
4.1       Hogan’s Pocket Landfill Waste Disposal Tonnages .....................................................13
4.2       Hogan’s Pocket Biogas Plant ...........................................................................................14
4.3       Green Waste Management ...............................................................................................14
4.4       Material Recovery Facility Operations.............................................................................15
4.5       Resource Recovery Facility – Tonnages ........................................................................15
REGULATORY COMPLIANCE ............................................................... 16
5.1       Surface Water Discharge Management ..........................................................................16
5.2       Waste Facility Audits ..........................................................................................................16
5.3       Landfill Biogas Safety ........................................................................................................16
MANAGEMENT INITIATIVES ................................................................ 16
6.1       COVID-19 – Waste Services Status ................................................................................16
6.2       Current Waste Services Management Improvements ..................................................17

                                                              Page 2 of 17
Engineering & Commercial Infrastructure
Monthly Review > September 2020
OVERVIEW
This report is for Waste Services activities for the reporting period of 1 - 30 September 2020.
Significant items in this period include:
No Lost Time Injuries were recorded for the month of September 2020. One (1) incident
was recorded with Council’s waste contractors and one (1) incident in relation to a
member of the public.
The Great Northern Clean Up, held on 12 & 13 September 2020, was an outstanding
success despite COVID-19 directives restricting some elements.
Monthly variances on waste disposal tonnages continue to occur at Hogan’s Pocket
Landfill. September saw an increase in Construction and Demolition waste received.
Season 20A of the waste vouchers ended on 30 September 2020 with a redemption rate
of 24.4%. This correlates closely to similar redemption percentages over the last four (4)
years.
Waste Services has reviewed the Data Collection Process for missed bin services to
improve data quality on service reliability.
Waste Services is working on several concurrent strategic and operational projects.
The first batch of biosolids/green waste compost was sent to market during the month
after a 26-week processing period. This represent a great community and environmental
outcome.
During September 2020 cardboard/mixed paper and glass found markets. A large batch
of approximately 1,000 tonnes of the previously stockpiled Recycled Crushed Glass
(RCG) has been sold as coarse drainage sand, slightly skewing the above sales figures.
The recycled market pricing continues to be subdued due to the volatility being
experienced by industry.
Director Engineering & Commercial Infrastructure
Page 3 of 17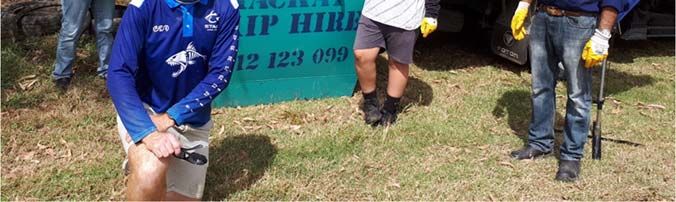
Engineering & Commercial Infrastructure
                                                                                          Monthly Review > September 2020

                                                                       SAFETY
1.1       Safety Incidents and Lost Time Injuries
Waste Services aspires to achieve zero harm with a stretch target of zero injuries. The following incident
graph details a summary of the Waste Services safety incident performance.

                                      8

                                      7

                                      6
                Number of Incidents

                                      5

                                      4

                                      3

                                      2

                                      1

                                      0

                                          Total Incidents     Lost Time Injuries   Total Recordable Injuries   All Injuries

September 2020 Summary:
The incidents listed below for September 2020 relate to Council's contractors.

  No of Incidents                                           Mechanism of injury                                Injury Type

            1                                 First Aid Injury                                      Laceration / Cut

            1                                 Member of Public Injury                               Bruise
                                                                                                    N/A (Unauthorised Entry to
            1                                 Near Miss
                                                                                                    Unattended Greenwaste Site)
            4                                 Asset Damage                                          N/A (Vehicle Damage)

1.2       Lost Time Injuries
Waste Services aspires to achieve zero Lost Time Injuries by improving safety performance and
developing a proactive safety culture while implementing the best practice of safety management across
the whole of Waste Services.

The table below shows the Lost Time Injuries over previous years.

                                                  2016‐17             2017‐18            2018‐19             2019‐20             2020‐21
       Department                              LTI Days Lost       LTI Days Lost      LTI Days Lost       LTI Days Lost       LTI Days Lost
      Waste Services                            0       0           0       0          0       0           0       0           0       0

                                                                         Page 4 of 17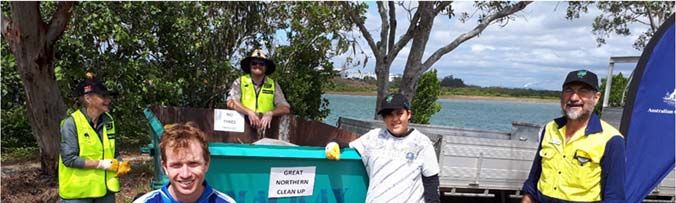
Engineering & Commercial Infrastructure
                                                                     Monthly Review > September 2020

                                               FINANCE
2.1      Community Service Obligations – Fee Waivers
Not for Profit Organisations – Total Waste Disposals

Expenditure for the Period:

Charity/Organisation                                Sep-20                YTD Expenditure 2020/2021       Budget for
                                                                                                           2020/2021
                                              Tonnage      $ (excl gst)   Tonnage       $ (excl gst)      $ (excl gst)
Adopt-a-Spot                                                                     0.00            $0.00            $80.00
Bolzys Go4 Services                                 0.18         $44.66          1.28         $303.46            $900.00
Com m unity Accom m odation & Support                                            0.00            $0.00            $80.00
Iona West Mens Shed                                                              0.00            $0.00            $80.00
Kidney Support Netw ork Inc                                                      0.00            $0.00             $0.00
Lifeline Mackay                                    17.06      $2,388.40         45.42        $6,372.08        $28,000.00
Mackay Coloured Co-op.                              1.36       $228.29           2.16         $382.51          $1,400.00
Mackay & District Spinal Injuries Assoc Inc                                      0.00            $0.00            $80.00
Mackay Regional Housing Com pany                                                 0.00            $0.00           $700.00
New Life Christian Church                           0.06         $13.64          0.38           $58.44           $700.00
RSL Pioneer -Fitzroy District                                                    0.00            $0.00           $550.00
Sarina Landcare Catchm ent Support                                               0.00            $0.00           $110.00
Society of St Vincent De Paul                       4.52       $632.80          20.42        $2,858.80        $11,500.00
St Vincent De Paul Society - Sarina                 3.34       $467.60           3.34         $467.60            $860.00
The Salvation Arm y                                 0.08         $17.38          5.78         $815.38         $10,000.00
The Sam aritan House                                                             0.00            $0.00           $110.00
TOTAL                                              26.60 $ 3,792.77             78.78      $11,258.27 $       55,150.00

September 2020 Summary:
Year to date expenditure for Not for Profit Organisations is reported on a calendar month basis. The graph
and the table above show the Charities' and Organisations' expenditure to 30 September 2020.

                                                  Page 5 of 17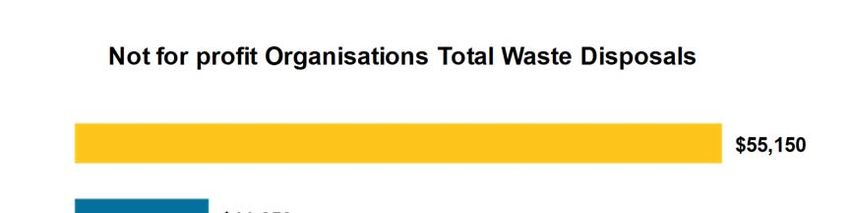
Engineering & Commercial Infrastructure
                                                                                                              Monthly Review > September 2020

                     2.2        Waste Financial Report
Financial Performance Report                                                                                               % YTD Variance of YTD Budget
                                                                        Commercial Infrastructure
Period Covered: 1 July 2020 to 30 September 2020                                                                           YTD Variance favourable of budget
                                                                                                                           YTD Variance unfavourable, between 0% and 5% of YTD Budget
                                                                                                                           YTD Variance unfavourable, more than 5% of YTD Budget
                                                    Revised         YTD           YTD           YTD              YTD
                                                    Budget         Budget        Actual       Variance         % Spent

Waste Fund
6.01 - Commercial Infrastructure Management          9,616,222     2,619,833     2,609,555          (10,277)        100%    Depreciation Under budget by $20,000 and Finance costs
                                                                                                                            over budget by $12,500.
6.05 - Waste Services                              (11,078,343)   (8,800,537)   (8,963,868)     (163,330)           102%    Revenue under Budget by $56,000 mainly due to Gate
                                                                                                                            Fees and Waste levy collected. Expenses under Budget
                                                                                                                            by $219,000 mainly by due to Material & Services

6.07 - Water Treatment                                  96,802        28,842        30,855            2,013         107%

Total Waste Fund                                    (1,365,319)   (6,151,862)   (6,323,457)     (171,595)           103%

Operating (surplus) / deficit                       (1,365,319)   (6,151,862)   (6,323,457)     (171,595)           103%

                     2.3        Operating Result for Waste Fund

                                                                  Operating (surplus) / deficit
                -

 (2,000,000)

 (4,000,000)

 (6,000,000)

 (8,000,000)

(10,000,000)

(12,000,000)

                                                                            YTD Budget                 YTD Actual

                                                                                      Page 6 of 17
Engineering & Commercial Infrastructure
Monthly Review > September 2020
CLIENT SERVICE
3.1 Number of Bin Requests Actioned by Bin Contractors
The following graph shows the number of bin requests actioned by Bin Contractors for September 2020.
500 463
450
400
No. of Customer Service Requests
356 360
350 323
299
300
259
235 233 229 232
250 224 219
200
186 185
200 168
139 147
135 129
150 127
99 109
94
100
34 38 46 38 50 49
50 30 25 34 28 34 60
18 50
42 46 53 41
32 29 21 35 34
0 23
New Repair Replaced Missed
September 2020 Summary:
The statistics for September 2020 are as follows:
49 new bins - annual median of 38
127 repairs - annual median of 144
232 replaced bins - annual median of 279
41 missed bins by contractor - annual median of 35
Approximately 240,000 bins were collected this month, of which 41 bins were recorded as missed. This
number is higher than the annual median of 35 missed bins. 41 missed bins as a percentage of the total
number of bins collected is 0.017%.
A review process has identified Missed Services as slightly under reported as a single report may include
other properties similarly affected. Waste Services met with the contractor to discuss improvements to
reliability. The contractor has identified an additional step in their end of day process enabling drivers to
maximise the existing technology in the collection trucks. The contractor has subsequently commenced
training that incorporates additional checks to reduce the number of missed bins. The end of month Data
Collection Process will now capture the additional bins that are emptied based on that single report with
Waste Services verifying the data separately for quality purposes.
Page 7 of 17
Engineering & Commercial Infrastructure
                                                                             Monthly Review > September 2020

3.2                                   Dump Vouchers

                                                      No Vouchers issued             No Vouchers used             %
15' (valid to 31 March 2015)                                               145,344                      34,745        23.9%
15A (valid to 30 Sept 2015)                                                146,313                      32,736        22.4%
15B (valid to 31 March 2016)                                               146,790                      38,245        26.1%
16A (valid to 30 Sept 2016)                                                147,456                      36,797        25.0%
16B (valid to 31 March 2017)                                               147,411                      42,100        28.6%
17A (valid to 30 September 2017)                                           147,411                      35,725        24.2%
17B (valid to 31 March 2018)                                               147,555                      40,221        27.3%
18A (valid to 30 September 2018)                                           147,693                      35,622        24.1%
18B (valid to 31 March 2019)                                               147,984                      42,754        28.9%
19A (valid to 30 September 2019)                                           148,416                      36,112        24.3%
19B (valid to 31 March 2020)                                               148,647                      44,986        30.3%
20A (valid to 30 September 2020)                                           148,905                      36,291        24.4%
20B (valid to 31 March 2021)                                               149,175                         958         0.6%

Total number and $ value of vouchers presented to date:
2014/2015 Financial Year (to 30.06.2015)                                               58,276                    $419,227
2015/2016 Financial Year (to 30.06.2016)                                               75,459                    $553,204
2016/2017 Financial Year (to 30.06.2017)                                               76,790                    $542,853
2017/2018 Financial Year (to 30.06.2018)                                               72,685                    $558,552
2018/2019 Financial Year (to 30.06.2019)                                               77,218                    $639,860
2019/2020 Financial Year (to 30.06.2020)                                               85,258                    $643,421
2020/2021 Financial Year (to 30.06.2021)                                               19,384                    $142,718

                                      14000
      Vouchers Presented for Period

                                      12000

                                      10000

                                       8000

                                       6000

                                       4000

                                       2000

                                          0

                                                        Green Waste   General Waste

September 2020 Summary:
The number of vouchers presented during September 2020 is comparable to the number presented in
the same period last year.

The end of the season 20A occurred on 30 September with a 24.4% redemption rate. This is
comparable to other “A” seasons that end in September each year. The “A” season has dryer weather
and an average redemption rate of 24.1%. Conversely, the “B” season normally has a higher average
redemption rate of 27.5%, reflecting the seasonal change to wetter weather and also a higher number of
public holidays.
                                                           Page 8 of 17
Engineering & Commercial Infrastructure
Monthly Review > September 2020
3.3 Education
3.31 Material Recovery Facility (MRF) Tours:
Council’s Chief Operating Officer Water & Waste Services, Cameron Jessup, undertook a
familiarisation tour of the MRF
Due to COVID-19 all group tours of the MRF continue to be suspended
3.32 Education Programs Given Out in the Community:
Worm Farming Education given at Whitsunday Anglican School - Kindergarten
Waste Management Education given at Fitzgerald State School - Year 4
Waste Management Education given at Walkerston State School - Year 4
3.33 Waste Education Trailer Visits:
Visited Koumala State School with the Waste Education Trailer and gave Recycling and Worm
Farming Demonstrations to Year 3 students
Visited Whitsunday Anglican School with the Waste Education Trailer and gave Recycling and
Worm Farming Demonstrations to Year 1 students
-
3.34 Events
Great Northern Clean Up (GNCU) 2020 Report
Overview:
The weekend of 12 & 13 September 2020 was selected for the 2020 Great Northern Clean Up (GNCU)
in the Mackay Region.
Registrations:
There was a reduction in Mackay Regional Council site registrations in 2020 due to the COVID-19
restrictions.
Mackay Regional Council coordinated and registered the following seven sites:
Site Organisation/Residents
Bakers Creek (behind BMX) Walkerston BMX
Bucasia Beach Residents
Eimeo Beach Residents
Grasstree Beach Mackay Land Rover Club
Northwall Beach/Harbour Mackay Surf Riders Club
Riverside Drive Pioneer Catchment & Landcare
Sarina Beach Sarina Landcare
Page 9 of 17Engineering & Commercial Infrastructure
Monthly Review > September 2020
Volunteers:
Eighty-five (85) volunteers participated at Council’s Great Northern Clean Up sites across our region.
Volunteer numbers were less than half of last year due to the COVID-19 restrictions.
Promotion:
Promotion was also limited due to COVID-19 restrictions. Mackay Regional Council did not advertise to
the wider community this year. Promotion was encouraged by groups and individuals responsible for sites
and management of volunteer numbers.
Distribution Kits and Material:
Clean Up Australia provided a basic kit of support material to each community registered site. This
included bags, gloves, a sharps container, tongs, safety vest, hand sanitiser and paperwork. The clean-
up kits were distributed directly to the site supervisors who were given a briefing about their responsibilities
on the day.
Waste Collected:
Mackay Regional Council provided seven skip bins for collection of waste at sites. A total of 2.68 tonnes
of waste collected by volunteers was removed in skips and sent to landfill. Seventy-five (75) tyres, four
(4) oil drums, a large quantity of steel and a lawn mower were separately removed from sites for reuse or
recycling.
Other items collected included household goods, grass blowers, cardboard, Styrofoam, tarpaulins,
building waste and an array of food and beverage containers.
Site Feedback:
Bakers Creek
Walkerston BMX members identified Bakers Creek behind the BMX Club as an area needing a clean-up.
This Club participated in the Great Northern Clean Up for the first time this year. They put in an enormous
effort filling a 6-metre skip with rubbish that weighed in at 0.88 tonnes. Waste Services staff members,
Robyn Billings and Brett White, assisted with the removal of 55 tyres found at the Bakers Creek site. The
Club also organised a big clean-up of steel at the Club and arranged separate collection by a steel
recycler.
Photo: Robyn Billings and Brett White
Page 10 of 17Engineering & Commercial Infrastructure
Monthly Review > September 2020
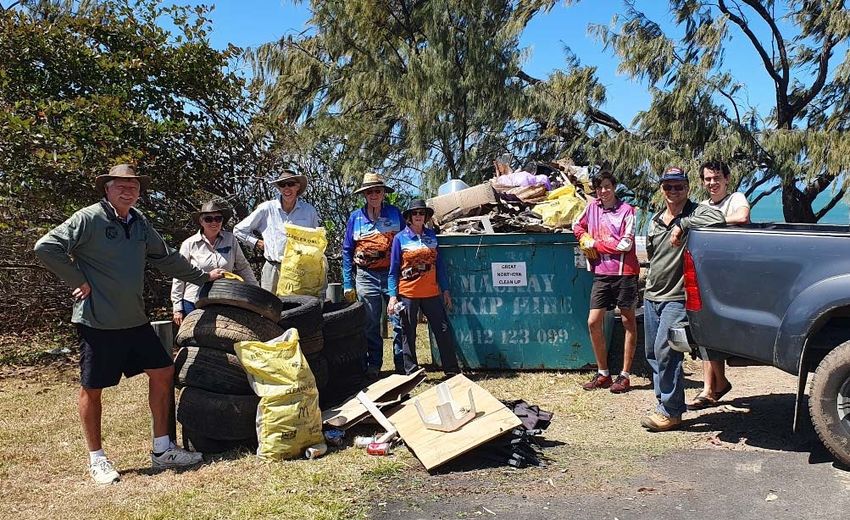
Grasstree Beach
The Mackay Land Rover Club put in a massive effort filling a 6-metre skip bin with 1.4 tonnes of rubbish
from the Grasstree Beach area. Fifteen (15) tyres were also found at this site and four (4) oil drums.
Photo: Mackay Land Rover Club Volunteers: Left to right – Bill Joyce, Karen Noble,
Bruce Noble, Nev Ross, Helen Joyce, Cooper Sander, Glenn Barker and Jai Sander.
(Missing from photo – Aidan Cameron, Christie Fay and Sarah Lethbridge)
Riverside Drive
The Pioneer Catchment & Landcare Group supervised this site for Council. This site was broken into two
(2) zones with a 3-metre skip bin provided for each zone. Traditionally this site attracts the most volunteer
numbers in our region. In 2019, fifty-two (52) volunteers cleaned up Riverside Drive. This year thirteen
(13) volunteers attended this site. A fantastic effort was achieved by this small team who removed 0.54
tonnes of waste from this illegal dumping hotspot. Cr Laurence Bonaventura assisted with his flatbed truck
which made hauling rubbish to the skips easy.
Zone A: Photo: Left to right: Robyn Billings, Mark Casey, Tom Crow, Raawi Tebao
and Cr Laurence Bonaventura
Page 11 of 17Engineering & Commercial Infrastructure
Monthly Review > September 2020
3.4 Community Engagement
Waste Services' engagement with the community on the services provided is monitored. The following
chart shows the number of media releases, media updates and the number of people that were reached
by the media releases on Facebook.
5 45,000
40,000
Reach on Facebook (People)
No. of Media Releases / Updates
4 35,000
30,000
3
25,000
20,000
2
15,000
1 10,000
5,000
0 0
Media Releases Media Updates Facebook People Reached
September 2020 Summary:
Media Releases Media Updates
New stickers help residents recycle right General waste truck to be used for recycling
service
Recycled glass road project a success
3.5 Facebook Feedback
The following chart shows the number of likes and positive comments, the number of neutral comments
and the number of negative comments received on Facebook from Media Releases and Media updates
for Waste Services.
160
140
Facebook Feedback
120
100
80
60
40
20
0
Likes Neutral Negative
Page 12 of 17Engineering & Commercial Infrastructure
Monthly Review > September 2020
September 2020 Summary:
Facebook Likes
18 – For post “Don’t let your vouchers go to waste” 56 – For post “Great Northern Clean Up”
Negative Comments
It would be great if dump vouchers were actually
posted to property addresses.
ASSET MANAGEMENT
4.1 Hogan’s Pocket Landfill Waste Disposal Tonnages
The following chart represents the tonnes disposed of at Hogan's Pocket Landfill for the period reported
by waste category. The chart now shows the difference between the major waste streams of Commercial
and Industrial Waste, Construction and Demolition Waste, Municipal Solid Waste, and Regulated Waste.
Tracking and reporting the individual waste streams will assist Council to assess trends from the various
sources.
The chart currently shows the continued variability in waste across the region.
9000
8000
7000
6000
Tonnes
5000
4000
3000
2000
1000
0
Month
Commercial & Industrial Construction & Demolition Limited Regulated Waste
Municipal Solid Waste Disposal Tonnages
September 2020 Summary:
The chart above shows the total waste range received at Hogan’s Pocket for the past 2 years varies
between 6,000 and 8,000 tonnes each month. In the month of September 2020, the total tonnes received
at Hogan’s Pocket Landfill is at the upper end of the range at 7,733 tonnes.
This change has been driven by an increase in Construction and Demolition Waste, to offset a slight
reduction in Commercial and Industrial Waste. At present, the main component of Commercial and
Demolition Waste is contaminated soil which reflects the higher level of development occurring within the
region.
Page 13 of 17Engineering & Commercial Infrastructure
Monthly Review > September 2020
Hogan’s Pocket Biogas Plant
3500
3000
2500
2000
Tonnes CO2
1500
1000
500
0
2017/2018 2018/2019 2019/2020 2020/2021
September 2020 Summary:
September 2020 data is real time data for the month and is reflected in the graph.
The Hogan’s Pocket Biogas Plant continued to perform during September 2020 without incident, flaring
2,654.23 tonnes of CO2-e (312,999 cubic metres) for the period which is within the expected range.
4.2 Green Waste Management
The following graph illustrates the tonnage rates for green waste received and processed for 2018/2019,
2019/2020 and 2020/2021.
1800
1600
1400
1200
Tonnes
1000
800
600
400
200
0
Month
Greenwaste Received Greenwaste Processed
September 2020 Summary:
During the month of September 2020, 691 tonnes of green waste was received in comparison to 606
tonnes received during August 2020. The first batch of biosolids/green waste compost was sent to market
during the month after a 26-week processing period.
Page 14 of 17Engineering & Commercial Infrastructure
Monthly Review > September 2020
4.3 Material Recovery Facility Operations
The following graph shows tonnages of materials processed at the Materials Recovery Facility (MRF).
2250
2000
1750
1500
1250
Tonnes
1000
750
500
250
0
Month
Inbound tonnages Product to Market Waste to landfill
September 2020 Summary:
Council’s contractor continues to work to locate new markets for the cleaner recycling product being
produced. During September 2020 cardboard/mixed paper and glass found markets. A large batch of
approximately 1,000 tonnes of the previously stockpiled Recycled Crushed Glass (RCG) has been sold
as coarse drainage sand, slightly skewing the above sales figures. The recycled market pricing continues
to be subdued due to the volatility being experienced by industry.
4.4 Resource Recovery Facility – Tonnages
The below graph shows the total tonnages sold at the Resource Recovery Facility by Incredable from
July 2019, and the residual that was sent to landfill.
400
350
300
250
200
150
100
50
0
Total Tonnages Sold Residual
Page 15 of 17Engineering & Commercial Infrastructure
Monthly Review > September 2020
September 2020 Summary:
Tonnes of material diverted from landfill in September 2020 are slightly higher than the August 2020
figure.
It is believed that the high tonnages received during May 2020, may have resulted from the COVID-19
restrictions and residents spending more time at home. Consequently, the clean-ups at residential
properties appear to have peaked during that period and subsequent tonnes received have declined.
With the school holidays occurring in September 2020 there was a slight increase in tonnages sold
compared with August 2020 figures.
REGULATORY COMPLIANCE
5.1 Surface Water Discharge Management
There were no stormwater releases at Hogan’s Pocket Landfill during the reporting period.
5.2 Waste Facility Audits
Inspection Number %
Completed/ Risk Comments
Frequency required Complete Carryover
Bi-Monthly 17 100% 0
All audits were completed in a timely manner.
5.3 Landfill Biogas Safety
As previously reported, Resources Safety & Health Queensland undertook a recent Audit of the Safety
Management System and provided feedback in July 2020 on improvements to be incorporated into the
Safety Management System, for the Council operated Landfill Biogas System.
Waste Services completed and submitted an Action Plan to address these improvements in August 2020.
Several Workshops have been completed this month and progress has been made with the committed
improvements outlined in the submitted Action Plan.
MANAGEMENT INITIATIVES
6.1 COVID-19 – Waste Services Status
Waste Services continues to implement relevant parts of its Business Continuity Plan and has continued
to apply all Council, State and Australian Government directives where necessary.
In terms of operations:
All sites and services are open as per normal operations; and
Collection services currently operate as per normal operations
As the current situation evolves, Waste Services will continuously monitor any impacts and, with approval,
modify and respond in accordance with the local circumstances.
Page 16 of 17Engineering & Commercial Infrastructure
Monthly Review > September 2020
6.2 Current Waste Services Management Improvements
Waste Services has been working on several initiatives this month, with the ongoing commitment to
improve the Waste Services business. Some of the business improvements that are currently being
actioned include:
Waste Management Strategy Review:
o Workshops with the Waste Services Team have commenced with a focus on potential
strategy structure and initial options identification for future options analysis
o Next phase will be Consultant procurement with concurrent work with the Waste Services
Team on options identification
Capital Project – Stormwater Network Improvements Project at Hogan’s Pocket Landfill
o Currently in Design Phase
Capital Project – Batter Chutes Replacement Hogan’s Pocket Landfill
o Design Completed
Operational Project - Asset Management Project
o Data Structure Developed
Operational Project - Closed Landfill Review
o Initial Site Review Completed
o Procurement of a Consultant to be engaged to manage the Audit process has
commenced
Closed Landfill Bores Review commenced with data collation
Polystyrene Recycling Viability Initial Assessment is underway
Waste Services' participation in the Business Process Management Project has commenced; i.e.
Council’s Corporate approach for process review. The Team has undertaken initial training.
Page 17 of 17You can also read