Enough to Eat: The Impact of COVID-19 on Food Insecurity and the Food Environment in L.A. County April 2020 -September 2021
←
→
Page content transcription
If your browser does not render page correctly, please read the page content below
Enough to Eat: The Impact of COVID-19 on
Food Insecurity and the Food Environment in
L.A. County April 2020 –September 2021
Recommendations from the First 18 Months of the Pandemic
to Strengthen our Food Systems

                                                                       AUTHORS
                                                               Kayla de la Haye
                                                                    John Wilson
                                                           Wändi Bruine de Bruin
                                                                        Kenan Li
                                                                Michelle Livings
                                                                      Mengya Xu
                                                                   Sydney Miller
                                                                 Maansi Solanky
                                                                     Kate Weber
                                                              Marianna Babboni
                                                                    Rachel Wald
                                                                  Alison Frazzini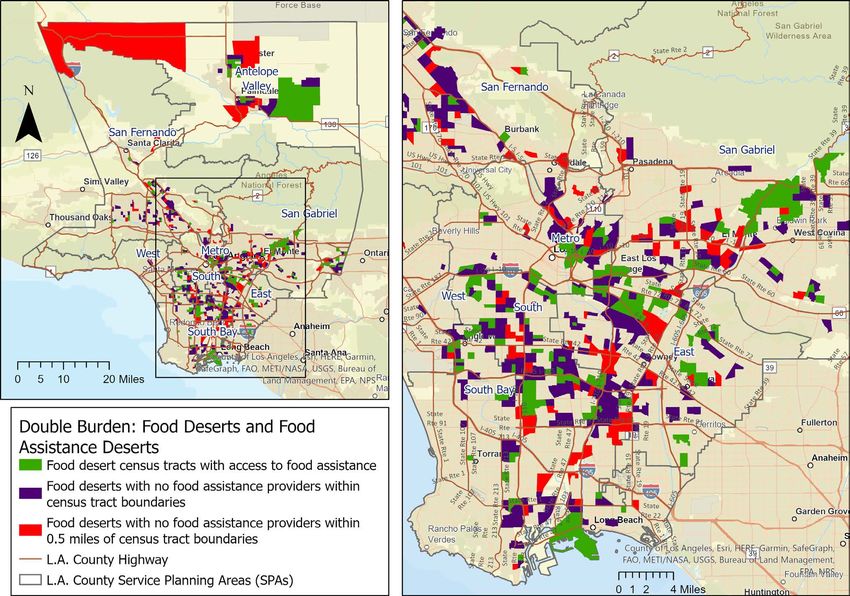
Acknowledgments
This report was prepared in coordination with the Los Angeles County Emergency
Food Security Branch as part of a strategic partnership on food insecurity between
L.A. County and Public Exchange at the University of Southern California (USC) Dorn-
sife College of Letters, Arts and Sciences. We are grateful for the expert advice of
leadership at the Emergency Food Security Branch and the County of Los Angeles,
particularly Gary Gero, Dipa Shah-Patel, and Swati Chandra.

Sincere thanks to our partners at findhelp.org and to Kevin Knaust, Alison Glazer, Carl
Bialik, and Jessica Mouras from Yelp. We have a much richer picture of the food land-
scape in L.A. County thanks to your efforts and data sharing. We are also grateful to
the representatives from food pantries in L.A. who shared their experiences with us.

This project was supported by the USC Dornsife Emergency Fund and by the Keck
School of Medicine of USC COVID-19 Research Fund through a generous gift from the
W. M. Keck Foundation. We would also like to acknowledge USC for providing the
funding for L.A. surveys under USC's Understanding Coronavirus in America project,
as well as the USC Dornsife Center for Economic and Social Research, which adminis-
ters the surveys and provided support for the data analysis.

Finally, a huge thank you to Dennis Lan for supporting the design and visual develop-
ment of this project from conception to completion. Because of his excellent work, our
findings are more accessible to a public audience and will impact many more readers.

                                    Disclaimer
The views expressed herein are those of the authors and not necessarily those of
Los Angeles County, the USC Dornsife College of Letters, Arts and Sciences, the
Keck School of Medicine, or the University of Southern California as a whole.

             For more information, contact: publicexchange@usc.edu.
Introduction

The onset of the COVID-19 pandemic in March 2020 posed unique and significant challenges for urban areas. The high
concentrations of economic activity and population density made these regions hotspots for infections. With nearly 10
million residents accounting for 27% of California’s population, Los Angeles County was no exception. The county has
been one of the hardest-hit urban areas in the United States throughout the course of the pandemic. Over the 18-month
period from March 2020 to September 2021, the county has navigated through several infection “waves” that, to date,
have caused more than 1.4 million recorded COVID-19 infections and 25,000 deaths.

To reduce the transmission of the disease and save lives, local authorities responded with a range of mitigation efforts,
such as “safer at home” emergency orders that closed many public buildings and transitioned schools and workplaces
online and “social distancing” protocols that minimized the number of people who could congregate in indoor spaces. A
byproduct of these mandates was job loss and economic upheaval.

The mandates also led to changes to the local food landscape and where people accessed food. Some mandates re-
quired the adoption of new safety procedures in food outlets, such as grocery stores reducing their customer capacity
to 20-50%, while others required the cessation of indoor service at bars and restaurants. For example, on March 16th,
2020, indoor dining in L.A. County was suspended, it resumed at the end of May 2020, and it was suspended again from
July 1, 2020 through to March 12th, 2021, when second and third waves of infection took hold (see Appendix 1). At times,
residents also lost access to meals at schools and community centers and were cut off from their social networks and the
food support they provide. Broader disruptions to national and international food production and distribution systems
also led to shortages and increased prices for some staple foods. All of these disruptions likely reduced food accessibili-
ty, particularly for low-income residents who are vulnerable to food insecurity.

Food insecurity refers to disruptions in food access and regular eating because of limited money or other resources.
Although food insecurity often results in hunger, it is also linked to a host of negative physical and mental health out-
comes for children and adults, including poor nutrition, problems with mental health, cognition, and sleep, and greater
risk for diet-related diseases such as obesity, diabetes, and hypertension (Dhurandhar, 2016; Gundersen & Ziliak, 2015).

Our team of experts in public health, nutrition and food systems, spatial sciences, psychology, and public policy formed
a strategic partnership with L.A. County’s Emergency Food Security Branch in April 2020 to monitor food insecurity,
food access and diet in the county. The county established the Emergency Food Security Branch at the beginning of the
pandemic as part of its emergency operations to address food security. For the past 16 months, our USC team and L.A.
County have been working together to understand the impact of COVID-19 on the ability of county residents to access
food.

Under this partnership, we documented a large increase in rates of food insecurity in 2020, particularly in the early stag-
es of the pandemic, from April to May. We profiled those who experienced food insecurity and identified socioeconomic
and racial and ethnic disparities, as well as key risk factors for food insecurity that included: low household income,
recent unemployment, being 41–50 years old, and living in a larger household. We examined changes in diet during the
pandemic and found that dietary changes, both healthy and unhealthy, were most commonly observed among those
who experienced food insecurity. (See de la Haye et al., 2020; de la Haye et al., 2021; Miller et al., 2021.)

We also sought to understand the impact of the many initiatives that help people access healthy food. At the onset of
the pandemic, existing charitable and government food assistance programs expanded and adapted to meet changing
needs, and new programs were launched. For example, CalFresh (also called the Supplemental Nutrition Assistance
Program, or SNAP, a critical food safety net for low-income families) benefits were expanded, and L.A. County programs
were tailored to elderly adults to deliver meals to their homes and offer free delivery of pre-paid foods. Our research
found that residents used a range of these community and government resources to mitigate food insecurity. These find-
ings helped inform L.A. County’s COVID Food Assistance Grant Program and guided various L.A. City initiatives to raise
awareness of financial and food assistance resources for specific target audiences.

Following our earlier reports, this final report summarizes the current state of food insecurity in L.A. County. We
find that rates of food insecurity have declined since the onset of the pandemic, but 1 in 10 households remained food
insecure in the first half of 2021. This report also describes access to food outlets and food assistance during the
pandemic, and variability and vulnerability in food access, using innovative data and analytics to understand the
complexity of the L.A. County food environment. We conclude with recommendations based on this analysis and our 16
months of research.

In October 2021, L.A. County will build on the work it started with the Emergency Food Security Branch by joining with
philanthropic partners to launch a Food Equity Roundtable, with the goal of increasing the resilience and equity of the
food system and food access across the county. Reducing household and community vulnerabilities to food insecurity is
critical as we transition into a post-pandemic world. At the same time, we must also promote nutrition security. This will
be achieved when all people have physical, social, and economic access to food that is consumed in sufficient quanti-
ty and quality to meet their dietary needs and food preferences and is supported by an environment that allows for a
healthy and active life (Ingram, 2020).

This work would not have been possible without the dedicated partnership and steadfast determination of the team at
the L.A. County Emergency Food Security Branch as well as private sector partners Yelp and findhelp.org who generously
shared a wealth of data on the L.A. County food environment. Our hope is that our work will continue to help commu-
nity and government stakeholders identify outstanding needs and vulnerabilities in food access and food and nutrition
security in the county, and inform strategies that strengthen the local food system, ensuring it is equitable, resilient and
provides all people with sufficient access to healthy food.
Measures           In this report, our findings are based on the following data sources:

Understanding      Our research uses data from USC Dornsife’s Understanding Coronavirus in America track-
Coronavirus in     ing survey to understand food insecurity among adults (18 years and older) during the
America tracking   COVID-19 crisis. Survey data were collected every 2 to 4 weeks from a representative
                   sample of L.A. County households (N≈1800). At each survey wave, participants reported
survey
                   on their experiences of food insecurity over the past week. We measured food insecurity
                   using three items from the validated Food Insecurity Experience Survey that assess behav-
                   ioral markers of mild, moderate, and severe levels of food insecurity experienced over the
                   past 7 days (Cafiero, 2018). As is standard in research on food insecurity, a household is
                   classified as being food insecure if they report experiencing moderate or severe levels of
                   food insecurity. This report presents our key results after 31 waves of survey administration,
                   assessed between April 2020 and July 2021. Other variables used in these analyses are
                   measured at each wave (where indicated), or assessed at regular intervals to ensure they
                   are current. For example, household income is assessed quarterly, and our analyses use
                   the most recent indicator.

Yelp               Our team partnered with Yelp, the local search and review platform, to gather information
                   about businesses labeled as food outlets within L.A. County from January 2019 to June
                   2021, including which ones have closed or stayed open. Their data includes information
                   about all types of businesses that provide food, including street food vendors, farmers
                   markets, convenience stores, fast- and full-service restaurants, supermarkets, and large
                   big-box food retailers. The data used in the analysis for this report includes specific infor-
                   mation about each food outlet: business name; location (geo coordinates and street ad-
                   dress); descriptive “tags” that identify the type of business (e.g., restaurant, convenience
                   store); and the dates between January 2019 to June 2021 when the business was perma-
                   nently closed, temporarily closed, or had special operating hours.

Findhelp.org       Our team also partnered with findhelp.org, which provides a free search and referral
                   platform (findhelp.org) to connect people seeking help with local free and reduced-cost
                   programs, with dignity and ease. In December 2020, Findhelp.org shared their database of
                   L.A. County food assistance providers. The data used in this report includes specific infor-
                   mation about each food assistance program: the business/organization name; location (geo
                   coordinates and street address); and descriptive service tags that categorize the type of
                   food assistance provided (“meals,” “food pantry,” “emergency food,” and “food delivery.”)

Interviews with    To understand the experience of food pantries during the COVID-19 pandemic, our team
L.A. County        interviewed representatives of 12 food pantries in South L.A., a region of the county that
Food Pantries      experienced disproportionately high rates of food insecurity and that has a high ratio of
                   food deserts and “food assistance deserts.” Interviews, which included closed-ended and
                   open-ended questions, were conducted in Summer 2020.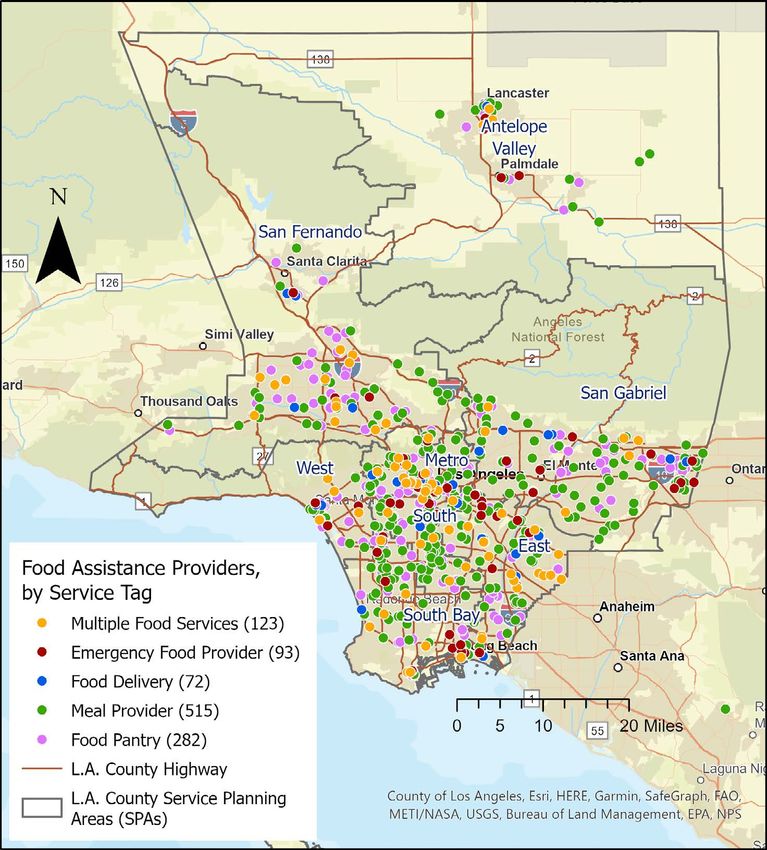
Key Findings: L.A. County Residents

1.      1 in 3 L.A. County households experienced food insecurity during the
        COVID-19 pandemic in 2020, and they faced different challenges

Our research found that 1 in 3 households (34%) in L.A.
County experienced food insecurity between April and
December 2020 (de la Haye et al., 2021). Those with the
greatest risk for food insecurity were living in poverty
or with low incomes. There were also other factors that                  1 in 3 households (approximately
increased vulnerability to food insecurity, including unem-              1.2 million households) in L.A.
ployment, young adulthood (18–50 years old) and living
in a single-parent household. Food insecurity was much
                                                                         County experienced food insecurity
more common among Latino and African American resi-                      between April and December 2020.
dents compared to non-Hispanic White and was more
prevalent in particular geographic regions. Our research
also documented many challenges with broader food                    ing CalFresh (SNAP), WIC, Pandemic-EBT and other forms
access among people experiencing food insecurity in L.A.             of financial assistance. We found that receipt of CalFresh
County. A lack of personal transportation, food outlet clo-          benefits was associated with a lower risk for food insecuri-
sures or limited hours, and the inability to use food deliv-         ty (de la Haye et al, 2020), in line with historical literature
ery services were common barriers reported among those               on the benefits of SNAP. However, of the people who
experiencing food insecurity (de la Haye et al, 2020).               experienced food insecurity, the majority (78%) were
                                                                     not enrolled in CalFresh, and we estimated 38%–48%
Federal, state, and local governments, as well as commu-             were likely eligible for CalFresh but not enrolled.
nity-based organizations, responded to increased food
needs — despite many challenges — by providing emer-                 Overall, there are likely no “silver-bullet” solutions that
gency food relief and stable food and financial assistance to        will ensure equitable access to food, and food and nutri-
low-income residents. Based on our survey data, we found             tion security for all L.A. County residents. Transformation
that adults in L.A. County who experienced food insecuri-            of the broader food system — by addressing multiple vul-
ty accessed a variety of resources, including food pantries          nerabilities — is likely to be more effective at reducing
and other charitable food assistance, help from family               food insecurity in the future.
and friends, and a range of government programs includ-

  Note: The high rates of food insecurity found in our research are aligned with multiple reports that documented high rates of
  food insecurity and food insufficiency (the latter defined as whether a household had enough to eat, akin to very low food
  security) in the U.S. and California during the pandemic (e.g., Wolfson & Leung, 2020). The results are largely based on repre-
  sentative population surveys that include brief assessments of the past week or past month experiences of food insecurity or
  food insufficiency, measured at several time points during the pandemic. However, a recent U.S.D.A. report stated that food
  insecurity rates in the U.S. had not increased during the pandemic, but remained stable at 10.5% in 2019 and 2020 (Cole-
  man-Jensen et al., 2021). They also reported a small decline in the average annual rates of food insecurity in California: an
  average of 9.8% from 2018 to 2020, compared to an average of 11.2% in 2015-2017.
  One difference in the methods used in this U.S.D.A. report, compared to others, was that participants completed one survey
  in December 2020 and reported on their experience of food insecurity over the past 12 months. It is possible that participants
  who experienced food insecurity in the early months of the pandemic (April, May), and then transitioned to food security, were
  less likely to recall their experiences by the time they completed the survey in December, given decays in human memory over
  time. Differences in the survey measures of food insecurity used across the studies (e.g., measures of food insecurity vs. food
  insufficiency, or with single or multiple questions) may also contribute to some of the differences in estimated food insecurity
  rates. Future research should address these questions.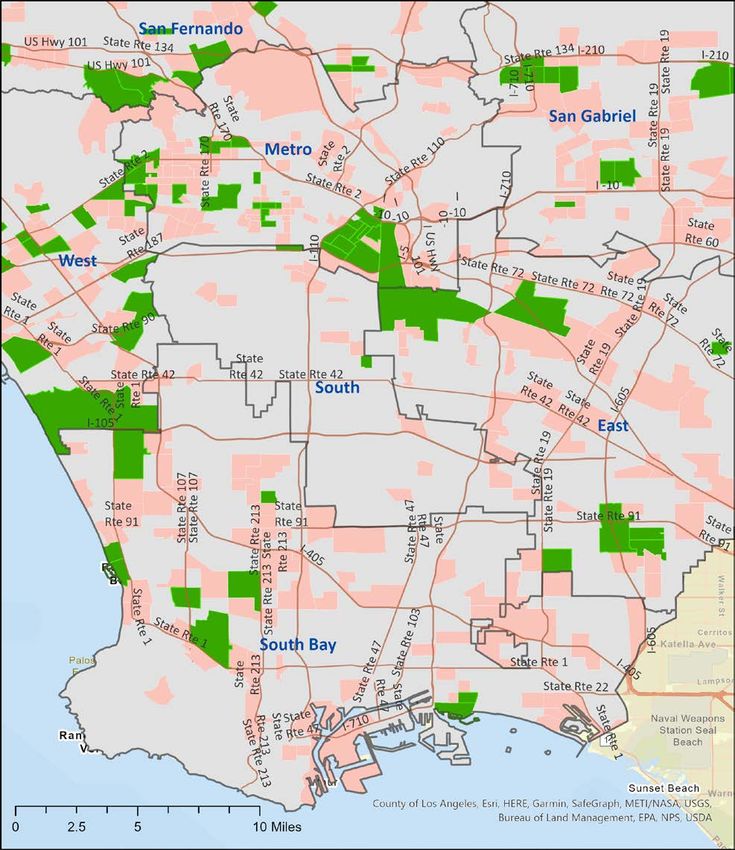
2.       1 in 10 L.A. County households remained food insecure in the
         first half of 2021

One in 10 (10%) households in L.A. County experienced                 demic. In April 2020, when we started our tracking sur-
food insecurity in the past week at some point from Jan-              vey, rates of past week food insecurity peaked at 23% and
uary to June 2021. When considering low-income house-                 dropped to 10–12% by May.
holds only (i.e., those with incomes below 300% of the
federal poverty line [FPL]), 15% experienced food insecuri-           The current rates of food insecurity in 2021 may be even
ty, while 4% of higher-income households (≥300% of FPL)               lower than pre-pandemic levels. In 2018, 27% of low-
experienced food insecurity.                                          income households experienced food insecurity at some
                                                                      point during the previous 12 months (LAC DPH, 2018). This
The rates of past week food insecurity for a given survey             is almost double the 15% of low-income households we
wave also fluctuated between 5% and 9% between Jan-                   have observed experiencing food insecurity in the first half
uary and June 2021, although these were not statistically             of 2021. Given we found that it is largely the same house-
significant differences. Additionally, we found that it was           holds that have transitioned in and out of food insecurity in
largely the same households fluctuating in and out of food            2021, it seems unlikely that the proportion of low-income
insecurity over the 6 months, resulting in a total of 10%             households with food insecurity would reach 27% by the
of households experiencing food insecurity over the full              end of the year. This positive transition may be attributable
6-month period.                                                       to the broad range of government and charitable food as-
                                                                      sistance initiatives that were launched or expanded in the
These rates of food insecurity in the first half of 2021 were         initial months of the COVID-19 pandemic.
notably lower than rates at the onset of the COVID-19 pan-

                  Figure 1. Rates of past week food insecurity in L.A. County households were highest in April 2020,
                  when we started our tracking survey, and then fluctuated around 10% from June 2020 to June 2021.

  30%

  25%

  20%

  15%

  10%

   5%

   0%
        APRIL                JULY                  OCTOBER                 JANUARY               MARCH /APRIL            JUNE
        2020                 2020                    2020                    2021                   2021                 2021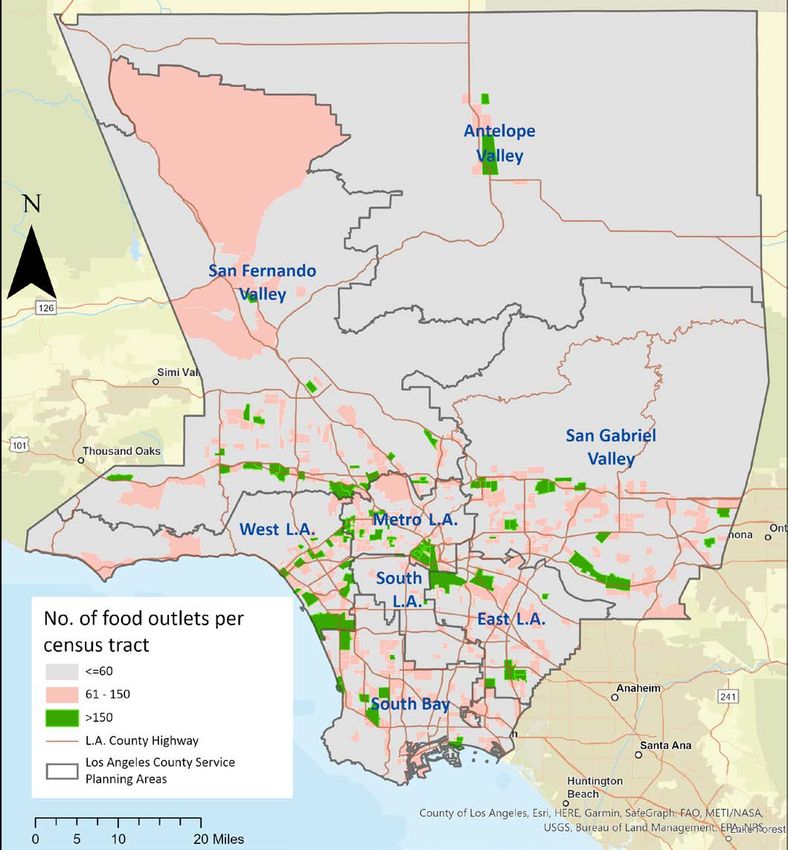
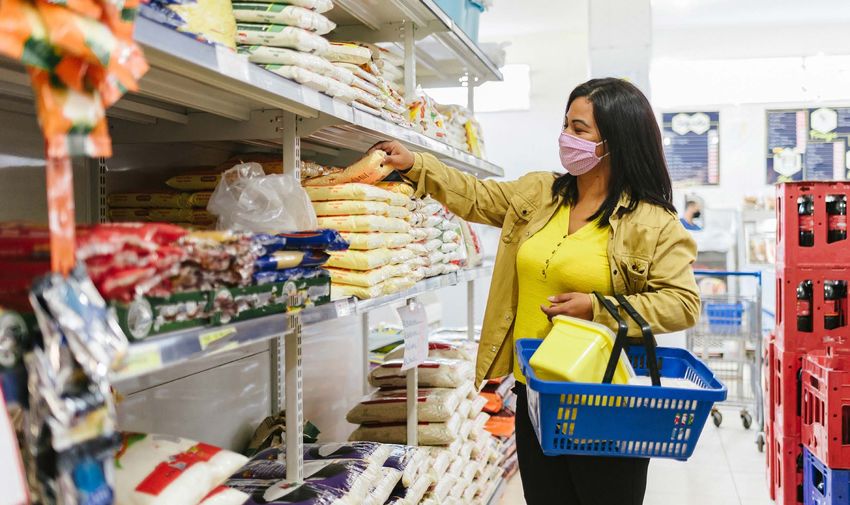
3.      Adults who remained food insecure in the first half of 2021 are
        predominantly low-income, Hispanic/Latino, and < 40 years old

Of the 1 in 10 (10%) of L.A. County adults who experienced                unemployed had 2.0 times the likelihood of being food
food insecurity in the first half of 2021, the majority are               insecure compared to people who were employed.
low-income (82%), Hispanic/Latino (59%), 18–40 years                   • After household income and employment status were
old (59%), and female (61%). Figure 2 summarizes their                   accounted for, two other factors predicted food inse-
demographics.                                                            curity risk: (i) People aged 18 to 30 had 1.7 times the
                                                                         likelihood of experiencing food insecurity compared to
In statistical models that test for multiple factors that                people 65 and older. (ii) People with children in their
could increase or decrease someone’s risk of food insecu-                households (children of any age, from 0 to 18 years) had
rity, several factors are independently associated with sig-             2.4 times the likelihood of experiencing food insecurity
nificantly higher odds of being food insecure from January               compared to those without children. Importantly, this
to June 2021. We tested several factors, including gender,               effect is significant even when accounting for household
age, household income, education level, employment,                      poverty level, computed based on household income
status, and household size. The following characteristics                relative to the number of people living in the household.
all predicted food insecurity risk:
• As expected, and as we found during 2020, being low-                 This 10% of L.A. County households who have remained
  income significantly increased the odds of being food                food insecure in 2021 appear to face several barriers to
  insecure: People with a household income < 300%                      food access and assistance. Just 1 in 4 (25%) of these
  FPL had 2.8 times the likelihood of experiencing food                households were receiving CalFresh benefits as of June
  insecurity compared to people with higher incomes.                   2021, and 37% of these households live in “food deserts”
  Over and above the effects of income, people who were                — low-income areas with poor access to grocery stores.

    Figure 2. Demographic characteristics (%) of L.A. County adults who remained food insecure in the first 6 months of 2021 (N=108).

    Female                          61%
    Male                            39%
    18–30 years old                 34%
    31–40 years old                 25%
    41–50 years old                 16%
    51–64 years old                 15%
    65+ years old                   10%
    Hispanic/Latinx                 59%
    White                           16%
    Black/African American          7%
    Asian                           18%
    Low-income (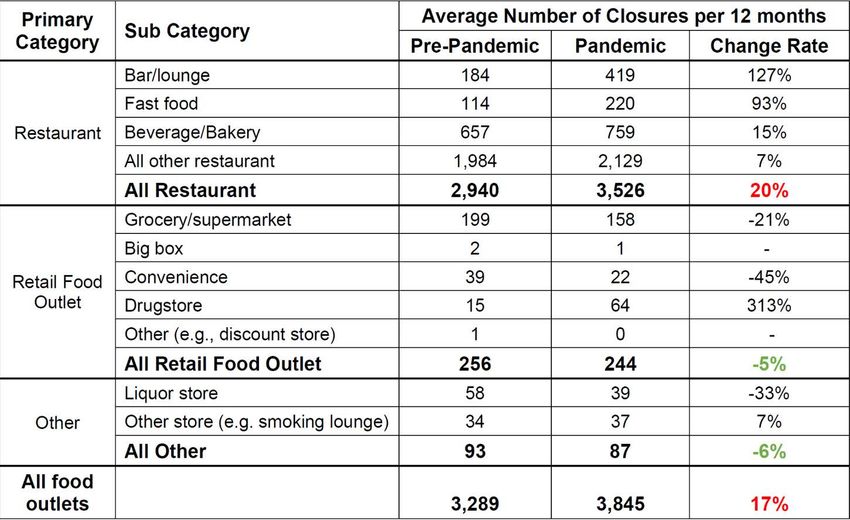
Key Findings: L.A. County Food Environments

4.      COVID-19 temporarily reduced the number of places L.A. County
        residents could buy food, particularly restaurants, affecting food
        access for low- and high-income residents

1 in 4 residents of L.A. County live in a “food desert,”                three times the number of food outlets (30,257) listed
meaning they live in a census tract where many residents                in L.A. County by traditional business listings (InfoUSA
are low-income and do not have close access to a super-                 proprietary business listings from 2018). This may reflect
market (U.S.D.A., 2020). Although spatial access to a super-            a more comprehensive and diverse set of food sources
market is just one of many possible barriers to access-                 captured by the crowdsourced Yelp data. These 111,451
ing food, research prior to the COVID-19 pandemic found                 food outlets were found to be concentrated in key “food
that living in a food desert reduces one’s access to quality,           corridors” across the county (Figure 3).
healthy foods and in some studies is associated with poor
diets or related diseases (Walker et al, 2010). Our team                Of these 111,451 sources of food:
heard anecdotes from local community organizations that                 • The majority (90,428, or 81%) are restaurants, and of
the pandemic has exacerbated peoples’ difficulties in ac-                 these, we identified 5,536 (6%) as known “fast food”
cessing food, especially when they are low-income and liv-                chains.
ing in a food desert. However, getting data about the food
                                                                        • 15,592 (14%) are retail food outlets, and of these,
environment, and how it has changed throughout the pan-
                                                                          the majority (12,529, or 80%) are grocery stores and
demic, has been a major challenge.
                                                                          supermarkets (including specialty markets and grocers).
                                                                          Other types of retail food outlets included convenience
Our analyses of data from Yelp, the local search and review
                                                                          stores, big-box or ‘club’ stores (e.g., Walmart, Costco),
platform, revealed the richness of the food environment
                                                                          and drug stores.
in L.A. County and provided real-time information about
how it has changed. Using both business names and                       • The remaining 5,431 “other” food outlets include liquor
descriptive tags associated with the food outlets, we                     stores (2717, or 50%) and businesses whose primary
identified 111,451 food outlets located in L.A. County                    focus was not food sales, but who nonetheless were
between January 2019 and June 2021. This is more than                     tagged as a source of food (e.g., art stores, water stores,
                                                                          other shopping outlets).

                    Table 1. Of the 111,451 food outlets identified in L.A. County, the majority are restaurants (81%),
                                               and about 1 in 7 (14%) are retail food outlets.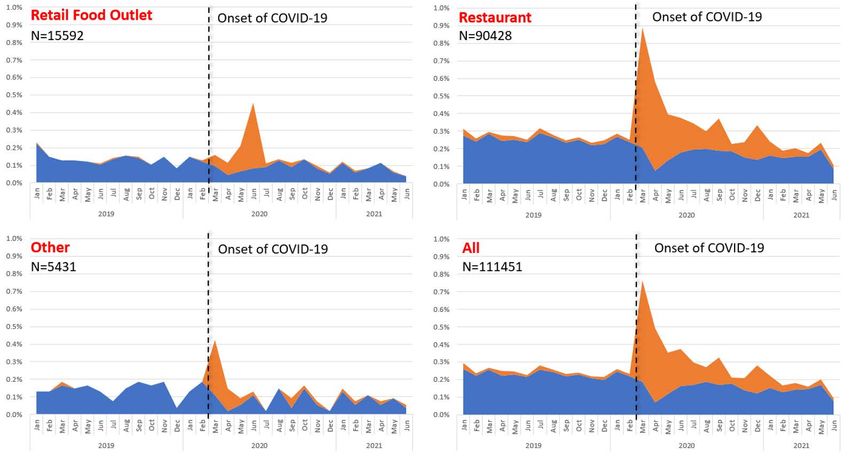
Figure 3. The number of food outlets per census tract in L.A. County varies, with many of the 111,451 food outlets in the county
            concentrated in key “food corridors” — census tracts with more than 150 food outlets — that are depicted in green.

                                            Click here to view the interactive map

We observed changes to the L.A. County food environ-                     all food outlets.
ment during COVID-19 due to an increase in food outlet
closures, largely among restaurants.                                     Table 2 also shows that the increase in food outlet clo-
                                                                         sures occurred largely among restaurants: There was a
As L.A. County navigated through multiple waves of the                   20% increase in the average number of annual restaurant
pandemic, mandates prohibiting indoor (and sometimes                     closures during the pandemic (3,526 during the pandemic
outdoor) dining, implementation of new safety protocols,                 vs. 2,940 pre-pandemic). For retail food outlets, the aver-
and other disruptions to the economic and food system                    age number of annual closures did not meaningfully change
impacted the operations of many food businesses. How-                    (256 pre-pandemic vs. 244 during the-pandemic). Notably,
ever, it was unclear if or how this affected the closure of              the only type of retail food outlet with an increase in clo-
restaurants and retail food outlets — and thus residents’                sures during the pandemic was drug stores (which were
food access — given that many food outlets pivoted their                 labeled with a “food” tag in the Yelp database); the aver-
operations to provide delivery or “contactless pickup” op-               age number of annual closures was 15 pre-pandemic, vs. 64
tions for groceries and prepared food and beverages, and                 during the pandemic.
many restaurants set up outdoor “alfresco” dining options.
                                                                         The increase in food outlet closures during the pan-
Using Yelp data on openings and closures of 111,451 food                 demic was attributed to a spike in temporary closures
outlets in L.A. County, we found an increase in the                      during key “waves” of COVID-19 infection in L.A. Coun-
number of food outlet closures during the pandemic.                      ty, which varied based on the type of food outlet.
As shown in Table 2, there was an average of 3,845 food
outlet closures (temporary and permanent) per 12 months
during the pandemic (calculated using data from March                       There was a 17% increase in
2020 to June 2021), compared to an average of 3,289 food
outlet closures per 12 months pre-pandemic (calculated                      food outlet closures during the
using data from January 2019 to February 2020). This is a                   pandemic.
17% increase in the average number of annual closures for
Table 2. The number of food outlet closures (average per 12 months) in L.A. County was higher during the COVID-19 pandemic (from
March 2020 to June 2021) compared to the 14 months preceding the pandemic (January 2019 to February 2020).
Figure 4. The percentage of food outlets with permanent and temporary closures each month from January 2019 to June 2021
showing spikes in temporary closures at the onset of the pandemic in March 2020 for restaurants and “other” food outlets
and a spike in temporary closures in June 2020 for retail food outlets.
Permanent TemporaryFigure 4 shows that the increase in food outlet closures The different timing of the increased closures for restau-
was driven by temporary closures specifically (orange rants vs. retail food is worth exploring in future work. The
area), while the rates of permanent closures (blue area) highest number of restaurant closures may have occurred
were actually lower during the pandemic compared to the in March 2020 because this was when the first indoor din-
pre-pandemic period. In March 2020, 852 of all food out- ing ban went into effect, and many restaurants temporarily
lets were recorded as having closed: 644 temporarily closed. In the subsequent weeks and months, these same
and 208 permanently. Temporary closures were found to restaurants may have come up with strategies to stay open
last from 1 to 384 days, with the average time from closure and provide outdoor options (e.g., alfresco dining) and/or
to re-opening being 24 days. (See Figure 5). delivery food services that helped them stay open through
later stages of the pandemic, including subsequent indoor
Increases in temporary closures were expected given the dining bans. The June 2020 spike in temporary closures
time-bound mandates banning indoor dining and drinking among food retail outlets may have several explanations.
at bars at key stages of the pandemic. It is plausible that This coincided with protests related to the murder of
the rates of permanent closures in food outlets dropped George Floyd, which prompted many retail outlets in L.A.
during the pandemic while more businesses were ‘‘on hold’’ to board their storefronts and temporarily close. Alterna-
with temporary closures, or due to government business tively, there may have been a lagged effect of the pandemic
support and possibly fewer new food retail openings affect- onset on temporary closures among food retail, after the
ing competition. initial rush of grocery shopping and “grocery hoarding” had
subsided, and major challenges to the food distribution
The spikes in temporary closures also varied based on food systems started to ripple down to retailers.
outlet type (Figure 4). Restaurant closures were especially
high in March 2020, during the initial “wave” of virus out- Overall, the waves of temporary closures help to identify
break in L.A. County, when 617 restaurants were listed the time periods when the impacts of the pandemic on the
as having temporarily closed. This coincided with L.A. “last mile” of the food system were the most serious.
County mandates that suspended indoor dining on March
16, 2020. However, retail food outlet closures peaked in By examining where food outlet closures occurred in
June 2020, with 58 temporary closures that month, at the L.A. County, we found that closures impacted well-
time of the second COVID-19 wave. resourced and under-resourced neighborhoods.
Figure 5. Temporary closures for food outlets spiked during the pandemic, but this was quickly followed by a spike in re-openings.
The number of days outlets were closed ranged from 1 to 384 days (110 of the temporary closures were just for one day), and the average
time from closure to reopening was 24 days. The spikes coincided with key L.A. County mandates throughout 2020: March 16,
when indoor dining was suspended and grocery store capacity reduced to 50%; May 29, when indoor dining resumed; July 1, when
indoor dining was again suspended; November 25, when outdoor dining was suspended; and December 6, when grocery store
capacity was further reduced. (See Appendix 1 for details.)We compared the numbers of food outlet closures in In sum, food outlets in L.A. County were temporarily
low-income vs. high-income census tracts, and within closed at a higher rate during the pandemic, and this was
food desert vs. non-food desert census tracts. Overall, largely driven by the closure of restaurants. This may pres-
we found that the increased number of closures during ent a meaningful barrier to food access because about
the pandemic period, compared to the pre-pandemic one-third of calories that Americans with low-incomes
period, occurred in all types of census tracts. For consume comes from food prepared outside of the home,
example, the average number of food outlet closures per with ≈15% of calories coming from fast food restaurants
month increased in low-income census tracts (128 per and ≈5% coming from full service restaurants (Saksena
month pre-pandemic vs. 135 per month during the pan- et al., 2018). Although the reduction in access to restau-
demic) and in high-income census tracts (145 per month rants and some other food outlets affected both high- and
pre-pandemic vs. 184 per month during the pandem- low-income neighborhoods, it is likely that low-income
ic). Similarly, the average number of food outlet closures residents were the most negatively affected by food outlet
per month increased in food desert census tracts (42 per closures because they are already more likely to face other
month pre-pandemic vs. 46 per month during the pandem- challenges to food access including: food insecurity, find-
ic) and in non-food desert census tracts (231 per month pre- ing food assistance, and navigating public transportation
pandemic vs. 273 per month during the pandemic). to safely pick up food.
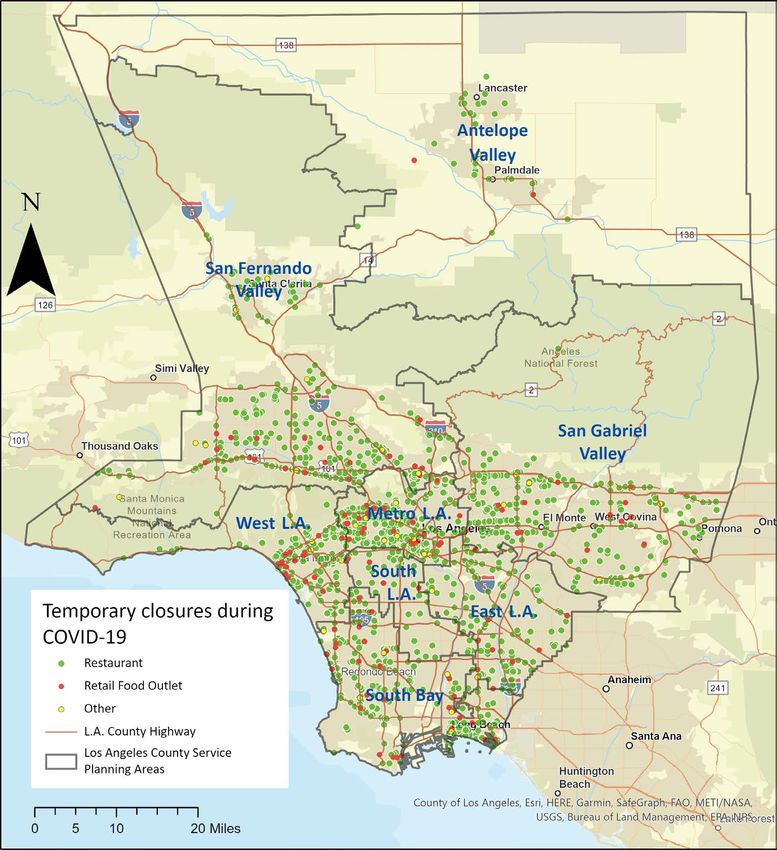
Figure 6. The location of temporary food outlet closures in L.A. County during the
COVID-19 pandemic from March 2020 to June 2021 showing that closures occurred
across the county and were concentrated in key food outlet corridors.
Click here to view the interactive map5. Food assistance providers are found throughout the L.A. County food
landscape, but there remain inequities in access, particularly in the
Antelope Valley and South L.A.
Community-based organizations providing charitable food many reasons, such as ineligibility, immigration concerns,
assistance are an essential part of the L.A. County food lack of knowledge, and perceived stigma; or they may be
system and food assistance landscape, playing a key role receiving government food assistance but it may not be
in alleviating immediate food needs. Our survey research adequately meeting their households food needs.
found that in September 2020, 8% of the L.A. County
population, and 17% of households that had experienced Findhelp.org curates comprehensive networks of service
food insecurity in the previous week, had recently used providers in every ZIP code in the U.S., including organi-
a food pantry. People use charitable or community food zations that provide food assistance. Using their dataset
assistance programs for many reasons: They may not be of service providers operating in L.A. County in 2020,
enrolled in government food assistance programs for we identified 836 food assistance organizations that had
Figure 7. The 836 food assistance providers in L.A. County are concentrated in the southern
region (Metro L.A., South and East L.A., South Bay), with fewer providers in the
Antelope Valley, San Fernando Valley, and San Gabriel Valley.
Click here to view the interactive mapthe following service tags: “Meals” (62%), “Food Pantry”
(34%), “Emergency Food” (11%), and “Food Delivery” Many L.A. low-income
(9%). Of the 836 organizations, 15% (123) had more than
one type of food service tag.
communities face a double
burden of living in food deserts
There is notable variability in access to food assis- and food assistance deserts.
tance across cities within L.A. County, given their
needs. Food pantries and meal providers were unequally
distributed across regions of the county with high num- deserts, based on our dataset from findhelp.org.
bers of low-income residents, who are at higher risk for About 23% of L.A. County census tracts are “food des-
food insecurity. Using data from the 2015–2019 American erts,” meaning they are low-income areas that don’t have
Community Survey 5-year estimates, we computed the good access to a supermarket (i.e., more than 20% of
number of food pantry/meal providers per 10,000 low- residents live more than 0.5 miles [in urban areas] or 10
income residents in each city and unincorporated area. miles [in rural areas] from a supermarket). About 1 in 4
L.A. County residents (24%) live in this type of food desert
One city, Irwindale, had more than 10 food assistance (USDA, 2020). Note: Of the census tracts in L.A. County,
providers per 10,000 low-income residents. The majority only 2% (53 of 2,343) are classified as “rural” by the USDA.
of cities had two or fewer food assistance providers per
10,000 low-income residents, and the majority of cities in Combining this information with the data from findhelp.
the lowest quartile of provider-to-low-income population org, we found that many food desert census tracts are
ratio were located in the San Gabriel Valley (8 cities) and also “food assistance deserts”: 77% of food desert cen-
East L.A. (6 cities). The 10 cities with large low-income pop- sus tracts have no food pantry/meal providers within the
ulations and the lowest provider-to-population ratios are census tract, and 24% of food desert census tracts do not
listed in Table 3. Also, 19 of the 88 incorporated cities had have a food pantry/meal provider within 0.5 miles. Many
no food pantries or meal services listed in the findhelp.org of these areas with the double burden of low access to
dataset, although the vast majority were wealthy cities. supermarkets and food assistance are located in low-
income communities of color in South and East L.A
Many L.A. County neighborhoods, particularly in (Figure 8). This likely creates many barriers to healthy
the Antelope Valley, East L.A., and South L.A., face food access and emergency food access for these resi-
a double burden of food deserts and food assistance dents, particularly those without personal transportation.
Table 3. Cities in L.A. County with the fewest food pantries and meal providers Two regions of particular con-
per low-income residents. cern are the Antelope Valley
(SPA 1) and South L.A. (SPA 6),
where about half of all census
tracts are food deserts, and
about 1 in 3 census tracts are
food deserts that did not have a
food pantry/meal provider with-
in the census tract boundary
(Figure 9). In the next section of
this report, we narrow our focus
to the food assistance landscape
in South L.A. by interviewing
food pantries in this SPA.
Note: The data used in this sec-
tion are from findhelp.org as
of December 2020. We may be
updating this section in the future
with additional information and
data partners.Figure 8. Census tracts that are (a) food deserts (low income and low access to supermarkets; GREEN),
(b) food deserts with no food assistance providers within their census tract boundaries (PURPLE), and (c) food deserts
with no food assistance providers within their census tract boundaries or within 0.5 miles of their boundaries (RED)
are primarily located in the southern region of L.A. County and clustered around the interstate highways.
Click here to view the interactive map
Figure 9. Considering these double burden food and food assistance deserts
from the perspective of service planning areas (SPAs) in L.A. County, the SPAs that
have the higher percentage of their total census tracts that face these burdens are
the Antelope Valley (SPA 1) and South L.A. (SPA 6).6. Many residents in South L.A. faced a double burden of food deserts and
food assistance deserts, and interviews with food pantries in this area
revealed the many challenges faced by providers during the pandemic.
To understand the experience of food pantries during the COVID-19 pandemic, our team interviewed representatives of
12 food pantries in South L.A., a region of the county that experienced disproportionately high rates of food insecurity
and that has a high ratio of food deserts and food assistance deserts. Interviews were conducted in Summer 2020.
These 12 pantries reported that they served a diverse set of clients in terms of age, income, and needs. All 12 provided
grocery pickup either by car or foot, but just 3 of the 12 provided ready-to-eat/pre-prepared meals by pickup. Delivery
options for both groceries and meals were limited. L.A. Regional Food Bank, which provides food for more than 900,000
individuals monthly in L.A. County, was a primary source of food for 9 of the 12 pantries.
Key challenges at the onset of the COVID-19 pandemic. Food pantries revealed challenges faced during the pandemic
that can be summarized in four major themes:
(1) Increased need: Most pantries reported a substantial increase in clients seeking food assistance in the first months
of the pandemic.
“There are a lot of families that come — the number has tripled —
Pantry #2
so staffing to accommodate it is a challenge.”
Pantry #8 “People come from all over Southern California, as far as San Diego.”
Pantry #1 “Many have lost their jobs and are laid off, which drives up the number of families we serve.”
(2) Resource shortages: Half of the interviewed organizations reported a dearth of perishable foods. Notably, shortages
also extended to a lack of operational equipment for food such as fridges and industrial freezers for pre-packaged meals.
“Not enough food — there are many people that have a desperate need for assistance.
Pantry #10
People line up around the block in their cars at 8 a.m....”
Pantry #12 “We could use more money. There is rent to pay, supplies to get, there is overhead.”
(3) Staffing challenges: Staffing and volunteer turnout were difficult for a majority of the interviewed organizations due to
COVID-19 infections, age restrictions on volunteers, and a reallocation of staff towards different causes during the pandemic.
“Some staff did not return because they didn’t know if their job will put them
Pantry #5
at risk of getting the virus.”
“Several staff members and participants have tested positive for COVID,
Pantry #10 so there has been some shifting of staff members to keep (the) program running.”(4) New COVID-19 protocols: A challenge expressed by half of the organizations pertained to implementing new pro-
tocols to protect clients and staff from COVID-19, such as securing personal protective equipment (PPE), implementing
training for social distancing, and shifting from indoor to outdoor facilities and services (e.g., drive up collection of
food). These new protocols not only required more equipment, such as freezers for pre-packaged meals, but informants
also expressed that they dismantled the social connection between food pantries and the communities they serve.
[When asked about challenges faced due to COVID-19]: “Getting protective equipment,
Pantry #1 maintaining safety among staff and public (sanitizers, etc.), delays in food deliveries,
providing emergency food deliveries.”
“[We are serving] mostly pre-packaged food due to safety protocols of the pandemic,
which is a less personal experience. Initially, [we] were able to converse with people
Pantry #6
picking up food, but now everyone is wearing masks, we can’t talk, and must quickly
come in and out. There is no community feeling anymore.”
Figure 10. Gaps in resources and key needs described by South L.A. food pantries in Summer 2020 (% and number out of 12). Staffing
challenges were the most commonly reported, followed by shortage of food, and shortage of funds, food equipment, and PPE.
FOOD CHALLENGES
• Staff sick with COVID-19
• Restrictions on volunteers 65+ years
• Staff reallocated to other causes Staffing
• Paid staff would be more efficient challenges
• No staff for food deliveries
67%
(8)
• Trying to protect staff from COVID-19
• Lack of sanitizers and masks
• Hard to socially distance with
rush of clients
COVID-19 safety Shortage of
• Lack perishable foods: milk, challenges food equipment
eggs, cheese
• Shortage of meat
25% 25%
(3) (3)
Shortage of • Need industrial freezers
Shortage of funds for pre-packaged food
food • Need transportation to
50% 25% pick up/move food
(3)
(6)
• Difficult to hire and pay staff
• Challenge to pay bills plus
increased food and operating
costsRecommendations
These findings paint a complex and challenging picture of the L.A. County food system during a crisis. They point to sev-
eral areas where policymakers, nonprofits, and private sector partners can learn from the experiences of COVID-19 and
prepare for future crises and their impact on the regional food system as well as the ability of county residents to access
food. Based on these findings, our research team makes the following recommendations, which aim to address key risk
factors, eliminate barriers to food insecurity, and improve food system equity in L.A County.
Addressing • Continue dedicating resources to eliminating food insecurity in L.A. County, targeting
Food Insecurity the ≈10% of households that remained food insecure in 2021 with initiatives that:
• Promote and expand programs that reduce poverty and increase incomes because
this is the primary factor that makes households vulnerable to food insecurity during
a crisis, and causes persistent food insecurity as the crisis subsides.
• Increase enrollment in CalFresh among low-income households. Many eligible res-
idents are not enrolled, despite the program demonstrably reducing food insecurity.
Resources could be dedicated to implementing research that identifies barriers to
enrollment and designing communications and outreach programs, and/or creating
structural program changes, based on findings to increase enrollment.
• Promote and expand programs that serve residents who have other risk factors
for food insecurity (unemployed, 18-to-30-year-olds, and households with
children), such as CalWorks and Pandemic-EBT.
Addressing Food • Conduct qualitative interviews with low-income county residents to collect communi-
Environments And ty perspectives on the ways that features of the food environment — including limited
Food Access access to supermarkets and/or limited access to food assistance programs — impact
their lived experience of accessing food, particularly during the pandemic when there
was an increase in food outlet closures.
• Provide additional support to charitable food assistance programs to meet the
increased need for food, equipment, supplies, personnel, etc., during crises. Given the
urgency of ensuring these food assistance programs work efficiently during a crisis, L.A.
County might consider options like a county-wide joint procurement arrangement for
key supplies, surge hiring bonuses, or other measures to support continuity of opera-
tions. There may also be new opportunities for private food companies to contribute to
this network of food assistance.
• Include equitable geographic access to healthy food and food assistance outlets in
urban planning strategies, such as:
• Policy and planning strategies to improve access to healthy foods in food deserts,
such as partnerships that incentivize food businesses to sell affordable healthy items
in those areas.
• Consider peoples’ access to key food corridors — areas of the county with concen-
trations of food outlets — and how transportation to these areas could be facilitated
for low-income residents without personal transportation.
• Support the expansion of food assistance programs in the Antelope Valley and South
L.A., for example through outreach, partnering with local organizations, or estab-
lishing new programs.Building A More • Establish emergency infrastructure that monitors changes and identifies vulnera-
Resilient And bilities in the food system during a crisis, so that they can be quickly addressed. Key
Equitable Food metrics include food insecurity rates, diet and nutrition, food retail landscape, changes
and shortages in the food supply chain, and food assistance programs.
System
• Build partnerships with the private sector before a crisis hits. As our experience
demonstrates, private companies like Yelp and findhelp.org have rich data on urban
food environments. This data can be much more detailed than official sources. There-
fore, private companies are critical partners in understanding what is happening to the
food environment during a crisis so programs to mitigate the impacts of food outlet
closures and food assistance deserts can be targeted with more precision. Developing
strong relationships between the public and private sectors can pave the way for rapid
response during a crisis.
• Use a multidimensional approach. There is no “silver bullet” solution to achieve
food security and equitable access to healthy food across L.A. County. Thus, plan for
transformations of the local food system that will address multiple touch points, such
as eliminating food insecurity; making healthy foods more accessible, affordable, and
convenient for all residents; and addressing vulnerabilities in the network of food assis-
tance programs.
Next Steps
Our research team will continue its work on the issue of food security and healthy food access through a new project,
“Smart and Connected Community Food Systems,” funded by the National Science Foundation (Award No. 21256160).
Through this project, we will grow our partnership with the County of Los Angeles, and their newly established Food
Equity Roundtable, as well as our valuable data partners. The project objectives are to work with these partners to co-
develop a new approach to monitor and understand food systems, food access, and food security, and to build a com-
prehensive data portal that connects stakeholders with this information and flags the issues most in need of interven-
tion. Our long-term vision is to pioneer a new paradigm of monitoring the complex and dynamic nature of community
food systems that will ultimately help communities across the country to develop resilient food systems that support
food and nutrition security for all.Supporting Information
Sample sizes and MOSE for subgroups in
Authors this analysis
Kayla de la Haye, PhD, Associate Professor of Population and Public Health Analysis of the survey data in Section 2 and Section 3 on food insecurity
Sciences, University of Southern California rates among all households had a sample size of 1,082 to 1,158 partici-
John Wilson, PhD, Professor and Founding Director, Spatial Sciences pants, with a MOSE of +/- 3 percentage points. Analysis in this section on
Institute; Professor of Sociology, Dornsife College of Letters, Arts and Sci- food insecurity rates among low-income households had a MOSE of +/- 4
ences, Preventive Medicine, Keck School of Medicine, Civil & Environmental percentage points.
Engineering, Viterbi School of Engineering, and the School of Architecture,
University of Southern California
Wändi Bruine de Bruin, MSc, PhD, Provost Professor of Public Policy, References
Psychology, and Behavioral Science, Sol Price School of Public Policy, and
Dornsife College of Letters, Arts and Sciences, University of Southern
• Cafiero, C., Viviani, S. & Nord, M. (2018). Food security measurement in a
California
global context: The food insecurity experience scale. Measurement, 116,
Kenan Li, Research Scientist, Spatial Sciences Institute, Dornsife College of 146-152.
Letters, Arts and Sciences, University of Southern California
• de la Haye, K., Miller, S., Livings, M., Bruine de Bruin, W., Wilson, J.,
Michelle Livings, PhD Student, Spatial Sciences Institute, Dornsife College of Weber, K., & Frazzini, A. (2020). The Impact of COVID-19 on Food Insecu-
Letters, Arts and Sciences, University of Southern California rity in Los Angeles County: April to July 2020. Dornsife Public Exchange,
Mengya Xu, PhD Student, Spatial Sciences Institute, Dornsife College of University of Southern California. https://publicexchange.usc.edu/
Letters, Arts and Sciences, University of Southern California food-insecurity-april-to-june/
Sydney Miller, PhD Student, Department of Population and Public Health • de la Haye, K., Miller, S., Saw, HW, Kapteyn, A., Livings, M., Bruine de
Sciences, University of Southern California Bruin, W., Wilson, J., Weber, K., Frazzini, A., & Babboni, M. (2021) A Year
Maansi Solanky, Student, Dornsife College of Letters, Arts and Sciences, of Food Insecurity in Los Angeles County During the COVID-19 Pandem-
University of Southern California ic: Racial and Ethnic Minorities Have Been Hardest Hit. Dornsife Public
Exchange, University of Southern California. https://publicexchange.usc.
Kate Weber, Director, Public Exchange, Dornsife College of Letters, Arts and edu/wp-content/uploads/2021/02/A-Year-of-Food-Insecurity-in-Los-An-
Sciences, University of Southern California geles-County.pdf
Marianna Babboni, Project Manager, Public Exchange, Dornsife College of • Dhurandhar, E J. (2016). The food-insecurity obesity paradox: A resource
Letters, Arts and Sciences, University of Southern California scarcity hypothesis. Physiology & Behavior, 162, 88-92.
Rachel Wald, Director of Strategy and Operations, Public Exchange, Dornsife • Gundersen, C., & Ziliak, J.P. (2015). Food insecurity and health out-
College of Letters, Arts and Sciences, University of Southern California comes. Health Affairs, 34(11), 1830-1839.
Alison Frazzini, Sustainability Policy Advisor, Health Equity and Food • Ingram, J. (2020). Nutrition security is more than food security. Nature
Systems, Chief Sustainability Office, County of Los Angeles Food, 1(1), 2-2.
• Los Angeles County Department of Public Health (LAC DPH). (2018).
2018 Los Angeles County Health Survey – Topics & Data. Office of Health
Assessment and Epidemiology. http://publichealth.lacounty.gov/ha/
Survey Methodology LACHSDataTopics2018.htm
• Miller, S., Bruine de Bruin, W. Livings, M., Wilson, J., Weber, K., Frazzini,
Sections of this report are based on data from the Understanding Corona-
A., Babboni, M, & de la Haye, K. (2021). Self-reported dietary changes
virus in America tracking survey, administered by the USC Dornsife Center
among Los Angeles County adults during the COVID-19 pandemic. Appe-
for Economic and Social Research (CESR). Respondents are members of
tite, 166, 105586.
CESR’s Understanding America Study (UAS) probability-based Internet
panel who participated in tracking survey waves conducted between April • Saksena, MJ et al. (2018). America’s Eating Habits: Food Away From
1, 2020, and July 7, 2021. All respondents are 18 or older, and sampling is Home, EIB-196, Michelle Saksena, Abigail M. Okrent, and Karen S. Ham-
representative of all households in L.A. County. The survey is conducted in rick, eds. U.S. Department of Agriculture, Economic Research Service,
English and Spanish. All results are weighted to CPS benchmarks, account- September 2018.
ing for sample design and non-response. The sample size for survey waves • U.S.D.A. (2020). Food Environment Atlas. https://www.ers.usda.gov/
used in this report ranges from 1,082 to 1,158. Participants were recruited data-products/food-environment-atlas/ .
for the UAS Internet panel using an ABS household sample; methodologi- • Walker R.E., Keane C.R., Burke J.G. (2010). Disparities and access to
cal details for the UAS panel are available at https://uasdata.usc.edu. The healthy food in the United States: A review of food deserts literature.
Understanding Coronavirus in America Tracking Survey has been funded Health & Place, 16(5):876-884.
in part by the Bill & Melinda Gates Foundation, the University of Southern
California, and many others who have contributed questions to individual • Wolfson JA, Leung CW. Food Insecurity and COVID-19: Disparities in
waves or sets of waves. early effects for US adults. Nutrients. 2020;12(6):1648.Appendix
Appendix Table 1. A timeline of COVID-19 related dining and food outlet closures and restrictions in L.A. County.
Indoor dining suspended; farmers markets prepared foods
March 16, 2020
suspended; grocery stores reduced to 50% capacity
May 29, 2020 Indoor dining resumed
July 1, 2020 Indoor dining suspended
November 12, 2020 Farmers market prepared foods resumed
Outdoor dining capacity limited to 50%, and outdoor dining
November 19, 2020
must be closed between 10 p.m. and 5 a.m.
November 25, 2020 Outdoor dining suspended
Grocery store and certified farmers market capacity limited to
December 6, 2020
20%
Grocery store and certified farmers market capacity increased
December 9, 2020
to 35%
Outdoor dining resumes; removed outdoor dining closure
January 29, 2021
requirements between 10 p.m. and 5 a.m.
Indoor dining resumes at 25% maximum capacity or 100
March 12, 2021 persons, whichever is fewer; grocery store capacity increased
to 50%
Indoor dining capacity increased to 50% of maximum capaci-
April 5, 2021
ty or 200 persons, whichever is fewer
June 15, 2021 Normal operations resumeYou can also read