Estimated date of dominance of VOC-202012/01 strain in France and projected scenarios - EPIcx lab
←
→
Page content transcription
If your browser does not render page correctly, please read the page content below
Estimated date of dominance of VOC-202012/01
strain in France and projected scenarios
Report #26 [previous reports at: www.epicx-lab.com/covid-19.html]

Chiara E. Sabbatini1, Laura Di Domenico1, Giulia Pullano1,2, Vittoria Colizza1,*

1 INSERM, Sorbonne Université, Pierre Louis Institute of Epidemiology and Public Health, Paris, France
2 Orange Labs, Sociology and Economics of Networks and Services (SENSE), Chatillon, France

*vittoria.colizza@inserm.fr

16/01/2021 (DATA UP TO 10/01/2021)

RESUME
Un nouveau variant du SARS-CoV-2 (VOC-202012/01, ici appelée VOC) est apparue fin 2020 au
Royaume-Uni. Des estimations préliminaires indiquent que 1,4% des cas de COVID-19 nouvellement
diagnostiqués en w01 dans le pays sont dus au VOC. En utilisant le modèle développé par l'INSERM pour
répondre à la pandémie de COVID-19, nous fournissons des projections des trajectoires épidémiques dans
les semaines à venir en raison de l'augmentation de la circulation du variant britannique dans le pays.
Nous estimons que le variant deviendrait dominant en France entre fin février et mi-mars, en fonction de
l'évolution épidémique et de l'augmentation estimée de la transmissibilité du VOC. Les nouvelles
hospitalisations hebdomadaires devraient atteindre le niveau du pic de la première vague (environ
25,000 hospitalisations) entre mi-février et début avril, en l’absence d’interventions. Ces résultats
montrent la nécessité de renforcer les mesures de distanciation sociale et d’accélérer la campagne de
vaccination pour faire face à la menace du variant VOC.
SUMMARY
A new variant of SARS-CoV-2 (VOC-202012/01, here called VOC) emerged in late 2020 in the United
Kingdom. Preliminary estimates indicate that 1.4% of newly diagnosed COVID-19 cases in w01 in the
country are due to VOC. Using the model developed by INSERM to respond to the COVID-19 pandemic,
we provide projections of the epidemic trajectories in the upcoming weeks due to increased VOC
circulation in the country. We estimate that the variant would become dominant in France between late
February and mid-March, depending on the epidemic evolution and estimated increase of VOC
transmissibility. New weekly hospitalizations are expected to reach the level of the first wave’s peak
(approximately 25,000 hospitalizations) between mid-February and early April, in absence of
interventions. These results support the need for strengthened social distancing measures and for
accelerating the vaccination campaign to face the threat of the VOC variant.

1                                                                                                        epicx-lab.com
INTRODUCTION
A new variant of SARS-CoV-2 (VOC-202012/01, here called VOC) emerged in late 2020 in the United
Kingdom1 and has been recently detected in France. Analyses of the results of RT-PCR tests performed on
January 8 suggest that 1.4% of new diagnosed COVID-19 cases in the country are due to the VOC
variant2. In this short report, we provide estimates of the date on which this new strain will overcome the
non-VOC strain and become the dominant strain circulating in France.

METHODS
Transmission model. We used the model developed by INSERM to respond to the COVID-19 pandemic3–5.
The model was shown to capture the transmission dynamics of the epidemic3,4, was used to assess the
impact of lockdown, exit strategies and reopening of schools4,5, and to evaluate the performance of the
test-trace-isolate strategy.3 The model was validated region by region against the estimates of three
independent serological studies conducted in France3. It is based on a stochastic age-stratified
transmission model, integrating demographic, age profile, and social contact data of mainland France, to
account for age-specific contact activity and role in COVID-19 transmission. Disease progression is
specific to COVID-19 and parameterized with current knowledge to include presymptomatic
transmission, asymptomatic and symptomatic infections with different degrees of severity
(paucisymptomatic, with mild symptoms, with severe symptoms requiring hospitalization). Four age
classes are considered: [0-11), [11-19), [19-65), and 65+ years old (children, adolescents, adults,
seniors). A reduced susceptibility was considered for children and adolescents, along with a reduced
relative transmissibility of children, following available evidence. Details of the model can be found in
Ref3.
SARS-CoV-2 non-VOC strain model calibration. The model is fitted to daily hospital admission data
through a maximum likelihood approach, starting from the beginning of the epidemic in early 2020. The
model is fit to the first and second wave, up to January 10, 2021.
Model projections. We explore different scenarios of epidemic activity starting January 11. We consider a
baseline scenario with an effective reproductive number for the currently dominant virus of Reff(non-VOC)
= 1.1 on the basis of the estimates on hospitalization data of last week2. In addition, we consider a more
optimistic scenario with a stable epidemic activity in time (Reff(non-VOC) around 1, considered as best-
case scenario here), and one with a larger increase in epidemic activity (Reff(non-VOC) = 1.2, considered
as worst-case scenario here).
VOC strain model calibration. We use the same model to simulate the spread of the SARS-CoV-2 VOC
strain in mainland France, assuming a 50% or 70% increase in transmissibility with respect to the non-
VOC strain, based on currently available estimates6. This corresponds to an effective reproductive
number Reff(VOC) = 1.5 and Reff(VOC) = 1.7, respectively, assuming a constant epidemic activity for the
non-VOC strain (Reff(non-VOC) = 1.0). The estimated Reff(VOC) would be larger for the scenarios with
Reff(non-VOC) = 1.1 and 1.2 (Reff(VOC) ranging from 1.65 to 1.9, and from 1.8 to 2, respectively). The

2                                                                                            epicx-lab.com
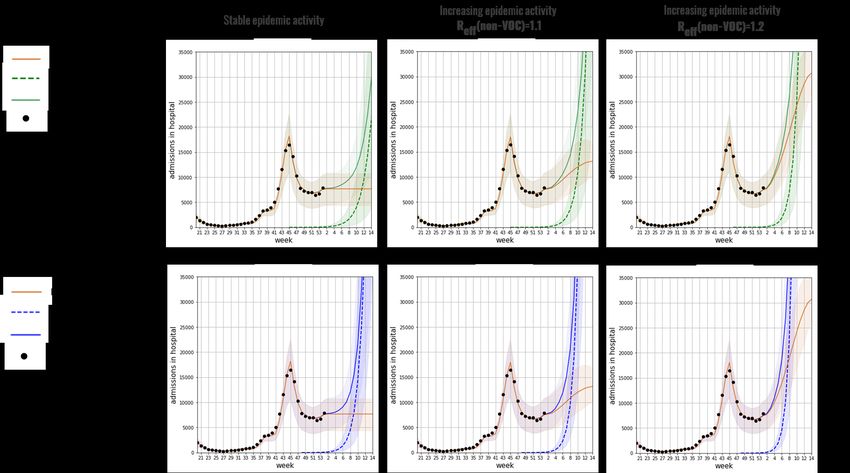
model accounts for the immunity reached in the country at the end of the second wave, and assumes the
same generation time as for the SARS-CoV-2 variant originally circulating in the country. The starting
date is calibrated so that the prevalence of the VOC strain represents 1.4% of new cases on January 8,
2021, according to preliminary estimates of the ‘Enquête flash’2.
Estimation of time of VOC dominance. For each epidemic scenario, we extract the crossing week between
model projections of new non-VOC cases and the number of predicted new cases due to VOC strain, for
both values of increase of transmissibility (+50% or +70%). This corresponds to the time at which new
VOC cases account for 50% of all weekly cases. We include a 95% probability range of the week
accounting for the stochasticity of the VOC strain model.

RESULTS

Figure 1. Predicted weekly number of hospitalizations due to non-VOC and VOC strain of SARS-CoV-2. The orange curve indicates
hospitalizations due to non-VOC strain. Black dots correspond to weekly hospitalization data (up to week 1, 2021). Projections are obtained
assuming Reff(non-VOC) = 1.0 (left), Reff(non-VOC) = 1.1 (center), Reff(non-VOC) = 1.2 (right). Top panels: The dashed green curve
represents weekly hospitalization due to VOC strain, assuming a 50% increasing in transmissibility with respect to the wild strain,
corresponding to Reff(VOC) = 1.5, 1.65, 1.8 respectively (from left to right). The solid green curve indicates the total (non-VOC and VOC)
number of hospitalized cases. Bottom panels: As in the top panels, assuming a 70% increase in transmissibility for VOC strain with respect
to the non-VOC strain, corresponding to Reff(VOC) = 1.7, 1.9, 2 respectively (from left to right). In all panels: curves represent median values;
shaded areas indicate 95% probability ranges obtained from 500 stochastic runs.

3                                                                                                                             epicx-lab.com
Figure 2. Estimated week of VOC dominance. Estimated time at which the weekly number of new VOC cases accounts for 50% of all weekly
new cases. Dots indicate median values. Error bars represent 95% probability ranges obtained from 500 stochastic runs.

Table 1. Estimated week in which the number of hospitalizations exceeds the peak reached during the first and the second lockdown. We use
as threshold values 25,000 weekly hospitalizations for the peak of the first wave, and 20,000 weekly hospitalizations for the peak of the
second lockdown.
                                20,000 weekly hospitalizations                 25,000 weekly hospitalizations

                           Reff(VOC(+70%))          Reff(VOC(+50%))        Reff(VOC(+70%))       Reff(VOC(+50%))

Reff(non-VOC) = 1.0         Week 10 [9, 13]         Week 13 [11, 15]       Week 11 [9, 13]       Week 14 [12, 15]

 Reff(non-VOC) = 1.1        Week 8 [7, 10]          Week 10 [8, 13]         Week 9 [8, 11]        Week 11 [9, 13]

Reff(non-VOC) = 1.2          Week 7 [6, 8]           Week 8 [6, 9]           Week 7 [6, 8]        Week 8 [7, 10]

KEY FINDINGS
    •     Given a 70% increase in transmissibility, we expect that the VOC strain will become dominant by
          the end of February / beginning of March, even assuming a constant non-VOC epidemic activity. A
          50% increase in transmissibility would delay the date of dominance by approximately two weeks
          (Figures 1 and 2). An important rise of cases, however, is expected already in the weeks
          preceding the dominance of VOC, with weekly hospitalizations approaching the values reached in
          the second wave.
    •     In the best-case scenario (stable epidemic activity due to the non-VOC virus) and assuming a
          50% increase in VOC transmissibility, we would reach the second wave’s peak of hospitalizations

4                                                                                                                      epicx-lab.com
by the end of March (week 13), if no interventions are put in place (Table 1). The level of
hospitalizations of the first wave’s peak would be reached approximately one week later. If the
increase in VOC transmissibility is higher, these same levels would be reached three weeks
before.
• In the worst-case scenario, with Reff(non-VOC) = 1.2 and a 70% increase in transmissibility, we
expect that the number of weekly hospitalizations will exceed 20,000 by mid-February (week 7),
if no interventions are put in place.
• These results support the need for strengthened social distancing measures to face the threat of
the VOC variant. Accelerating the vaccination campaign will help mitigate the curve in the
upcoming months and reduce the hospitalizations.
LIMITATIONS
• The model does not take into account the vaccination of individuals. At this stage, the number of
vaccinated individuals is still very limited to effectively slow down the epidemic. Also, we consider
that the only difference between the VOC strain and the currently circulating strain is in the
increase of transmissibility as estimated by Davies et al.6.
• The model is calibrated to hospitalization data up to January 10 and proposes as baseline scenario
the epidemic trajectory projected according to this calibration (Reff(non-VOC)=1.1 in the last
week of data). It does not account for the curfew anticipated to 6pm and extended to the national
territory on January 16, 2021. The evaluation of this social distancing measure will be performed
on epidemic data in the next few weeks. For this reason, we provided a more optimistic scenario
assuming a stable epidemic activity. This could be the result of effective measures able to
contrast the increase of cases observed in the last days in France.
• This report does not take into account other variants, such as the variant 501.V2, also called
South African variant.
ACKNOWLEDGMENTS
We thank Santé publique France for useful discussions on the design of these scenarios. This study is
partially funded by: ANR projects DATAREDUX (ANR-19-CE46-0008-03), EVALCOVID-19 (ANR-20-
COVI-0007); EU H2020 grants MOOD (H2020-874850) and RECOVER (H2020-101003589);
REACTing COVID-19 modeling grant.
5 epicx-lab.comREFERENCES 1. GOV.UK. Investigation of novel SARS-CoV-2 variant: Variant of Concern 202012/01. https://www.gov.uk/government/publications/investigation-of-novel-sars-cov-2-variant-variant-of- concern-20201201. 2. Santé publique France. COVID-19 : point épidémiologique du 14 janvier 2021. https://www.santepubliquefrance.fr/maladies-et-traumatismes/maladies-et-infections- respiratoires/infection-a-coronavirus/documents/bulletin-national/covid-19-point-epidemiologique- du-14-janvier-2021. 3. Pullano, G. et al. Underdetection of COVID-19 cases in France threatens epidemic control. Nature (2020) doi:10.1038/s41586-020-03095-6. 4. Di Domenico, L., Pullano, G., Sabbatini, C. E., Boëlle, P.-Y. & Colizza, V. Impact of lockdown on COVID- 19 epidemic in Île-de-France and possible exit strategies. BMC Med. 18, 240 (2020). 5. Di Domenico, L., Pullano, G., Sabbatini, C. E., Boëlle, P.-Y. & Colizza, V. Modelling safe protocols for reopening schools during the COVID-19 pandemic in France. Nature Communications (2021) in press, preprint available at doi:10.1101/2020.05.08.20095521. 6. Davies, N. G. et al. Estimated transmissibility and severity of novel SARS-CoV-2 Variant of Concern 202012/01 in England. http://medrxiv.org/lookup/doi/10.1101/2020.12.24.20248822 (2020) doi:10.1101/2020.12.24.20248822. 6 epicx-lab.com
You can also read