Energy efficiency networks - do they work? Evidence from German firm-level data - Jan Stede FSR Climate Annual Conference, 26.11.18 - DIW Berlin
←
→
Page content transcription
If your browser does not render page correctly, please read the page content below

Energy efficiency networks – do
they work? Evidence from German
firm-level data

Jan Stede
FSR Climate Annual Conference, 26.11.18
1 Research question

• Regular, moderated meetings of
 10-15 companies
• For firms with energy costs
 >€500,000/a
• Introductory phase: 30 regional
 networks (360 companies) from
 2009-2014 (voluntary); currently >1,200 companies

• Previous evaluations: Participants improve energy efficiency
 at double the industry average (e.g. Rohde et al. 2015)

→ How does participating in an energy efficiency network
impact a company’s energy efficiency and CO2 emissions?
 2

1 Research question

 → Statistically significant difference of 5.5 percentage points
 in the network period – but is this causal?
3 Source: FDZ der Statistischen Ämter des Bundes und der Länder, AFiD-Panel Industriebetriebe
 and AFiD-Modul Energieverwendung, 2003-2014, own calculations.
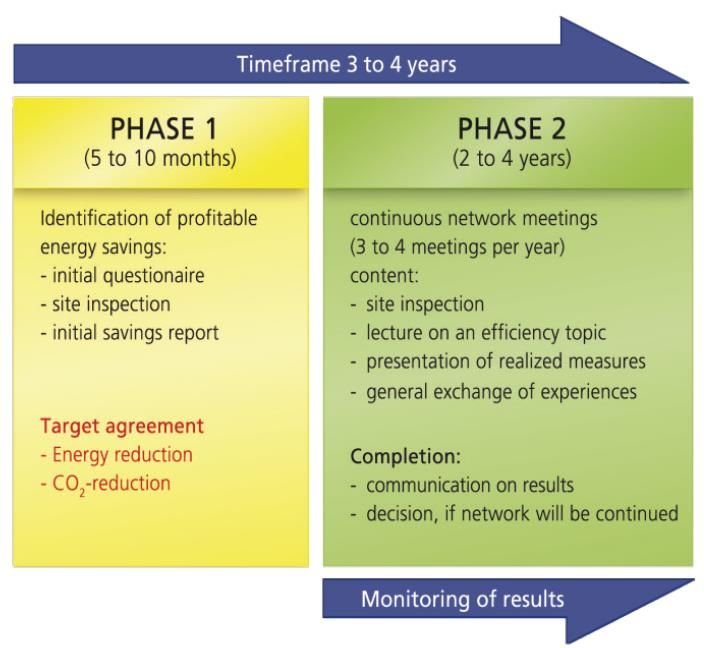
1 How do energy efficiency networks work? (I)

 Source: Adapted from Köwener et al. (2014)

4
1 How do energy efficiency networks work? (II)

 1. Reducing transaction costs by sharing experiences
 (Jochem et al. 2010, Köwener et al. 2011)
 • Importance of trust

 2. Reducing information deficits (Dütschke et al. 2018, Jochem
 and Gruber 2007, Paramonova et al. 2014)
 • Avoid risks and hidden costs

 3. Overcoming the little priority given to energy efficiency
 investments (Köwener et al. 2014, Dütschke et al. 2018)
 • Agenda-setting, motivation, positive peer pressure

 • Focus typically on cross-cutting technologies
5
2 Empirical strategy

 • Problem: Self-selection

 → Difference-in-differences (DiD) estimation
 • Control group: Companies joining networks that started after
 the treatment period (→ exploit difference in timing of the
 treatment)
 • Main assumption: common trends

 Treatment group Control group

 Start of first ‘500 networks’
 networks initiative

 2008 2009 2010 2011 2012 2013 2014 2015 2016

6
2 DiD models

 Treatment Industry fixed
 (1) Baseline model dummy effects

 = 0 + 1 + ∙ + + + + ,
 E.g. log energy productivity Year Industry-year
 fixed effects interaction

(2) Baseline model with controls

 Controls
 (3) Plant-level fixed effects model

 = ∙ + + + + + ,
 Plant-level fixed effect

7
2 Dependent variables

 • Energy productivity: levels, log, log change relative to 2008
 • CO2 emissions: levels, log, log change relative to 2008

8
2 Data and sample

 • AFiD panel of manufacturing production sites, 2003-2014
 → All German manufacturing firms with >20 employees
 • Treatment group: 30 networks, 292 manufacturing firms
 • Control group: 122 networks, 921 manufacturing firms
 → Matched 90% of treatment group, 50% of control group
 → N=709 (259 treated and 450 control firms)

 Different start years of the networks
 Start year of the network 2009 2010 2011 2012 ∑

 No. of networks 4 18 6 2 30

 No. of companies in networks 35 187 56 14 292

9
3 Share of sectors [in %]
 Economic sector (WZ 2008 classification) Pilot networks Control group Manufacturing
 sector
 5 Mining of coal and lignite 0.4 0.3 0.1
 8 Other mining and quarrying 1.3 1.2 2.2
 10 Manufacture of food products 11.4 10.8 12.0
 11 Manufacture of beverages 4.4 2.0 1.3
 12 Manufacture of tobacco products 0.4 0.3 0.1
 13 Manufacture of textiles 1.8 0.9 1.7
 16 Manufacture of wood […] 1.6 1.7 2.7
 17 Manufacture of paper and paper products 4.0 3.9 2.2
 18 Printing and reproduction of recorded media 2.6 2.0 3.3
 19 Manufacture of coke […] 0.3 1.5 0.1
 20 Manufacture of chemicals 9.3 7.4 3.5
 21 … basic pharmaceutical products […] 2.4 1.7 0.7
 22 … rubber and plastic products 10.0 8.6 7.2
 23 … other non-metallic mineral products 4.2 8.5 7.1
 24 … basic metals 2.6 7.5 2.4
 25 … fabricated metal products […] 11.0 11.5 16.6
 26 … computer, electronic and optical products 2.7 4.0 3.9
 27 … electrical equipment 4.8 6.9 4.9
 28 … machinery and equipment n.e.c. 10.9 14.9 13.7
 29 … motor vehicles, trailers and semi-trailers 5.6 2.3 3.0
 30 … other transport equipment 2.1 0.3 0.7
 31 … furniture 4.0 0.5 2.3
 32 Other manufacturing 1.7 1.2 3.5
10
 33 Repair and installation of machinery 0.6 0.3 4.0
3 Distribution of key variables

 Variable Median Lower Upper Mean (s.d.)
 quartile quartile
 Annual turnover [million €]
 - Pilot networks 67.2 23.5 140.3 179.7 (476.8)
 - Control group 45.2 15.9 120.5 137.5 (605.1)
 - Manufacturing sector 6.4 2.8 18.8 34.4 (359.6)
 Number of employees
 - Pilot networks 3,614 1,576 6,807 7,270 (13,154)
 - Control group 2,616 1,166 5,418 5,010 (10,829)
 - Manufacturing sector 608 360 1,323 1,557 (6,145)

 → Much larger installations in networks than the average manufacturing
 firm, both in terms of turnover and # of employees

11 Source: FDZ der Statistischen Ämter des Bundes und der Länder, AFiD-Panel Industriebetriebe
 and AFiD-Modul Energieverwendung, 2003-2014, own calculations.
3 Distribution of key variables

Variable Median Lower Upper Mean (s.d.)
 quartile quartile
Annual energy consumption
[MWh]
- Pilot networks 18,716 5,979 50,886 66,237 (158,143)
- Control group 13,461 3,868 47,231 75,953 (217,588)
- Manufacturing sector 997 373 3,855 13,367 (92,276)
Energy productivity
[€/kWh]
- Pilot networks 3.14 1.32 6.62 5.27 (6.58)
- Control group 3.08 1.18 8.11 5.86 (7.85)
- Manufacturing sector 5.54 2.66 11.52 10.77 (62.98)

 → Energy consumption : Much higher for treatment and control than
 for average industrial firm
 →Energy productivity: Treatment and control well aligned
 12 Source: FDZ der Statistischen Ämter des Bundes und der Länder, AFiD-Panel Industriebetriebe
 and AFiD-Modul Energieverwendung, 2003-2014, own calculations.
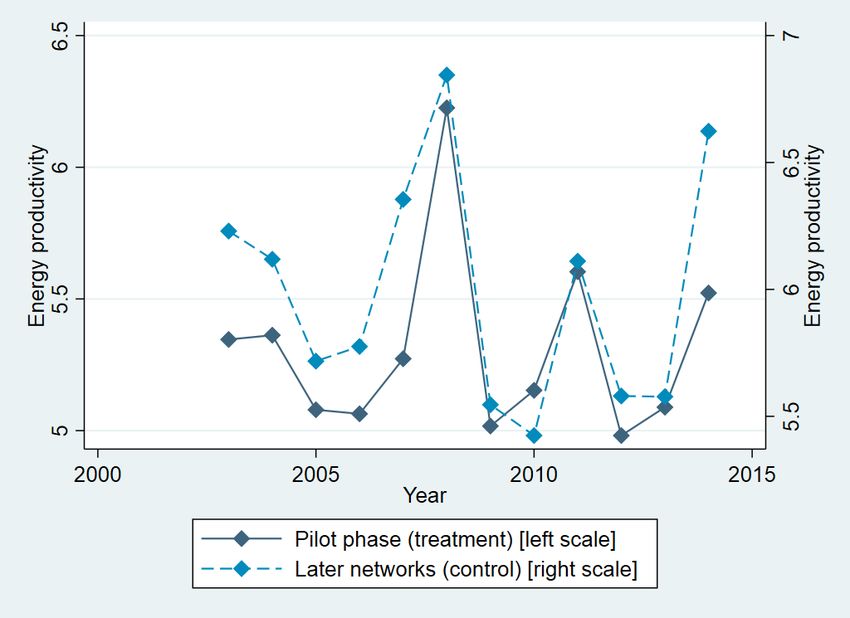
3 Energy productivity for treated and control companies

13
4 Estimation results for energy efficiency

† Additional control variables include sales intensity (turnover divided by the number of employees), the export share, the share
of own electricity production of total consumption, a dummy for investment into environmental protection, as well as a dummy
for the basic materials sector.

 14
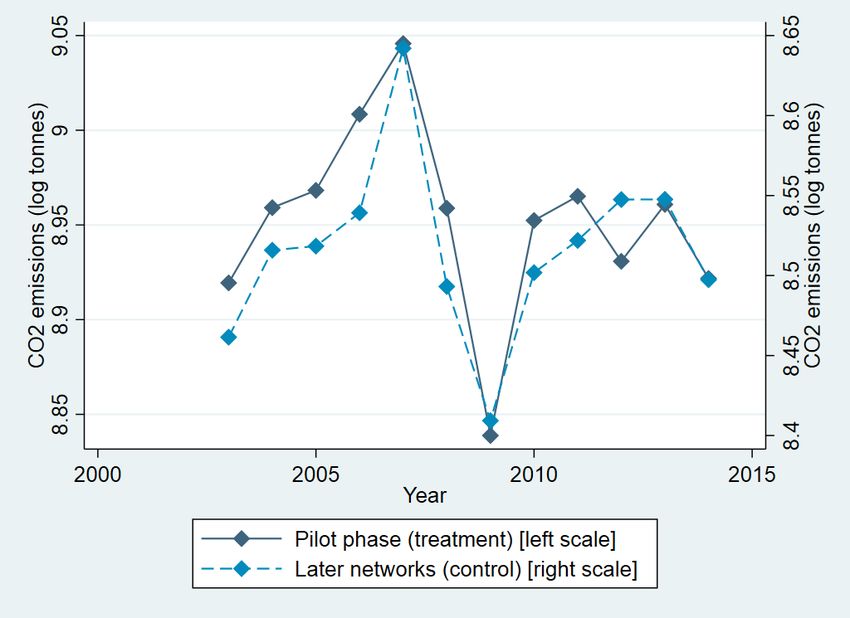
4 Log CO2 emissions for treated and control companies

15
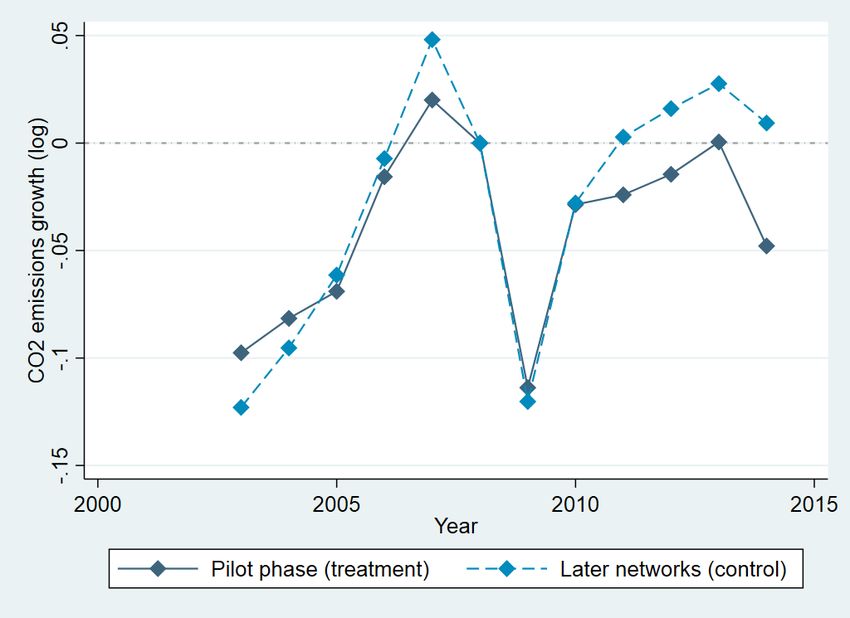
4 Change of CO2 emissions

16
4 Estimation results for CO2 emissions

† Additional control variables include sales intensity (turnover divided by the number of employees), the export share, the share
of own electricity production of total consumption, a dummy for investment into environmental protection, as well as a dummy
for the basic materials sector.

 17
5 Treatment effect heterogeneity

18
5 Network management

 1) Good management of the networks
 • E.g. high quality of the initial energy audits
 → Stakeholder interviews to identify ‘well-managed’
 networks: Identified network “EE-net Saar”

19
5 Management within companies

 2) Good management within companies
 • Theoretical and empirical literature establishing link
 between exporting and good management (Bloom & Van
 Reenen 2010, JEP; Helpman et al. 2004, AER; Sousa et al. 2008)
 • Exporting German manufacturers more energy efficient
 (Lutz et al. 2017)
 → High export share (>80%) as an indicator for ‘good’
 management leading to higher benefits from network
 participation

20
5 Homogeneity of network participants

 3) Homogeneity of network participants
 • Allows networks to go for more complex energy efficiency
 improvements (beyond cross-cutting technologies)
 • Indication of importance: Rise of sectoral networks and
 within-company-networks in recent years
 → Herfindahl-Hirschman-Index of sectoral distribution

21
3 EE-net Saar: Distribution of key variables

Variable Median Lower Upper Mean (s.d.)
 quartile quartile
Annual turnover [million €]
- EE-net Saar 167.5 111.4 479.4 320.8 (334.7)
- Pilot networks 67.2 23.5 140.3 179.7 (476.8)
Number of employees
- EE-net Saar 10,860 4,048 17,172 13,952 (14,747)
- Pilot networks 3,614 1,576 6,807 7,270 (13,154)
Annual energy consumption
[MWh]
- EE-net Saar 50,706 9,623 139,714 96,461 (116,826)
- Pilot networks 18,716 5,979 50,886 66,237 (158,143)

 → EE-net Saar firms much larger than the average network participant

 22 Source: FDZ der Statistischen Ämter des Bundes und der Länder, AFiD-Panel Industriebetriebe
 and AFiD-Modul Energieverwendung, 2003-2014, own calculations.
5.1 Good management of the networks – energy efficiency in the network “EE-net Saar”

 23
5.1 Good management of the networks – CO2 emissions in the network “EE-net Saar”

 24
5.2 High exporters

 Variable Median Lower Upper Mean (s.d.)
 quartile quartile
 Export share [%]
 - Pilot networks 36.6 9.4 63.1 39.2 (30.5)
 - Control group 31.4 7.8 59.0 35.8 (29.3)
 - Manufacturing sector 7.3 0.0 35.1 20.2 (25.8)

 → 12% of treatment group export >80%

 25
5.2 Good management within companies – energy efficiency for high exporters

 26
5.2 Good management within companies – CO2 emissions for high exporters

 27
3 Herfindahl-Hirschman-Index: Overview
 Name of network HHI

 EE-net Saar 0.38
 EEN Neuwied/Koblenz 0.12
 EENet MRN (Metropolregion Rhein-Neckar) 0.17
 Effizienztisch Berlin 0.17
 Effizienztisch NordWest II 0.42
 EnBW Netzwerk Alb-Schwarzwald-Bodensee 0.68
 EnBW Netzwerk Berlin-Brandenburg 0.17
 EnBW Netzwerk Lippe-Münsterland 0.24
 Energie-Tisch Effizienz Nürnberg II 0.18 → Average HHI of 0.25
 EnergieEffizienz-Netzwerk Karlsruhe 0.16
 EnergieEffizienz-Netzwerk Mittelbayern 0.15 → 5 networks with
 EnergieEffizienz-Netzwerk München-Oberbayern 0.12
 EnergieEffizienz-Netzwerk Südbayern 0.18
 HHI>0.3
 EnergieEffizienz-Netzwerk Südhessen 0.28
 EnergieEffizienz-Netzwerk Thüringen 0.16
 EnergieEffizienz-Netzwerk Trier 0.14
 Unternehmens-Netzwerk Allgäu 0.19
 EnergieEffizienz-Tisch Heilbronn-Franken 0.15
 EnergieEffizienz-Tisch Worms 0.37
 EnergieEffizienzinitiative Unterfranken 0.15
 Netzwerk Chiemgau-Rupertiwinkel 0.21
 …

28
5.3 High Herfindahl-Hirschman Index – energy efficiency

 29
5.3 High Herfindahl-Hirschman Index – CO2 emissions

 30
6 Overview of significant treatment effects †

 Log
 Log change change of
 of energy Energy Log energy CO2 CO2 Log co2
 productivity productivity productivity emissions emissions emissions
 Model (1)
Basic Model Model (2) + (**) + (**) − (**)
 Model (3)
Network Model (1) + (***) − (***)
management Model (2) + (***) − (***) − (***)
(EE-net Saar) Model (3) − (***) − (***)
Company Model (1) − (**)
management Model (2) − (*)
(exporters) Model (3) + (*) − (**) − (**)
Homogeneity Model (1)
of network Model (2) + (*) + (*)
(HHI) Model (3)

 31 † The table shows the direction and significance level of the average treatment effect on the treated
6 Conclusion

 • Members of efficiency networks improve efficiency at
 more than five percentage points above industry levels
 during the networking period
 • Statistically (and economically) significant treatment
 effect with the expected sign in the baseline model with
 covariates
 • But result not very robust (no significance in the model
 with plant-level fixed effects)
 → Estimated CO2 savings for the German 2020 climate targets
 questionable (if results hold for other networks)

32
6 Conclusion – heterogeneous treatment effects

 1) Good management of the networks: “EE-net Saar”
 • Increase of (log) energy productivity, decrease of CO2
 emissions due to treatment (in some specifications)
 → Find further “well-managed” networks to see if results are
 robust (stakeholder interviews)

 2) Good management within companies: High exporters
 • Some indication for a reduction of CO2 emissions
 • Only weak evidence for an increased energy productivity

33
6 Conclusion – heterogeneous treatment effects

 3) Homogeneity of network participants: HHI
 • Only weak evidence for an effect on energy productivity
 • No effect on CO2 emissions
 • However, Herfindahl-Hirschman-Index only a rough proxy
 for homogeneity of network participants
 → Future research: Maybe sectoral networks or within-
 company networks work better?

34
Thank you for your attention.

DIW Berlin — Deutsches Institut
für Wirtschaftsforschung e.V.
Mohrenstraße 58, 10117 Berlin
www.diw.de
References (I)

 Bloom, N., Van Reenen, J., 2010. Why Do Management Practices Differ across Firms and
 Countries? J. Econ. Perspect. 24, 203–224.
 Dütschke, E., Hirzel, S., Idrissova, F., Mai, M., Mielicke, U., Nabitz, L., 2018. Energy efficiency
 networks—what are the processes that make them work? Energy Effic. 1–16.
 Helpman, E., Melitz, M.J., Yeaple, S.R., 2004. Export versus FDI with heterogeneous firms.
 Am. Econ. Rev. 94, 300–316.
 Jochem, E., Gruber, E., 2007. Local Learning-networks on energy efficiency in industry –
 Successful initiative in Germany. Appl. Energy 84, 806–816.
 Jochem, E., Mai, M., Ott, V., 2010. Energieeffizienznetzwerke – beschleunigte
 Emissionsminderungen in der mittelständischen Wirtschaft. Z. Für Energiewirtschaft 34, 21–
 28.
 Köwener, D., Mielicke, U., Jochem, E., 2011. Energy efficiency networks for companies –
 concept, achievements and prospects, in: Eceee 2011 Summer Study Proceedings - Energy
 Efficiency First: The Foundation of a Low-Carbon Society. Belambra Presqu’île de Giens,
 France, pp. 725–733.

36
References (II)

 Köwener, D., Nabitz, L., Mielicke, U., Idrissova, F., 2014. Learning energy efficiency networks
 for companies – saving potentials, realization and dissemination, in: Eceee Industrial Summer
 Study Proceedings - Retool for a Competitive and Sustainable Industry. Papendal, Arnhem,
 the Netherlands, pp. 91–100.
 Lutz, B., Massier, P., Sommerfeld, K., Löschel, A., 2017. Drivers of energy efficiency in German
 manufacturing: A firm-level stochastic frontier analysis (ZEW Discussion Paper No. 17–068).
 Zentrum für Europäische Wirtschaftsforschung.
 Paramonova, S., Ivner, J., Thollander, P., 2014. Outsourcing Industrial Energy Management:
 Industrial Energy Efficiency Networks Provided As an Energy Service, in: Deering, A. (Ed.),
 Outsourcing: Strategies, Challenges and Effects on Organizations. Nova Science Publishers,
 Inc., New York.
 Rohde, C., Mielicke, U., Nabitz, L., Köwener, D., 2015. Learning Energy Efficiency Networks -
 Evidence based experiences from Germany, in: ACEEE Summer Study on Energy Efficiency in
 Industry. Buffalo, NY.
 Sousa, C.M., Martínez-López, F.J., Coelho, F., 2008. The determinants of export performance:
 A review of the research in the literature between 1998 and 2005. Int. J. Manag. Rev. 10,
 343–374.
37
You can also read