EVALUATING FEDERAL STUDENT LOAN REPAYMENT OUTCOMES AT SIX RESEARCH UNIVERSITIES
←
→
Page content transcription
If your browser does not render page correctly, please read the page content below
JULY 2022
      STUDENT SUCCESS THROUGH APPLIED RESEARCH LAB
      UNIVERSITY OF WISCONSIN-MADISON

       EVALUATING FEDERAL STUDENT
      LOAN REPAYMENT OUTCOMES AT
           SIX RESEARCH UNIVERSITIES

         NICHOLAS HILLMAN, EUNJI YOU, KIM DANCY, JARED COLSTON,
                            CHRISTOPHER BARNES, & SAMI BOYNTON

Author note: This analysis was conducted with support from Arnold Ventures. Views
expressed here do not necessarily represent theirs, and any errors or omissions are ours
alone. In addition to the partner universities included in this report, we would like to thank
Drs. Kathryn Boonstra and Amberly Dziesinski for useful feedback on earlier versions of this
report. Please direct correspondence to Dr. Hillman at nwhillman@wisc.edu
Evaluating Federal Student Loan Repayment Outcomes

                                     Executive Summary

Using National Student Loan Data System (NSLDS) data from six public and private research
universities, this report analyzes loan repayment rates and outcomes of 64,052 federal
student loan borrowers across three repayment cohorts. In addition to default, we measure
repayment rates and paid-in-full (PIF) rates that provide important complementary insights
into the lifecycle of student loan repayment.

   •   Borrowers at these six universities took out $1.7 billion in federal loans with the
       average being $27,715 and the median $19,000.

   •   Most of these borrowers were either in deferment/forbearance (69%) or had paid their
       loans in full (28%) within five years of entering payment.

   •   Most undergraduate borrowers (64%) repay via standard 10-year plans while smaller
       shares of graduate/professional borrowers (34%) use standard repayment plans.

   •   Graduate/professional students and Black students tend to have the highest
       participation rates in income-driven repayment (IDR) plans at these six universities.
       While these plans offer certain protections from repayment risks, they also increase
       balances over time and reduce repayment rates.

   •   Repayment rates tend to be highest among borrowers who took out the smallest
       loans and enrolled in academic programs that tend to have high future earnings (e.g.,
       Engineering).

   •   We find inequities in repayment outcomes that cut along lines of race and class. For
       example, Black and Native American borrowers at these six universities have lower
       paid in full rates but higher default rates than white and Asian American borrowers.
       These inequities are products of racial wealth gaps and disaggregating repayment
       data can help partner universities evaluate efforts to help close these gaps.

   •   The current repayment pause skews existing repayment rates metrics (e.g., College
       Scorecard, PROSPER Act, College Affordability Act) and rates vary considerably within
       each university in this analysis.

We conducted this analysis in partnership with six universities with the goal of supporting
their ongoing efforts to improve loan outcomes for current and former students. The results
are correlational (not causal) and they aid each university’s ongoing default prevention and
outreach efforts including financial wellness programming, informational campaigns, and
internal monitoring/assessment of how students borrow and repay federal loans. Results can
also help inform public policy conversations interested in using repayment metrics for
accountability purposes. For example, to make accountability metrics more useful for
practice and addressing inequities, policymakers may consider disaggregating rates by debt
levels, repayment plans, and student characteristics.

                                                                                               1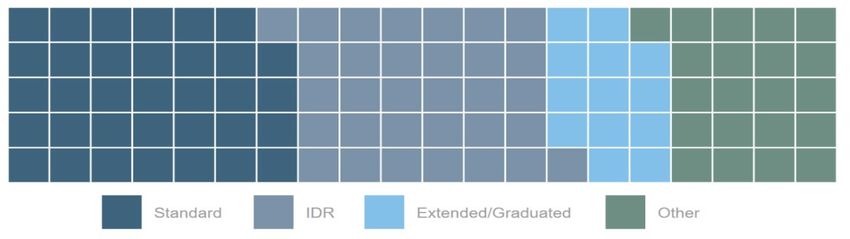
Evaluating Federal Student Loan Repayment Outcomes

Introduction

This report calculates student loan repayment rates and explores key loan repayment
outcomes among federal student loan borrowers who attended six public and private
research universities in the United States. The analysis is based on each institution’s National
Student Loan Data System (NSLDS). Findings will support each institution’s ongoing efforts to
monitor, assess, and improve loan outcomes of former students (e.g., default management
plans, loan counseling, etc.). 1

University leaders and federal policymakers are increasingly interested in how, when, and
with what effects borrowers are paying down their student loan debts. This interest dates
back to at least 1989 when Congress created the federal Cohort Default Rate (CDR) to
monitor and hold colleges accountable for loan repayment outcomes. The CDR measures the
percentage of borrowers who default on certain federal loans within three years of entering
repayment. If a college’s CDR is above 30%, the U.S. Department of Education requires it to
implement default prevention plans. 2 And if a college’s CDR is persistently above 30%, they
may be barred from participating in federal loan programs altogether.3 Alternatively, if a
college’s CDR is low enough, they may be granted additional flexibility, such as making early
disbursements to first-time borrowers and disbursing loans in single installments for students
studying abroad.4

These sanctions and rewards are built into existing CDR policies, yet they only focus on the
most extreme repayment outcome, default. As a result, federal policymakers have become
more interested in measuring intermediate repayment outcomes that shed light on the
lifecycle of repayment that CDRs do not capture. For example, the U.S. Department of
Education’s College Scorecard reports the percentage of undergraduate borrowers paying
down at least $1 on their principal balance.5 The PROSPER Act, introduced by Republicans in
the House of Representatives in 2017, measures the proportion of borrowers delinquent on
payments.6 And the College Affordability Act, introduced by House Democrats in 2019,
focuses on the share of borrowers making “on-time” payments.7 While neither the PROSPER
Act nor the College Affordability Act became law, they demonstrate bipartisan interest in
using repayment rates as an accountability mechanism within the Higher Education Act.

The following repayment rate measures illustrate the variety of methods proposed for
measuring loan repayment. Throughout this report, we demonstrate the potential strengths
and weaknesses of each measure:

   •   College Scorecard: Until 2018, the College Scorecard published data on the
       percentage of borrowers who have paid at least one dollar toward the principal
       balance one, three, five, or seven years after entering repayment. Since 2020, the
       Scorecard has disaggregated repayment rates by the share of borrowers who are: not
       making progress; making progress; in deferment; in forbearance; in default; in
       delinquency; or discharged.8

   •   PROSPER Act: This 2017 legislation proposes measuring the percentage of
       borrowers who have paid their loans in full, are in deferment or an approved
       forbearance, or are less than 90 days delinquent within two years of entering

                                                                                               2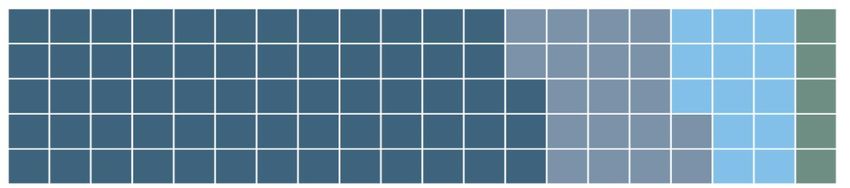
Evaluating Federal Student Loan Repayment Outcomes

       repayment. To remain eligible for Title IV aid, this proposal would require academic
       programs to maintain a loan repayment rate of 45% or higher.9

   •   College Affordability Act: This 2019 bill proposes using the percentage of
       borrowers who have paid at least 90% of their monthly payments “on time” (or repaid
       their loans in full) within three years of entering repayment. An on-time payment
       includes loans that are not delinquent, those with zero-dollar payments due, and
       certain deferment/forbearances.10

In response to the COVID-19 pandemic, the U.S. Department of Education moved certain
Direct Loans into administrative forbearance (with 0% interest rates) in March 2020.11 At the
time of this writing, the repayment pause was in place and scheduled to expire at the end of
August 2022, meaning borrowers have not been required to repay their loans for more than
two years. Researchers are concerned that many borrowers will struggle to restart payment
and could fall back into delinquency or default when the forbearance period ends.12 There
are also growing concerns that using repayment rates as an accountability tool will have
limited impacts on colleges and universities.13

Table 1 briefly summarizes three repayment metrics currently used in federal policy
conversations. The College Scorecard focuses on making any progress toward reducing
principal balances while the PROSPER Act and College Affordability Act (CAA) rates focus on
making timely and consistent payments, regardless of whether those payment reduce a
borrower’s principal balance. Notably, each metric handles administrative forbearance
differently, where only CAA counts the current repayment pause as a positive repayment
outcome and the others do not. Similarly, both the CAA and PROSPER Acts exclude
economic hardship and unemployment deferment from the numerator, effectively penalizing
these forms of deferment while allowing military service and certain medical residency
deferments to count towards positive repayment. With these details in mind, we are able to
estimate repayment rates under each formula in order to support ongoing loan repayment
planning and outreach efforts at the six partner universities that provided data for this report.

                                                                                                3
Evaluating Federal Student Loan Repayment Outcomes
Table 1:
Repayment rate formulas
College Scorecard PROSPER CAA
Number of borrowers:
Number of borrowers:
a) paid in full; b) in
a) paid in full; b) in
Number of borrowers deferment or
deferment or
Numerator paying at least $1 approved forbearance;
approved forbearance;
toward principal and c) making on-time
and c) less than 90
or zero-dollar
days delinquent
payments
Total number of
Total number of Total number of
Denominator borrowers not in
borrowers borrowers
approved deferments
Undergraduate & Undergraduate &
Degree level Undergraduate only
graduate/professional graduate/professional
Repayment
1, 3, 5, 7 years 2 years 3 years
period
Direct Loans and Direct Loans and
Undergraduate
Federal Family Federal Family
federal loans except
Covered loans Education Loans, Education Loans,
Perkins and Parent
including Grad PLUS including Grad PLUS
PLUS
Loans Loans
Unit of analysis Institution Program Institution
Context for Understanding Loan Outcomes
As shown above, repayment rates vary considerably in how they are measured, which loans
and loan statuses are included, and whether they are measured at the institution or program
level. This section outlines several additional considerations to weigh when examining loan
outcomes.
First, correlation is not causation: students may have poor loan outcomes due to factors we
simply do not measure or are too complex to measure.14 For example, if a borrower is having
life experiences that make it difficult to repay, we will not know the specific reasons for not
making payments. Accordingly, we interpret these outcomes as correlational (and not causal)
patterns since there are likely several omitted variables that could explain why these
outcomes occur. Second, loan outcomes can vary on a monthly basis as borrowers may move
4Evaluating Federal Student Loan Repayment Outcomes
in and out of various loan status and repayment plans. Our analysis reports loan outcomes at
a single point-in-time and does not capture this month-to-month granularity. Third, when
group sizes are relatively small (i.e., fewer than 30 observations) repayment rates can be
sensitive to the "law of large numbers." 15 While we report the overall denominator to provide
context, some subgroups have relatively small denominators and we do not report cases with
fewer than 30.
In addition to these technical considerations, it is useful to interpret student loan debt and
repayment through the lens of social science. Doing so allows us to understand and explain
how social inequities – often drawn along lines of race and class – can shape who borrows,
how much, and repayment outcomes. For example, there are large and persistent wealth
gaps between racial and ethnic groups in America due to inequities in homeownership,
education, labor markets, and a host of other wealth-building activities that have historically
advantaged white individuals over people of color. 16 Today, the largest wealth gap is
between white and Black individuals is 5:1 and has held steady for decades. 17 Because of
these large differences, Black families in American typically have fewer resources to pay for
college and are more likely to borrow – and to borrow more – than white students. 18 This gap
also results in white students having more resources to repay loans quickly, thus reducing
their risks associated with carrying debts for long periods of time.19 Student loans are
therefore tightly connected to racial wealth gaps, where loan outcomes are in many respects
a result of these broader racial and economic inequities. 20
Data Sources and Key Measures
The School Portfolio Report (SPR) is derived from the NSLDS and contains loan-level
information including the type of loan, original principal amount borrowed, remaining
principal balance, interest rate, and the amount of accumulated interest and fees. 21
Additionally, the SPR contains information critical to measuring loan repayment outcomes,
including: current loan status; current repayment plan; monthly payment amount; timing of
various events (e.g., date each loan entered repayment, monthly payment due dates;
forbearance, deferment, and default dates). These records are collected only for loans
disbursed by each partner institution; they exclude loans take at other institutions.
Additionally, the SPR does not provide educational records or demographic characteristics of
borrowers, so data stewards for each of the six university partners linked and deidentified
these records to enable further analysis and better understanding of the underlying dynamics
of borrowing behavior.
As shown in Table 2, this analysis includes federal loan borrowers who entered repayment
between federal fiscal years 2017 and 2019. This analysis includes outcomes for Direct
Subsidized and Unsubsidized Loans, including Grad PLUS loans and excluding Parent PLUS,
Perkins, and consolidation loans. 22 Loan outcomes of all 64,052 borrowers were "frozen” on
the date when each campus partner pulled their respective SPR files. 23 This approach allows
us to analyze repayment outcomes nearly five years after borrowers who started repaying in
fiscal year 2017 (i.e., the “2017 repayment cohort”) entered repayment. This also means
certain federal loans included in the analysis have been in administrative forbearance since
March 2020, which affects some repayment rate estimates shown below.
5Evaluating Federal Student Loan Repayment Outcomes
Table 2:
Original principal borrowed, by degree level and repayment cohort
2017 2018 2019 All cohorts
Undergraduate
Total original principal (millions) $214.2 $224.8 $231.6 $670.6
Mean original principal $15,762 $16,196 $15,834 $15,931
Median original principal $14,531 $14,833 $14,328 $14,500
Number of borrowers 13,589 13,879 14,625 42,093
Graduate / Professional
Total original principal (millions) $300.6 $322.0 $482.0 $1,104.6
Mean original principal $47,288 $56,685 $48,584 $50,305
Median original principal $41,000 $43,800 $35,963 $41,000
Number of borrowers 6,357 5,681 9,921 21,959
Total original principal (millions)
Total original principal (millions) $514.8 $546.8 $713.6 $1,775.2
Mean original principal $25,810 $27,956 $29,071 $27,715
Median original principal $19,500 $19,000 $19,000 $19,000
Number of borrowers 19,946 19,560 24,546 64,052
Across each cohort, the median amount disbursed per borrower is approximately $19,000, in
total accounting for $1.775.2 billion across 64,052 borrowers. While there were more
undergraduate borrowers (n=42,093) than graduate/professional borrowers (n=21,959),
undergraduates borrowed about half the dollar amount of graduate/professional students.
For example, undergraduates across all three cohorts at these six universities took out $670.6
million (or about $15,931 per student) while graduate/professional students borrowed
$1.104.6 billion (or about $50,305 per student).
Figure 2 shows these differences in more detail, where graduate students have much larger
principal amounts due in part to aggregate and annual borrowing limits. This figure also
shows why it is useful to report median (rather than mean) statistics when reporting debt
levels. Figure 2 is skewed to the right, meaning outliers can easily inflate the mean; therefore,
this report focuses on median amounts, which tend to be slightly lower than the mean. Also
worth noting, debt levels are controlled to some extent by federal policies. Dependent
undergraduates can borrow up to $31,000 over the course of their total undergraduate
degrees in subsidized and unsubsidized loans; independent undergraduates can borrow up
to $57,500 in aggregate. 24 For graduate or professional students, these caps are set to
$138,500 including loans for undergraduate study. Graduate students can exceed these caps
if they take out Grad PLUS loans (included in this analysis).
6Evaluating Federal Student Loan Repayment Outcomes
Figure 1:
Distribution of original principal amount by degree level (all cohorts)
Note: This chart excludes values above $200,000 (n=144).
Repayment Statuses
Background context
When borrowers enter repayment, they typically start the process on a 10-year time horizon
where each monthly payment is made via a fixed amortization schedule. Nationally, the
average borrower takes 13 years to repay their federal loans. 25 A lot can happen in these 13
years; for example, a borrowers might re-enroll in school and request their loans to be
deferred. They may face temporary financial hardship and request a forbearance, or they may
fall behind entirely and end up defaulting. Alternatively, a borrower might never fall behind
on payments or they may even quickly repay their loans in full.
Researchers have only recently started to explore the lifecycle of repayment using robust
NSLDS data and our analysis adds to this growing body of literature.26 A recent nationally-
representative analysis found borrowers navigate in and out of various repayment statues
throughout their life course, with a wide variation in experiences that cut along lines of race
and class.27 For example, approximately one-fifth of borrowers repay their loans within five
years while another one-in-ten default in this same time period.28 There are many pathways
through repayment, meaning statuses are likely to change each month and year. To simplify
7Evaluating Federal Student Loan Repayment Outcomes
this process, our analysis focuses on four main repayment statuses: in repayment; in
deferment/forbearance; paid in full; and default.
Findings
Table 3 disaggregates loan repayments statuses for undergraduate and
graduate/professional students. It shows most undergraduate borrowers (67%) and
graduate/professional borrowers (72%) have a repayment status of “in
deferment/forbearance.” With more than two-thirds of borrowers in deferment/forbearance,
the only other large share of borrowers are those who paid in full. Among undergraduates,
29% have paid in full while this rate is 26% for graduate/professional borrowers. Together,
these two groups (i.e., in deferment/forbearance and paid in full) represent approximately
97% of all borrowers in the full analysis. The remaining 3% of borrowers are either in
repayment, presumably for voluntarily opting into repayment or for loans ineligible for the
pause, or in default.
Table 3:
Median original principal, by degree level, repayment status, and cohort
% of
2017 2018 2019 Total n
borrowers
Undergraduate
In Repayment $17,775 $19,179 $18,500 $18,750 688 2%
Deferment/Forbearance $17,750 $17,000 $17,500 $17,500 28,396 67%
Paid in Full $9,500 $8,500 $7,000 $8,000 12,259 29%
Default $11,000 $12,758 $18,250 $12,500 750 2%
Total $14,531 $14,833 $14,328 $14,500 42,093 100%
Graduate/Professional
In Repayment $40,135 $38,635 $41,000 $41,000 343 2%
Deferment/Forbearance $41,000 $47,646 $36,482 $41,000 15,879 72%
Paid in Full $41,000 $40,500 $31,857 $38,492 5,627 26%
Default $41,000 $41,015 $101,564 $42,516 110 1%
Total $41,000 $43,800 $35,963 $41,000 21,959 100%
Total
In Repayment $20,500 $21,500 $21,500 $21,470 1,031 2%
Deferment/Forbearance $21,500 $20,500 $21,370 $21,135 44,275 69%
Paid in Full $14,000 $13,000 $10,719 $12,666 17,886 28%
Default $14,000 $15,271 $19,000 $15,000 860 1%
Total $19,500 $19,000 $19,000 $19,000 64,052 100%
Table 3 also reports median original principal amounts borrowed for each repayment status.
Although undergraduate and graduate/professional borrowers have overall similar paid in
full rates, undergraduates tend to carry considerably lower median debts when they paid in
full ($8,000 vs. $38,492, respectively). In total, when looking at repayment statuses of all
borrowers, the median debt when paid in full was $12,666 – considerably lower than the
8Evaluating Federal Student Loan Repayment Outcomes
overall median of $19,000. Similarly, undergraduate borrowers who defaulted tend to carry
relatively lower debts: approximately $12,500 across all three cohorts. However, when
graduate/professional borrowers default, their median debt tends to be close to the overall
median, except in the case of the 2019 cohort which is considerably higher than the median.
While undergraduate and graduate/professional borrowers have similar paid in full and
default rates, the underlying amount of debt for each of these groups is considerably
different from one another. Further research is necessary to fully understand how and why
undergraduate and graduate/professional borrowers have similar rates yet different amounts
on these key metrics. For example, there is research consensus that those who default tend to
carry low debts because they leave college before completing their degree; however, this
pattern may not be the same for graduate/professional students at these six universities.29
Repayment Plans
Background context
A recent research study using nationally representative NSLDS data found repayment is
“frequently interrupted by spells of deferment, negative amortization/forbearance, and
default that can last years” and “no two repayment trajectories are the same.”30 This is due in
large part to the various repayment plans borrowers opt into. For example, the standard 10-
year repayment plan requires borrowers to make fixed payments for the entire 120-month
repayment period regardless of the borrower’s income. Nationwide, 41% of federal loan
borrowers repay via this plan. But if a borrower opts into an Income-Driven Repayment (IDR)
plan, which includes Income-Contingent Repayment (ICR), Income-Based Repayment (IBR),
Pay As You Earn (PAYE) and Revised Pay As You Earn (REPAYE), monthly payments are set at
a percentage of the borrower’s annual earnings (generally between 10% and 15% of
discretionary income) and are made over the course of 20 to 25 years at which time they are
forgiven. 31 Nationwide, 34% of federal loan borrowers repay via an IDR plan; 25% of
borrowers repay through some alternative plan like extended or graduated plans that are not
pegged to incomes but offer smaller payments earlier in the amortization schedule. 32
To illustrate how IDR plans work, a borrower who owed $45,000 and had an adjusted gross
income of $40,000 in 2022 (with no spouse or dependents) would have a monthly payment
of $467 under a standard 10-year repayment plan. That payment would be only $174 under
PAYE or REPAYE based on their income and household size. 33 In exchange for these lower
monthly payments under PAYE and REPAYE borrowers agree to extend their repayment
period from 10 to 20 or 25 years. During this time, unpaid interest can get added to the
principal balance (i.e., “capitalized”), resulting in balances that grow over time and are
eventually forgiven. For many borrowers, this tradeoff is worth it – research finds IDR protects
borrowers from defaulting and can be a financial benefit for those who opt in.34 However, this
benefit comes with costs where borrowers must navigate significant administrative burdens
in order to participate and stay enrolled in IDR programs. 35 Table 4 summarizes key features
of current IDR programs and the following analysis will examine debts and repayment
outcomes by repayment plans.
9Evaluating Federal Student Loan Repayment Outcomes
Table 4:
Overview of income-driven repayment plans
Monthly Participation Interest Forgiveness
Created
payments criteria capitalization horizon
Lesser of:
Income- (a) 20% of Capped at
Contingent discretionary Any eligible 10% of
1994 25 years
Repayment income, or (b) Direct Loan principal
(ICR) 12-year fixed balance
schedule
Eligible Direct
Loan or
Capitalizes
Income- Federal Family
10-15% of when
Based Education 20 to 25
2009 discretionary borrower does
Repayment Loan; Must years
income not qualify or
(IBR) have Partial
leaves plan
Financial
Hardship
Eligible Direct Capitalizes
10% of Loan; Must when
Pay As You
2012 discretionary have Partial borrower does 20 years
Earn (PAYE)
income Financial not qualify or
Hardship leaves plan
Eligible Direct
Capitalizes
Loan; No
Revised Pay 10% of when
Partial 20 to 25
As You Earn 2015 discretionary borrower does
Financial years
(REPAYE) income not qualify or
Hardship
leaves plan
requirement
Findings
Figure 2 shows the distribution of borrowers among the six universities according to their
repayment plans. There are 100 squares, meaning each individual square represents one
percent of the borrowers in the dataset. The top panel shows repayment plan use among
undergraduate borrowers, the most popular repayment plan among these borrowers is the
10-year standard plan (63%), while 19% selected IDR plans, 13% selected extended/
graduated plans, and 5% were in other/alternative plans. The bottom panel shows repayment
plans among graduate borrowers. Among this group, the 10-year standard plan and IDR
plans are equally popular among graduate students, with 34% of borrowers choosing the
standard plan and 32% choosing IDR plans. An additional 13% selected extended/graduated
plans, and 21% were in other/alternative plans.
10Evaluating Federal Student Loan Repayment Outcomes
Figure 2:
Repayment plans by degree level (all cohorts)
Undergraduate
Grad / Prof.
Table 5 examines the median amount borrowers initially took out across each repayment
cohort, degree level, and repayment plan. Across both undergraduate and
graduate/professional students who borrowed, those repaying in standard plans tend to
carry the lowest median original principal balance ($15,000 and $36,865 respectively).
However, borrowers who opt into IDR plans tend to have larger original principal amounts.
This finding is consistent with national studies finding IDR participants tend to have larger
debts than borrowers repaying in standard plans. 36 For example, borrowers repaying via
REPAYE had median original principal amounts of $22,180 (undergraduate) and $51,705
(graduate/professional), which is several thousand dollars more than borrowers in standard
plans.
11Evaluating Federal Student Loan Repayment Outcomes
Table 5:
Median original principal of borrowers in repayment or forbearance/deferment, by repayment
plan, degree level, and cohort
% of
2017 2018 2019 Total n
borrowers
Undergraduate
Standard $15,000 $15,000 $15,340 $15,000 18,485 64%
Income-Driven
IBR $19,500 $21,500 $20,664 $21,000 767 3%
ICR $19,500 $17,500 $18,375 $19,000 228 1%
PAYE $20,312 $20,250 $19,000 $19,500 1,161 4%
REPAYE $23,000 $22,023 $21,542 $22,180 3,310 11%
Extended $28,500 $28,000 $27,125 $28,000 1,176 4%
Graduated $19,500 $19,000 $19,491 $19,494 2,627 9%
Other / Alternative $18,900 $17,068 $16,800 $17,991 1,330 5%
Total $17,750 $17,052 $17,500 $17,500 29,084 100%
Graduate/Professional
Standard $38,450 $40,500 $34,899 $36,865 5,537 34%
Income-Driven
IBR $41,000 $48,534 $36,510 $41,000 825 5%
ICR $34,316 $41,000 $33,500 $36,953 98 1%
PAYE $44,500 $55,018 $47,130 $48,260 2,721 17%
REPAYE $46,233 $60,245 $50,575 $51,705 1,566 10%
Extended $41,000 $55,204 $44,342 $45,000 1,259 8%
Graduated $40,484 $39,500 $41,027 $40,754 971 6%
Other / Alternative $41,000 $51,000 $28,326 $32,371 3,245 20%
Total $41,000 $47,375 $36,616 $41,000 16,222 100%
Total
Standard $17,500 $17,000 $18,333 $17,635 24,022 53%
Income-Driven
IBR $27,000 $27,000 $26,450 $27,000 1,592 4%
ICR $20,500 $21,478 $21,191 $20,941 326 1%
PAYE $36,940 $35,887 $34,290 $35,500 3,882 9%
REPAYE $27,000 $25,000 $25,058 $26,000 4,876 11%
Extended $31,092 $35,000 $31,000 $31,808 2,435 5%
Graduated $21,500 $20,909 $22,150 $21,500 3,598 8%
Other / Alternative $22,166 $23,500 $25,640 $24,250 4,575 10%
Total $21,500 $20,500 $21,394 $21,148 45,306 100%
12Evaluating Federal Student Loan Repayment Outcomes
Outstanding Balances by Repayment Plan
Background context
Depending on the type of loan and when it was disbursed, borrowers will face different
interest rates that typically range between 3% and 5%.37 In the SPR, outstanding balances are
disaggregated between principal and interest, allowing us to sum the two and calculate total
outstanding balances. If a borrower’s monthly payment does not cover their interest, then the
balance can be added to the borrower’s principal thus making balances grow over time.38 As
discussed earlier, borrowers who opt into IDR plans might experience interest capitalization,
resulting in loans balances that continue to rise. Researchers from the Congressional Budget
Office (CBO) found this to be prevalent among IDR plans, where the amount owed by
borrowers in IDR grew over time while balances for borrowers using standard plans shrunk
over time. Specifically, borrowers who entered repayment in 2010 and enrolled in IDR owed
approximately 20% more than their original balance after five years in repayment. Meanwhile,
those in non-IDR plans owed approximately half of what they did upon entering repayment.
After seven years of entering repayment, over 75% of borrowers in IDR plans owed more
than they originally borrowed.39
Findings
Figure 3 examines this issue at these six universities by showing the percent of original
principal outstanding cohort by repayment plan. For example, if a borrower originally took
out $10,000 in principal and, at the time of this analysis, had an outstanding balance of
$9,000, then they would owe 90% of their original principal. However, if this same borrower
had an outstanding balance of $11,000, then they would owe 110% of what they originally
borrowed (indicating they are not making progress on paying down their principal). The
College Scorecard measures the proportion of borrowers who are paying down their debts,
in which case those with 90% remaining would be treated as a positive outcome while those
with 110% remaining would not.
13Evaluating Federal Student Loan Repayment Outcomes
Figure 3:
Percentage of original principal outstanding, by repayment plan and cohort
Figure 3 shows borrowers at these six universities repaying via IDR plans (other than ICR)
typically owe more than they originally borrowed. For example, among borrowers in the
2017 repayment cohort repaying via PAYE, the average borrower owes 16% more than they
originally took out (i.e., 116%). On the opposite end of Figure 3 we see borrowers from the
2017 cohort who repay via standard plans owe, on average, 77% of their original principal
(i.e., they have paid 23% of their original principal).
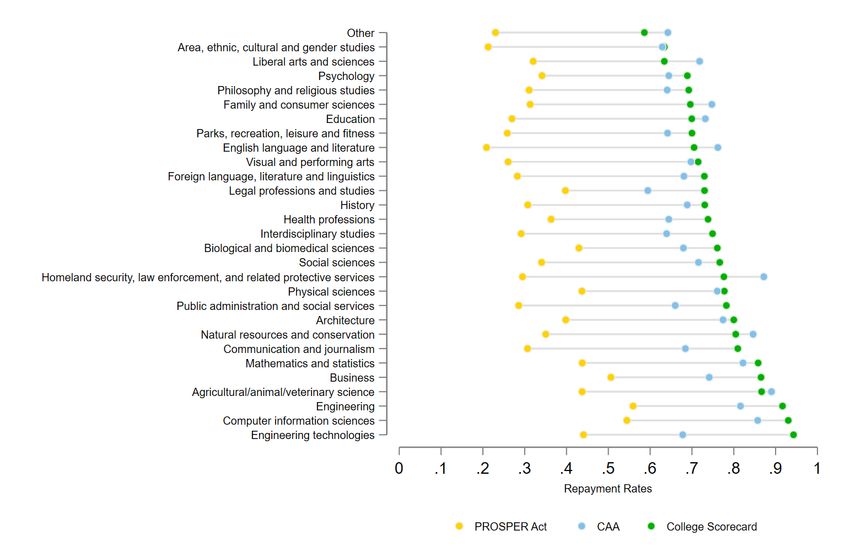
To illustrate this pattern in more detail, Figure 4 plots borrowers’ original principal balances
on the horizontal axis and their outstanding balance on the vertical axis. The solid black line in
each panel represents the break-even point where borrowers above the line owe more than
they originally borrowed while those below the line owe less. For borrowers at these six
universities repaying in standard 10-year plans (left panel) we see most observations fall
below the solid line. The blue dashed line marks the middle of the distribution where the
average borrower at all original principal amounts owe less than they originally borrowed.
However, we see an opposite pattern for borrowers repaying via IDR (right panel) where the
dashed blue line is above the solid black line, representing most borrower owe more than
they originally borrowed. This additional context is relevant for understanding repayment
rate outcomes at the six universities where having greater reliance on IDR may help
borrowers avoid default (and eventually benefit from forgiveness) but it may make these
institutions have low repayment rates under the College Scorecard metric. Understanding the
14Evaluating Federal Student Loan Repayment Outcomes
mechanism for low repayment rates is therefore critical for these universities to identify why
borrowers are not making progress on their principal – a borrower failing to make payments
due to IDR could be very different from one who fails to repay due to cycling through
forbearance or struggle to make full payments under a standard 10-year plan.
Figure 4:
Original versus outstanding balance, by repayment plan (2017 cohort)
Student Characteristics and Repayment Outcomes
Background context
As discussed in the earlier section on “Context for Understanding Loan Outcomes” there are
significant racial and economic inequities in who borrows and repays student loans. These
inequities stem from racial wealth gaps, where the very students who are most likely to
borrow loans to pay for college (due to wealth inequities) are those who also have the least
wealth upon exiting college and therefore may not be in a position to quickly repay their
loans. Alternatively, students with the greatest family wealth may need to borrow the least (if
at all) and may also be well positioned to use their family’s wealth to quickly pay down
loans.40
By linking SPR data with student demographic records, we are able to disaggregate loan
repayment rates to explore the magnitude of differences that exist across student groups at
these six universities. For example, we can examine two opposite extremes of the repayment
experience – paid in full (PIF) and default – that can have consequences on borrowers’ overall
financial wellbeing. A borrower who pays in full no longer carries any balance on any loans
included in this analysis, while a borrower who falls behind and fails to make any payments
for at least 270 days are placed in default.41 Just as the default rate is a key measure for
monitoring and intervening in negative loan outcomes, the PIF rate can be a useful measure
for understanding and communicating positive loan outcomes. 42 These rates can also help
these six campuses measure and monitor inequities that may exist in repayment outcomes.
This section also includes a summary of student characteristics associated with opting into
IDR repayment plan at these six universities. Given the relatively high take-up rates of IDR and
the financial benefits (and costs) associated with these plans, this first look can help partner
15Evaluating Federal Student Loan Repayment Outcomes
universities identify patterns and construct appropriate outreach and guidance for helping
students navigate the transition into repayment.
Findings
Table 6 shows the number of borrowers falling into each of these three loan statuses,
disaggregated by: first-generation status; Pell Grant status; race/ethnicity; age group; binary
gender; completion status; and degree level. The table also shows the percent of borrowers
(within each group) experiencing these three outcomes. For example, it shows 6,987 of
26,375 “first-generation” students (26%) at these universities who entered repayment
between fiscal years 2017 and 2019 had fully repaid their loans by 2021. It also shows 536 of
these same 26,375 first-generation borrowers (2%) were in default at the time the SPR data
were pulled. Finally, it shows 4,258 of these 26,375 first-generation student borrowers (16%)
were repaying via an IDR plan.
Table 6:
Paid in full, default, and IDR participation rates by student characteristics (all cohorts)
Income-Driven
Total Paid in Full Default
Repayment
n % n % n % n %
First-gen Not first-gen 37,677 59% 10,899 29% 324 1% 7,554 20%
status First-gen 26,375 41% 6,987 26% 536 2% 4,260 16%
Never Pell 43,863 68% 12,892 29% 367 1% 8,457 19%
Pell status
Pell ever 20,189 39% 4,994 25% 493 2% 3,357 17%
White 31,245 49% 8,755 28% 308 1% 5,772 18%
Black 4,143 6% 540 13% 115 3% 1,090 26%
Hispanic 13,119 20% 2,701 21% 280 2% 2,564 20%
Asian Amer. 9,163 14% 4,223 46% 54 1% 1,071 12%
Racial /
Ethnic Native Amer. 331 1% 42 13% - - 52 16%
Group Pacific Islander 88 0% - - - - - -
Multiple 1,998 3% 547 27% - - 367 18%
Unreported 3,866 6% 1,047 27% 57 1% 843 22%
Eligible non-
99 0.2% - - - - - -
citizen
< 25 5,665 9% 2,285 40% 135 2% 340 6%
Age Group 25 - 30 38,986 61% 10,428 27% 477 1% 6,066 16%
30+ 19,397 30% 5,172 27% 248 1% 5,408 28%
Male 30,116 47% 8,861 29% 474 2% 4,704 16%
Binary
Female 33,506 52% 8,926 27% 383 1% 7,012 21%
Gender
Unreported 430 1% 99 23% - - 98 23%
Completion Non-completer 11,762 18% 2,157 18% 562 5% 1,857 16%
status Completer 52,290 82% 15,729 30% 298 1% 9,957 19%
Degree Undergrad. 42,093 66% 12,259 29% 750 2% 5,942 14%
level Grad./Prof. 21,959 34% 5,627 26% 110 1% 5,872 27%
16Evaluating Federal Student Loan Repayment Outcomes
Note: Denominator for total includes all students while denominator for paid in full, default,
and IDR correspond to each sub-group.
Table 6 provides many different comparisons, and we will briefly highlight three key
disparities revealed through this analysis. First, students who do not complete their degree
have default rates that are five-times greater than completers. Although these rates are still
relatively small (5% and 1%, respectively), about two-thirds of all defaulters at these six
universities left without earning a degree, reinforcing earlier research showing a link between
debt and no degree and default risk.
Second, PIF rates vary considerably across race/ethnicity, ranging from a low of 13% among
Black borrowers and Native American borrowers, to a high of 28% and 46% among white and
Asian American borrowers, respectively. This links back to the earlier discussion of racial
wealth gaps, where the same factors associated with borrowing more appear to also be
associated with paying loans shortly after leaving college. Further research would enhance
our understanding of the role racial wealth gaps play in shaping and closing inequities in
repayment outcomes.
And third, borrowers who are graduate/professional students, 30+ year old, and Black tend
to participate in IDR plans at higher rates than other borrowers at these universities. These
same students also tend to carry higher median loan debt than other students, as shown in
Appendix A. Given the negative amortization discussion from earlier, it is also likely that these
students’ outstanding balances are growing over time and will warrant further research and
investigation.
Together, these patterns point to disparities in loan outcomes while highlighting the fact that
there are no “typical” situations for repayment at these six universities. Some borrowers pay
their loans in full quickly, some end up in default, and others opt into IDR plans leaving them
between these two opposite ends of the repayment spectrum (and with balances likely rising
over time). Much more research is necessary to understand and ultimately improve these
outcomes, and the information provided in Table 6 (and Appendix A) can help in that pursuit
by establishing baseline patterns to help inform ongoing discussions on each partner
university.
Estimating Repayment Rates
Background context
The College Scorecard has yet to report repayment rates by borrowers’ degree level,
repayment plans, original principal amount, or key student characteristics. Additionally,
neither the PROSPER Act nor the College Affordability Act propose repayment rates that
disaggregate borrowers by these same factors. In light of the findings outlined above and
given the utility this information has for administering federal loan programs on campuses,
the following analysis estimates several new repayment rates that can prove useful for policy
and practice.43
17Evaluating Federal Student Loan Repayment Outcomes
Additionally, research shows loan outcomes typically change over time; accordingly, we
should expect repayment rates to differ by how long borrowers have been in repayment.44
Unfortunately, the SPR data does not allow us to limit our estimates to certain windows of
time. For example, we are unable to limit the 2017 cohort to “within two years” or “within
three years” of entering repayment because the data are frozen at their extraction date. As a
result, all repayment rates for the 2017 cohort are measured in a five-year window of time
since the SPR data was extracted at the end of 2021.
One additional consideration is that each repayment rate is affected by the repayment pause
differently. For example, the College Scorecard is based on repaying principal balances. But
more recent cohorts of borrowers (who have made no payments during the repayment
pause) will be making no progress toward their principal balance unless they opted in to
making payments during the pause. Borrowers who were in repayment prior to the pause are
likely to have made progress paying down at least some of their principal balance, meaning
College Scorecard rates will likely be lower for more recent repayment cohorts.
Additionally, our understanding of the PROSPER Act is that the administrative forbearance
used during the repayment pause does not count as positive repayment. 45 Consequently, our
estimates for the PROSPER Act repayment rate will result in low rates due in large part to the
repayment pause. Alternatively, our interpretation of the CAA rates is that administrative
forbearance does count, resulting in relatively high rates due in large part to the repayment
pause. 46 However, even with the repayment pause, CAA repayment rates at these universities
will not be 100% since the bill also requires borrowers to have “paid at least 90 percent of the
monthly payment” during a three-year period. 47 Our period expands to five years, meaning
borrowers who were delinquent prior to the repayment pause will bring this rate down in our
calculations.
Repayment rates by cohort
Table 7 reports our calculations of institutional repayment rates under each formula for each
repayment cohort and degree level. Under each formula, higher rates are associated with
positive outcomes. For example, the table shows 77% of undergraduate borrowers in the
2017 cohort paid at least one dollar down on their principal balance (i.e., College Scorecard
metric), 38% are not falling too far behind on payments (i.e., PROSPER metric), and 75% are
making "on time" payments according to the CAA's measure. Graduate/professional
borrowers tend to have lower repayment rates – likely a function of their higher participation
rates in IDR repayment plans. Notably, the College Scorecard repayment rate is only for
undergraduate borrowers but we calculate rates for graduate/professional borrowers.
Similarly, PROSPER and CAA do not disaggregate by undergraduate or
graduate/professional borrowers, so this table adds new context to what those rates might
look like at these six universities if disaggregated by degree level.
18Evaluating Federal Student Loan Repayment Outcomes
Table 7:
Estimated repayment rates among borrowers at all six partner universities, by repayment
cohort
All
2017 2018 2019
cohorts
Undergraduate
College Scorecard 77% 75% 72% 75%
PROSPER Act 38% 34% 34% 35%
CAA 75% 77% 81% 78%
Graduate/Professional
College Scorecard 56% 54% 39% 48%
PROSPER Act 39% 34% 27% 32%
CAA 64% 57% 45% 54%
Total
College Scorecard 70% 68% 57% 65%
PROSPER Act 38% 34% 31% 34%
CAA 71% 71% 67% 69%
Repayment rates by academic program
Using 2-digit CIP codes for the 2017 repayment cohort, Figure 5 shows how repayment rates
vary across academic programs using each of the three repayment measures. Although Table
5 disaggregated between undergraduate and graduate/professional borrowers, all
subsequent findings revert to the original definitions outlined in Table 1 (i.e., undergraduate
only for College Scorecard and both undergraduate and graduate/professional for PROSPER
and CAA).
Figure 5 shows wide degrees of variation occurring within these six universities where some
programs have considerably higher rates than others. For example, borrowers who were in
Engineering and Computer Information Sciences at these six universities have the highest
College Scorecard repayment rates compared to other academic programs, while borrowers
who were in Physical Sciences or Biological and Biomedical Sciences programs at these
institutions had some of the highest PROSPER Act and CAA repayment rates. In contrast,
borrowers at these six universities who studied Public Administration and Social Services,
Visual and Performing Arts, and English Language and Literature tended to have the lowest
PROSPER and CAA repayment rates, while Legal Professions and Studies and Liberal Arts
and Sciences had the lowest College Scorecard rates. Consequently, programs with the
highest and lowest repayment rates among borrowers at these six universities vary
depending on which measure they apply.
19Evaluating Federal Student Loan Repayment Outcomes
Figure 5:
Estimated repayment rates for 2017 cohort, by program
Repayment rates by repayment plan
In addition to calculating repayment rates by academic programs, we calculated repayment
rates by borrowers’ repayment plans. Table 8 shows these rates for the 2017 repayment
cohort by each repayment plan, where borrowers in standard plans tend to have among the
highest repayment rates, while those in various income-driven plans (e.g., IBR, ICR, etc.) have
considerably lower rates under the College Scorecard and PROSPER Act measures.
Table 8:
Estimated repayment rates for 2017 cohort, by repayment plan
College
PROSPER CAA
Scorecard
Standard 86% 42% 72%
IBR 55% 18% 66%
ICR 72% 17% 81%
PAYE 52% 19% 64%
REPAYE 37% 15% 70%
Extended 42% 21% 73%
Graduated 78% 23% 70%
Other/Alt. 87% 68% 74%
Total 77% 38% 71%
20Evaluating Federal Student Loan Repayment Outcomes
We have identified three likely factors driving each repayment rate at these six universities.
For the College Scorecard, when borrowers opt into IDR they typically have lower repayment
rates since these plans are designed to provide zero-dollar or substantially reduced monthly
payments that do not reduce the original principal balance. As a result, the “dollar down”
metric used in the College Scorecard will be deflated. For the PROSPER Act, repayment rates
are typically low because we understand the current repayment pause to not “count” as a
positive repayment outcome. As a result, PROSPER Act repayment rates are mainly
measuring the “paid in full” rate at these institutions. Finally, CAA are relatively high across all
repayment plans since they count the current repayment pause as a positive repayment
outcome. However, if a borrower fell behind in payments prior to the pause, they may not
have had enough time to get back into good standing under CAA.48
Repayment plans appear to play a non-trivial role in calculating repayment rates for College
Scorecard and PROSPER Act, but less of a role in CAA. For example, the College Scorecard’s
repayment rate is 86% for those repaying via standard plans but only 37% for those in
REPAYE. Similarly, borrowers in standard plans have 42% repayment rates under PROSPER
while those in REPAYE are 15%. We do not see these same differences in CAA, where
standard plans have repayment rates of 72% and REPAYE’s repayment rate is nearby at 70%.
Repayment rates by debt levels
Table 9 shows repayment rates for different levels of original principal amounts borrowed
(combining both undergraduates and graduate/professional students) in the 2017
repayment cohort. There are two patterns that emerge; first, higher original debts tend to
have higher outstanding balances. For the 1,107 borrowers with $70k or more of initial debt
(5.6% of the total), we see balances being greater than the principal (e.g., negatively
amortized). Borrowers with between $80k and $90k of debt, those with the greatest balances
relative to their principal, typically owed $8,582 more than their original principal. However,
borrowers with low initial principal amounts tend to have considerably lower outstanding
balances. For example, the median borrower who originally took out less than $10,000 only
owed $888 within five years of entering repayment.
The second pattern is that repayment rates across all three metrics generally decline as debt
levels rise. For example, borrowers with the lowest amount of initial debt (e.g., less than
$10,000) had College Scorecard repayment rates of 79% while those with the highest (e.g.,
more than $100,000) had a 28% rate. This gap is considerably large: 51 percentage points.
Gaps like this also appear for PROSPER and CAA repayment rates. While the number of
borrowers differs across debt levels, this general pattern is useful when considering sources
of variation in repayment rates: it may take very outreach, interventions, and strategies to
support borrowers with the highest debts versus those with the lowest.
21Evaluating Federal Student Loan Repayment Outcomes
Table 9:
Median original principal, outstanding balance, and repayment rate by debt levels (2017
cohort)
Median debt Repayment Rates
Original Outstanding College
n PROSPER CAA
principal balance Scorecard
< $10k 5,246 $5,500 $888 79% 53% 75%
$10k - $20k 4,919 $14,878 $8,972 81% 41% 75%
$20k - $30k 4,493 $24,318 $18,600 71% 28% 73%
$30k - $40k 1,462 $32,608 $31,842 53% 21% 71%
$40k - $50k 1,539 $41,000 $40,090 54% 36% 69%
$50k - $60k 420 $54,414 $55,745 49% 31% 54%
$60k - $70k 760 $61,500 $56,023 56% 38% 63%
$70k - $80k 261 $74,475 $74,587 49% 36% 34%
$80k - $90k 190 $83,777 $92,359 42% 30% 38%
$90k - $100k 167 $94,511 $98,944 43% 31% 35%
$100k + 489 $133,595 $133,393 41% 28% 54%
Total 19,946 $19,500 $8,157 70% 38% 71%
Repayment rates by student characteristics
Table 10 offers three new insights into repayment for each of the six partner universities. This
table reveals racial/ethnic inequities with respect to the original principal and outstanding
balances of borrowers. For example, white borrowers carried median original principal
balances ($20,300) near the overall average ($19,500). However, white borrowers’
outstanding balances are among the lowest of all racial/ethnic groups in this repayment
cohort. The median white student’s outstanding balance is $7,632, a reduction of $12,668
from their original principal amount borrowed. This represents a 62% decrease in debt while
Black, Native American, and Hispanic borrowers have reduced their original principal
amounts by 19%, 26%, and 43% respectively. Because 53% of the 2017 cohort paid their
loans in full, the median Asian American borrower has $0 outstanding balance. Not reported
here, the mean Asian American borrower has an outstanding balance of $7,000 suggesting a
wide degree of variation occurring within this racial/ethnic group.
The estimated repayment rates generally follow these same patterns where borrowers of
color tend to have lower repayment rates than white students. Some of these patterns could
be a function of which repayment plan borrowers select. For example, Black borrowers at
these universities are more likely to participate in IDR (as shown in Table 6) and most of these
plans require borrowers to have partial financial hardship to qualify. These plans also cause
outstanding balances to rise over time, meaning some Black borrowers at these universities
are likely paying down their loans at slower rates because of IDR. Further analysis is necessary
to understand these patterns, though they are likely rooted in racial wealth gaps discussed
earlier, where students’ ability to repay their loans are tied directly to existing racial and
economic inequities in our broader society. Similarly, further research should explore
variation in loan debt and repayment outcomes within racial/ethnic groups. For example,
22Evaluating Federal Student Loan Repayment Outcomes
within the Asian American racial/ethnic category, there are likely differences along regional,
national, and other cultural groupings.49 Exploring data in this way could also reveal patterns
on borrowers whose identities and experiences are not reflected by the median statistic (i.e.,
although the median for Asian Americans is $0 there may be meaningful sub-group
differences not captured in this statistic).
Table 10:
Median original principal, outstanding balance, and repayment rate by race/ethnicity (2017
cohort)
Median debt Repayment Rates
Original Outstanding College
n PROSPER CAA
principal balance Scorecard
White 9,752 $20,300 $7,632 72% 40% 73%
Black 1,214 $22,478 $18,227 43% 24% 57%
Hispanic 4,054 $18,664 $10,655 67% 27% 69%
Asian American 2,862 $16,672 $0 86% 56% 76%
Native American 92 $15,394 $11,371 50% 24% 66%
Pacific Islander - - - - - -
Multiple 572 $19,500 $10,232 67% 33% 66%
Unreported 1,356 $20,500 $10,017 63% 36% 70%
Eligible non-citizen - - - - - -
Total 19,946 $19,500 $8,157 70% 38% 71%
Conclusion
The School Portfolio Report is a useful data source for monitoring and assessing student loan
outcomes for colleges and universities. The six research universities in this study partnered
with the SSTAR Lab to explore their loan outcomes and repayment rates based on SPR data
for borrowers entering repayment between 2017 and 2019. Not only does this information
help each institution in the administration of their federal aid, but it also contributes to
ongoing default prevention and financial wellness efforts, exit counseling, and planning for
federal accountability policies. Related to this final purpose, this report estimated repayment
rates based on our understanding of the language in the College Scorecard data
documentation, and legislative text of the PROSPER and College Affordability Acts. It also
accounts for the current loan repayment pause, which not only affects repayment rate
calculations but has immediate implications on how borrowers will restart payment in the
near future. The process of navigating and successfully repaying student loans is complex
and this analysis sheds new light into patterns of how and how much debt borrowers from
these six universities have repaid:
• The six universities in our analysis disbursed over $1.7 billion to 64,052 borrowers
who entered repayment between the fiscal years 2017 through 2019. While the
average debt was $27,715, the median was $19,000 and this varied considerably for
undergraduate versus graduate/professional borrowers. The median
graduate/professional borrowers had $41,000 in original principal debt and
23Evaluating Federal Student Loan Repayment Outcomes
undergraduates had a median of just $14,500.
• Graduate students, Black students, and those ages 30+ at these six universities
participate in income-driven repayment rates at much higher rates than other students
and typically owe more than their original principal balance. Although the benefits of
IDR include certain consumer protections for borrowers (e.g., zero-dollar payments,
interest subsidies, loan forgiveness, and more manageable monthly payment
amounts) they can skew repayment rate metrics that fail to account for these
differences.
• Borrowers’ repayment outcomes are likely symptoms of broader social inequities
related to racial wealth gaps, where we found Black borrowers tend to have higher
original principal amounts of debt, higher outstanding balances, and lower repayment
rates than White borrowers at these universities. More research is necessary to fully
understand the causes and consequences of the inequities.
• There is no “typical” borrower, so default prevention, informational campaigns, loan
counseling, financial wellness efforts, and other financial aid practices require
institutions to take proactive and personalized outreach to support successful
repayment. For example, 28% of borrowers fully repaid their loans within five years of
entering repayment and they typically carried relatively low debts. However, only
about 1% of borrowers defaulted, but many of these defaults were concentrated
among non-completers. And some borrowers appear to opt into IDR plans while
others prefer standard or even extended plans. These various pathways are not well
understood in the research literature and can prove fruitful for helping borrowers
navigate the complex repayment system that awaits them after leaving college.
• Federal repayment rate proposals could benefit from the findings from these six
universities. At a minimum these rates should be disaggregated by repayment plans
and debt levels. Additionally, disaggregating loan outcomes by students’
racial/ethnic, academic, and socioeconomic characteristics – in addition to their
program of study and completion status – can support financial aid professionals in
their efforts to monitor and design appropriate responses based on their students’
needs.
The SPR provides a valuable resource for financial aid professionals to learn where inequities,
inefficiencies, and possibilities are for improving loan outcomes for undergraduate and
graduate/professional students. Using this data to inform practices can help borrowers
understand and navigate repayment, but it can also help universities leverage data and
accountability reforms in productive ways to support successful loan outcomes. Federal
policymakers may also benefit from the findings of this report to help design repayment rate
formulas that account for the complexities of loan repayment. These efforts hold great
promise for avoiding negative loan outcomes while promoting positive outcomes that can
help maximize borrowers’ return on their educational investment.
24You can also read