EVALUATION OF SOLID GREEN BICYCLE LANES TO INCREASE COMPLIANCE AND BICYCLE SAFETY - Submitted to: Federal Highway Administration Office of Traffic ...
←
→
Page content transcription
If your browser does not render page correctly, please read the page content below
EVALUATION OF SOLID GREEN BICYCLE LANES

TO INCREASE COMPLIANCE AND BICYCLE SAFETY

                  Submitted to:
          Federal Highway Administration
            Office of Traffic Operations

                  Submitted by:
                City of New York
          Department of Transportation

               February 8th, 2011
NATURE OF THE PROBLEM
On-street bicycle lanes are designed for the exclusive use of cyclists to enhance
safety and improve operations for all roadway users. Exclusive bicycle lanes
segregate roadway users of different sizes and speeds to reduce the likelihood of
crashes and improve mobility. Motorists have been observed driving, standing and
parking in bicycle lanes, thereby undermining the safety and traffic flow benefits of
these marked lanes. Motorists may be insufficiently aware of the presence of
bicycle lanes and their obligation to avoid driving, standing or parking thereon.
Frequent incursions of motorists into bicycle lanes can have an intimidating effect
on cyclists and lead to reduced levels of cycling. This problem has been noted
particularly where the bicycle lane is adjacent to the curb, rather than adjacent to a
lane of curbside parking.

By emphasizing the portion of the roadway adjacent to the curb reserved for the
exclusive or preferential use by cyclists, bicycle usage can be encouraged. Correct
lane positioning is important for cyclists at intersection approaches – especially for
the “right turn trap” type crash in which a vehicle encroaches into the bicycle lane
for a right turn and strikes a cyclist. By defining the correct lane position cyclists
may be more prominent in the cone of vision for both overtaking right turning
motorists and oncoming left turning motorists. According to the Institute for
Highway Safety/Highway Loss Data Institute website 35% of cyclist deaths in
2000 occurred at intersections. In New York City, intersections account for 88%
of cyclist injuries and 84% of cyclist fatalities.1 According to the FHWA’s
Transportation Air Quality – Selected Facts and Figures publication FHWA- PD-99-
015, commuter trips by bicycle declined by 20% from 1980 to 1990, while urban
traffic congestion levels from 1982 – 1996 had increases typically in the range of
20% - 30% (or more).

These developments are contrary to the goals of the National Bicycling and
Walking Study FHWA-PD-94-023 which are:
   1. To double the current percentage of total trips made by bicycling and
      walking, and;
   2. To simultaneously reduce by ten percent the number of cyclists and
      pedestrians killed or injured in traffic crashes.

According to Kenneth R. Wykle, former Federal Highway Administrator, in his

1 Cyclist injury data comes from NYSDMV. Cyclist fatality data comes from NYPD/DOT database. Both
data sets cover the period 2005-2009.
                                                1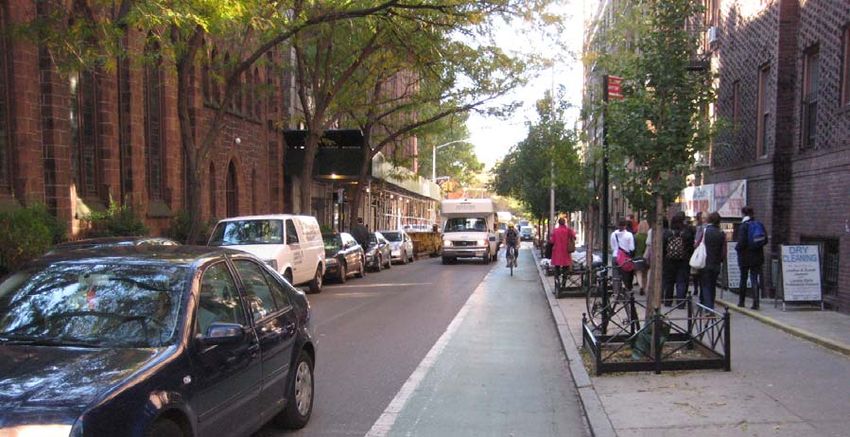
Pedaling into the 21st Century article “People shouldn’t have to use a gallon of
gasoline to get a quart of milk. Increased use of bicycling as a means of
transportation also will help protect the environment, reduce traffic congestion,
and develop more livable communities.”

                                         2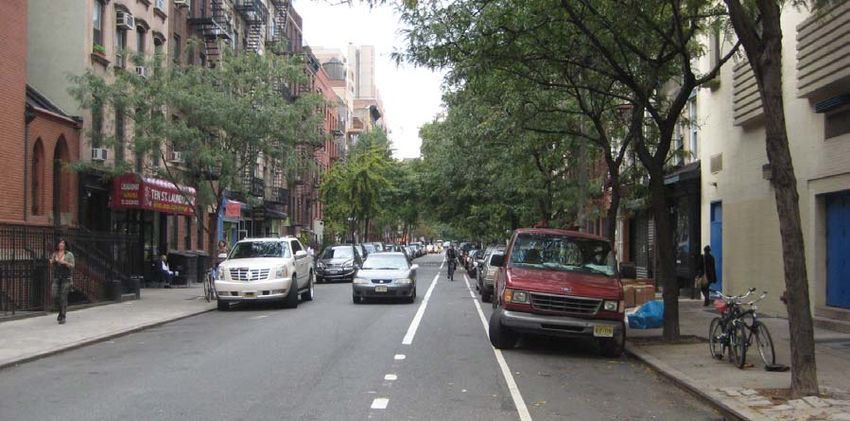
DESCRIPTION OF EXPERIMENTAL DEVICES
The “EVALUATION OF SOLID GREEN BICYCLE LANES TO INCREASE
COMPLIANCE AND BICYCLE SAFETY” project was approved by FHWA in May
2005. The project was designed to answer two questions:

   1. Does the use of the solid green marking prompt motorists to respect the
      bicycle lane (reducing encroachments) as well as be more aware of cyclists
      along the roadway?
   2. Does the solid green pavement marking increase bicycle use by providing a
      well-defined area for the bicyclist in the roadway?

Beginning in 2007, New York City Department of Transportation (NYCDOT) has
experimented with using green paint to demarcate curbside bike lanes in their
entirety. To date, green painted lanes have been used in 28 projects for a total of
18.4 lane miles in New York City. As discussed in the original project proposal, the
purpose of this experiment was to evaluate the effectiveness of solid green
pavement marking between the bicycle lane striping. It was anticipated that the
use of the solid green marking would prompt motorists to respect the bicycle lane
(reducing encroachments) as well as be aware of cyclists along the roadway. In
addition, the solid green pavement marking was expected to prompt greater
bicycle use by providing a well-defined area for the bicyclist in the roadway. NYC
Traffic Regulations prohibit cars from driving in bike lanes except when reasonable
and necessary to make turns or comply with NYPD instructions (Section 4-12 (p)).

As a result of coordination between the Bicycle Technical Committee (BTC) and the
Pavement Markings Technical Committee (PMTC) of the National Committee on
Uniform Traffic Control Devices (NCUTCD), the color green was identified as the
most likely color for this experiment. (In addition to common perception, the 2009
MUTCD defines the use of blue pavement markings for handicapped parking only
in Section 3A.05.

NYCDOT elected to use the Ride-A-Way Coating Material, manufactured by
Integrated Paving Concepts Inc., a "high performance premium coating material
consisting of epoxy, modified acrylic polymers blended with sand and aggregate."
StreetBond Colorant was added to provide color to the coating. Each lane
received 2 coats of the Ride-A-Way Coating Material. NYCDOT’s findings of the
paint are as follows:

                                         3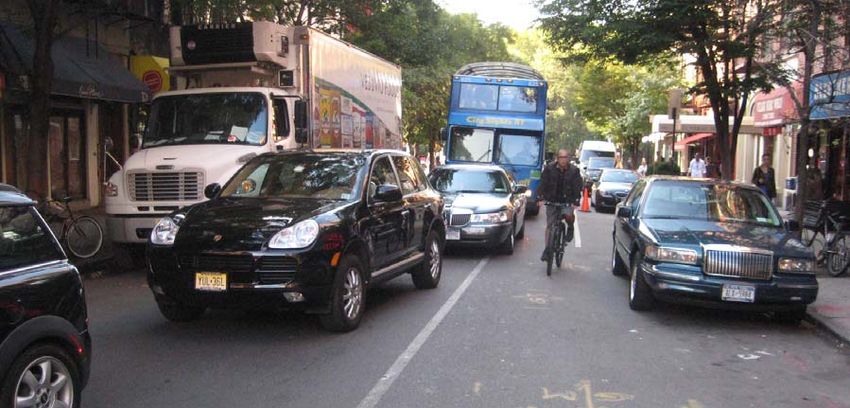
•   The paint does not cause the lane to become slippery when wet (0.5 friction
    factor)
•   It initially masks imperfections in the asphalt, but over time as the lane
    becomes dirty, imperfections become more pronounced and visible.
•   The shade shows up well at night under the street light illumination of the
    city’s high pressure sodium lamps.
•   Refurbishment is required approximately every 3 to 5 years.

                                      4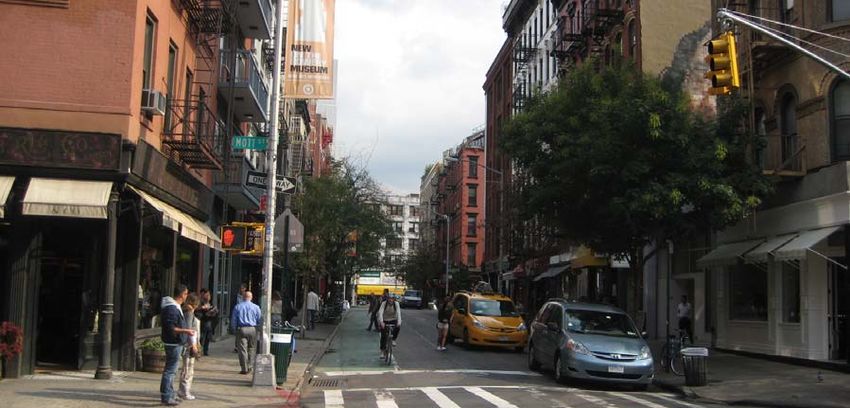
METHODOLOGY
To determine the impact of the solid green paint markings on driver and cyclist
behavior, NYCDOT staff observed driver and cyclist behavior along four green
paint treated curbside lanes and three standard bicycle lanes with white lane lines.
Traffic counts were conducted during the PM peak period (4pm-6pm) in
September of 2010.

Of the three control lanes, two are typical non-curbside bike lanes. The third,
Clinton St. in Brooklyn between Remsen and Montague Streets is one of the few
instances of a curbside bike lane that is not painted green. Due to the lack of
unpainted curbside lanes to use as a control, this report compares compliance
rates between green painted curbside bicycle lanes and non-curbside, unpainted
bicycle lanes. As neither lane style features a protective buffer (e.g. median
materials/plantings, barriers, repositioned parking lanes) NYCDOT believes that
these lane types are similar enough to warrant a meaningful comparison. While all
lane segments had similar land use characteristics, this study is unable to fully take
into account the potential traffic pattern and volume differences that may arise
from different land use and travel patterns.

NYCDOT surveyors noted both the total number of drivers and cyclists and the
drivers’ behavior and positioning on the road: standing in the bike lane, driving in
the bike lane, and driving on the bike lane line. In addition, surveyors noted drivers’
awareness of cyclists on the road by noting the percentage of time that the bike
lane was obstructed when cyclists were present.

Chart 1: EVALUATION OF SOLID GREEN BICYCLE LANES TO INCREASE COMPLIANCE AND
BICYCLE SAFETY-Study Locations
ID #     Street      Borough                     Extents                  Green Paint?

  1    Hoyt St       Brooklyn         State Street to Atlantic Avenue          Yes

  2    Clinton St    Manhattan      Delancey Street to Rivington Street        Yes

  3    Clinton St    Brooklyn          Hunts Lane to Remsen Street             Yes

  4    Prince St     Manhattan        Elizabeth Street to Mott Street          Yes

  5    Bleecker St   Manhattan           Leroy to Carmine Street               Yes

  6    Bleecker St   Manhattan       6th Avenue to MacDougal Street            No

  7    E 10th        Manhattan           1st Avenue to Avenue A                No

                                           5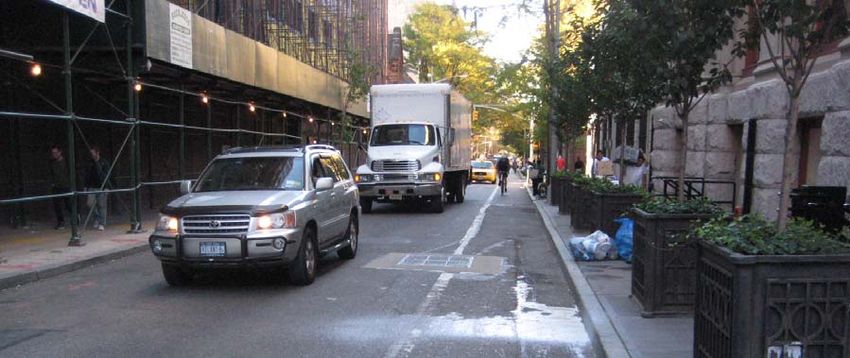
8   Clinton St   Brooklyn   Remsen Street to Montague Street   No

                                   6
Figure 1: Study Locations
7FINDINGS
Does the use of the solid green marking prompt motorists to respect the
bicycle lane (reducing encroachments) as well as be more aware of cyclists
along the roadway?
NYCDOT data indicates that the green paint treatment resulted in fewer instances
of drivers encroaching on the bike lane by driving on the bike lane boundary line.
Overall, 7% of drivers on the green paint treated streets drove on the bike lane
boundary line as opposed to 16% of drivers on streets with the typical non-painted
bike lane treatment. The data also showed fewer instances in driving in the bike
lane; on average, 4% of drivers drove in the bike lane on green paint treated
streets as opposed to 7% of typical streets. The frequency of standing or parking
in the bike lane between the two different paint treatments was comparable.
Driver behavior—the likelihood of drivers driving in the bike lane—did not seem to
be influenced by the presence of cyclists in either lane type. On average, cyclists
riding in the lane found it unobstructed in 96% of the cases on green paint treated
lanes as opposed to 93% of cases on the typical non-painted lanes.
A closer comparison of the two paired location sites, Clinton Street in Brooklyn,
(sites #7 & #3 on the study locations map fig. 1 ) and Bleecker Street in Manhattan
(sites # 5 & 6 on the study locations map fig. 1) suggests that the green paint may
increase awareness of bicycle infrastructure more significantly than the data
shows in aggregate.
The Clinton Street green painted curbside lane extends from Joralemon Street to
Tillary Street (0.3 lane miles) with a short unpainted gap between Remsen and
Montague Streets. Land use characteristics along this corridor are fairly uniform.
NYCDOT surveyors counted 881 vehicles and 117 cyclists at study location # 3
(painted) and 1,112 vehicles and 112 cyclists at location #8 (unpainted) one block
north. Cyclists make up 12% of the total traffic volume at location #3 and 9% of
the total traffic volume at location #8. 2
Over the study period, NYCDOT surveyors on Clinton Street reported that 1% of
2 Bicycle counts were conducted in September 2007 and September 2010 from 4-6pm on
weekdays. The before count was conducted on Clinton Street, Brooklyn, between Montague and
Pierpont (Pierrepont?) Streets, one block away from the 2010 count (location # 8).
8drivers at location #3 (painted) drove in the bike lane as opposed to 11% of
vehicles at location #8 (unpainted) one block north. An additional 7% of drivers at
location #3 drove on the bike lane line as opposed to 16% at location #8. On
Clinton Street, the green paint also seemed to also make drivers more aware of
cyclists; at location #3 the Clinton Street lane was clear in 98% of the times when
cyclists were in the lane as opposed to only 83% of the time at location #8.
The green paint treatment is featured on Bleecker Street from Hudson Street to
6th Avenue. Bleecker Street is unpainted east of 6th Avenue; the green paint
treatment resumes east of Lafayette Street. Land use characteristics along this
corridor are fairly uniform. NYCDOT surveyors counted 985 vehiclesand 177
cyclists at study location # 5 (painted) and 910 cars and 315 cyclists at location
#6 (unpainted) approximately two blocks east. Cyclists make up 15% of the total
traffic volume at location #5 and 26% of the total traffic volume at location #6.
On Bleecker Street, surveyors reported that 5% of drivers at location #5 (painted)
drove on the bike lane line as opposed to 15% of cars at location #6 (unpainted).
Does the solid green pavement marking increase bicycle use by providing a
well-defined area for the bicyclist in the roadway?
The unprecedented growth in cycling in New York City over the past four years
makes it difficult to evaluate the second question, the impact of the green paint
markings alone on bicycle use. For example, cycling on Clinton Street, Brooklyn
(location # 8) increased by 58% from September 2007 to September 2010.3
However, commuter cycling in New York grew 321% from 1999-2009, with
much of that growth occurring since 2006 when the City began its 200-lane-mile
commitment to expand the existing cycling network. Commuter cycling has
increased by 26% from 2008 to 2009 and more than doubled since 2005. While
the green paint lanes are likely to be a factor in this growth, this report cannot
separate their impact from the growth of the cycling network as a whole.
Anecdotally, most cyclists like the green paint treatment and believe that it is more
effective at keeping cars from parking in bike lanes than regular striping. In
particular, cyclists cite the conspicuousness of cars parked in green painted lanes
as a deterrent to drivers parking there.
3 Bicycle counts were conducted in September 2007 and September 2010 from 4-6pm on
weekdays. The before count was conducted on Clinton Street, Brooklyn, between Montague and
Pierpont (Pierrepont?) Streets, one block away from the 2010 count (location # 8).
9CONCLUSIONS
The data collected by NYCDOT suggests that the green paint treatment can
enhance bike lane visibility and limit instances of drivers driving in the bike lane or
on the dividing line. Drivers were less likely to drive on the bike lane line by an
average of 9 percentage points if the lane was painted green than if it was not
painted. Driver behavior—the likelihood of drivers driving in the bike lane—
remained essentially constant in both lane types regardless of the presence of
cyclists. On average, cyclists found the bike lane clear 93%-95% of the time.
Significant increases in cycling in New York City over the past decade make it
impossible to determine the exact impact of green painted lanes on cycling rates.
Commuter cycling in New York City has increased by 26% from 2008 to 2009
and more than doubled since 2005. While the green paint lanes are likely to be a
factor in this growth, this report cannot untangle their impact from the growth of
the cycling network as a whole.
Overall, the green painted lanes have contributed to general increases in cycling
rates and safety in New York City. As cycling in New York City has increased,
cyclist injuries and fatalities have fallen steadily. Cyclist injuries fell 44 percentage
points from 1999 to 2008. Cyclist fatalities have fluctuated but trended
downward during the same period. This increase in ridership and safety is
concurrent with the installation of green painted lanes and overall expansion of the
city’s bicycle network.
10Chart 2: EVALUATION OF SOLID GREEN BICYCLE LANES TO INCREASE COMPLIANCE AND BICYCLE
SAFETY-Findings
Lane is clear
when cyclist
Driver Behavior present?
On Bicycles
Standing bike In as % of
in bike Driving in lane travel all
ID # Cyclists Cars lane bike lane line lane Yes No vehicles
Green Paint
1 Hoyt Street (BK) 142 518 0% 1% 6% 93% 98% 2% 22%
2 Clinton Street (MN) 152 1,266 1% 9% 9% 81% 88% 13% 11%
3 Clinton Street (BK) 117 881 0% 1% 7% 92% 98% 2% 12%
4 Prince Street (MN) 212 362 1% 2% 10% 87% 98% 2% 37%
5 Bleecker Street (MN) 177 985 0% 2% 5% 93% 97% 3% 15%
- All Green 623 3,027 1% 4% 7% 89% 96% 4% 17%
Unpainted
6 Bleecker Street (MN) 315 910 0% 1% 15% 84% 100% 0% 26%
7 E.10th Street (MN) 199 415 2% 7% 20% 71% 89% 11% 32%
8 Clinton Street (BK) 112 1,112 0% 11% 16% 72% 83% 13% 9%
- All Unpainted 626 2,437 1% 7% 16% 76% 93% 13% 20%
All data collected in September, 2010 during the PM rush (4pm-6pm)EVALUATION OF SOLID GREEN BICYCLE LANES TO INCREASE COMPLIANCE AND BICYCLE SAFETY:
Study Locations
1Figure 2: Existing Green Lanes
2Study Location #1: Hoyt Street, Brooklyn Extents: State Street to Atlantic Ave. Study Location #2: Clinton Street, Manhattan Extents: Delancey Street to Rivington Street
Study Location #3: Clinton Street, Brooklyn
Extents: Hunts Lane to Remsen Street

Study Location #4: Prince Street, Manhattan
Extents: Elizabeth Street to Mott Street

                                      1
Study Location #5: Bleecker Street, Manhattan
Extents: 6th Ave. to MacDougal Street)
Study Location #6: East 10th Street, Manhattan
Extents: 1st Ave. to Ave. A
2Study Location #7: Clinton Street, Brooklyn
Extents: Remsen Street to Montague Street
3RELATED FINDINGS
Commuter cycling rates in New York City have risen dramatically over the past
decade, a 321% increase from 1999 to 2009. Commuter cycling increased by
26% between 2008-2009 and more than doubled since 2005. Concurrent with
this increase in commuter cycling, cyclist injuries and fatalities have fallen steadily.
Cyclist injuries fell 44 percentage points from 1999 to 2008. Cyclist fatalities
have fluctuated but trended downward during the same period. Much of the
growth in cycling occurred since 2006 when NYCDOT began implementing its
ambitious plan to install 200 lane miles of bicycle network in three years and
complete the city’s Bicycle Master Plan by 2030.
NYC Cycling Growth vs. Injuries
350
300
250
% Change
200 Cyclist Injuries
150 Cyclist Fatalities
100
Commuter Cycling
Indicator
50
0
99
00
01
02
03
04
05
06
07
08
09
19
20
20
20
20
20
20
20
20
20
20
Figure 3: Cycling Growth vs. Injuries & Fatalities (Data from NYCDOT & NYSDOT)
The City of Portland, Oregon has experimented with colored markings at bicycle-
motor vehicle crossings. The results of their experiments are contained in the
Document “Portland’s Blue Bike Lanes – Improved Safety through Enhanced
Visibility”, City of Portland Office of Transportation July 1, 1999. The conclusions
included in this report indicated, among other results, statistically significant
increases in motorists yielding to cyclists and an increase in motorists slowing or
stopping when approaching conflict areas4.
4 City of Portland Office of Transportation, “Portland’s Blue Bike Lanes – Improved Safety through
Enhanced Visibility”, July 1, 1999 p. 20.
4You can also read