Evolution of Cooperation between Public and Private Healthcare Providers with Patients: An Agent-based Simulations Study - UCL
←
→
Page content transcription
If your browser does not render page correctly, please read the page content below
Evolution of Cooperation between Public and Private Healthcare
         Providers with Patients: An Agent-based Simulations Study
                            Zainab Alalawi1 , The Anh Han 1 and Yifeng Zeng2
               1
                   School of Computing, Engenering & Digital Technologies, Teesside University, UK
                   2
                     Department of Computer and Information Sciences, Northumbria University, UK
                      Emails: {z.alalawi, t.han}@tees.ac.uk and yifeng.zeng@northumbria.ac.uk

                         Abstract                            consisting of different healthcare providers interact-
                                                             ing with patients. Our investigation examines individ-
  Few studies have been carried out to investigate the       ual agents’ behaviors as viewed by an external poli-
  Patient’s involvement in the decision-making process       cymaker, in this case, the Health Department. Gener-
  in the healthcare system. Here, we perform ad-             ally, policies are initiated and managed by the Health
  vanced analysis as a follow up to our previously de-
  veloped mathematical healthcare business model in-         Department, which allocates a specific budget to in-
  volving three populations. The advanced model con-         terfere.
  tributes to healthcare economic modelling by ana-             To this end, our analysis here is carried out based
  lyzing the stochastic cooperation behavior of agents       on a baseline model we developed in (Alalawi et al.,
  within three proposed populations: Public Healthcare
                                                             2019). This previous work focuses on numerical anal-
  Providers, Private Healthcare Providers and Patients.
  By employing agent-based simulations and methods           ysis of the proposed healthcare model, studying evo-
  from Evolutionary Game Theory (EGT), we study co-          lutionary dynamics of three well-mixed finite popu-
  operation outcomes within each population. We study        lations. The analytical approach we adopted therein
  the effect of increasing mutation or behavioural ex-       relied on the assumptions of rare behavioral mutation
  ploration rate and that of unequal population sizes of
                                                             by the agents, and that all populations having an equal
  healthcare providers and patients. We show that the
  former introduces more randomness in agents’ behav-        size. Our finding shows that agents from all three pop-
  iors enabling cooperation to emerge in more difficult      ulations tend to not cooperate (i.e. defect) (Alalawi
  conditions. We also find that, when the Providers’ ca-     et al., 2019). While these simplified assumptions al-
  pacity is limited (i.e., small population size), the Pa-   lowed us, as a very first step, to provide clear math-
  tients exhibit lower levels of cooperation, implying a
                                                             ematical analysis, they prevented us from analysing
  more difficult cooperation dilemma that needs solving.
                                                             some important factors. Namely, mutation or behav-
                                                             ioral exploration, where agents can freely experiment
                                                             with new behaviors, has been shown to play an im-
                     Introduction                            portant role in enabling cooperation in the context of
The healthcare system in the UK is regulated by the          social dilemmas (Duong and Han, 2019; Antal et al.,
Department of Health where explicit rules, activi-           2009; Traulsen et al., 2009; Han et al., 2012). As the
ties and mechanisms are imposed and enforced by              world is facing a rapid increase in populations, most
the state to manage social behavior (Saltman, 2002).         healthcare capacity is struggling to cope with atten-
From the perspective of UK health policy, the ten-           dant mounting demand and to accommodate growing
dency is to understand an incentive as an economic           populations’ needs. Moreover, some scholars have
inducement or benefit, whether tangible or intangi-          warned that, in reality, healthcare providers might not
ble, resulting from a behavior that impacts the perfor-      be able to meet the treatment demand from all patients
mance of the healthcare system, whether positively or        (Ewbank et al., 2020). It is, therefore, viable to in-
negatively. This narrow definition tends to exclude          vestigate this intensifying trend and study the ratio of
non-monetary incentives or benefits (Grant, 2003;            population to hospital bed availability. Currently in
Saltman, 2002). This dilemma can be solved pragmat-          England, UK, the number stands at 474 patients per
ically by the introduction of Evolutionary Game The-         hospital bed 1 .(Office for National Statistic, 2020)
ory (EGT). EGT provides various examples that can               Therefore, in this paper, we develop agent-based
be followed such as the Public Goods Game (PGG)
where individuals can get a share of the benefits of            1
                                                                  England population number was obtained from Office
cooperation equivalent to their collective contribution      for National Statistic ONS (correct as of mid-2019), avail-
to upholding the process (keep it going).                    able at:https://bit.ly/2MCb3yc. The number of hospital beds
                                                             in England (correct as of 2018/9) was calculated based on
   In this research, we investigate the evolution of co-     data provided by the King’s fund report “NHS hospital bed
operation in a complex system, namely the healthcare         numbers: past, present, future”: https://bit.ly/2UfgeZ0; (ac-
system in England, which is made up of populations           cessed 6 June 2020).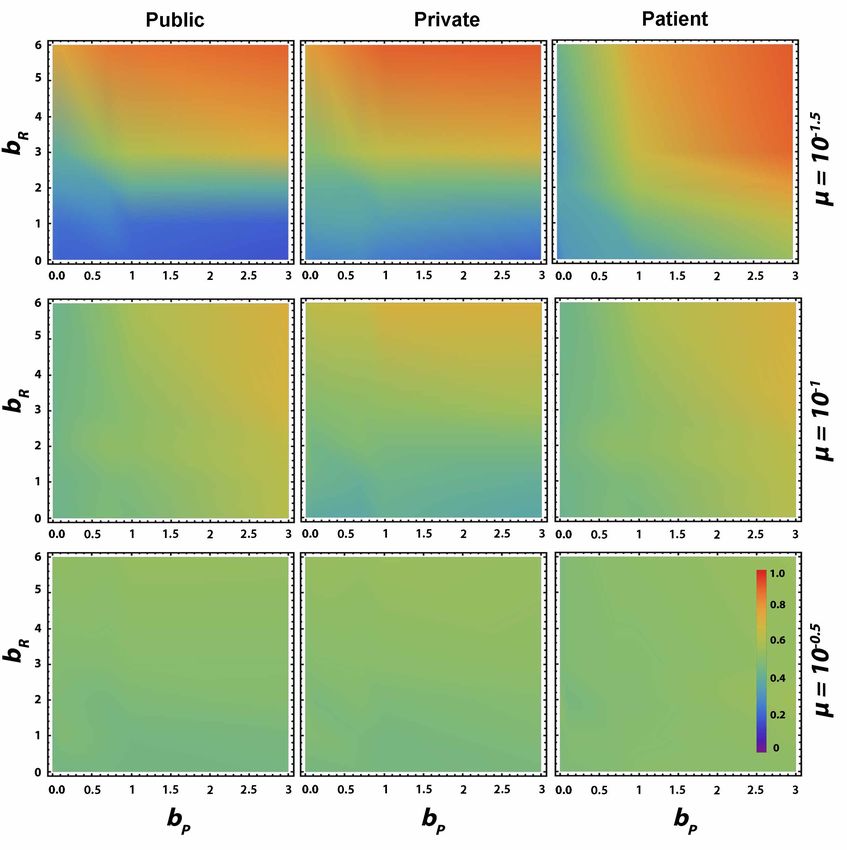
simulations of this baseline model to investigate how      Parameters' description                       Symbol
relaxing the above-mentioned assumptions affects the       Reputation benefit for the Public and           bR
cooperation outcomes in providers’ and patients’ pop-      Private healthcare providers
ulations. Namely, we seek to develop a more in-            Patient's benefit                              bP
sightful understanding of the dynamical behavior of        Cost of investment spent by the Pub-           cI
agents in each population, the effects of applying a       lic/Private healthcare provider
large mutation/exploration rate on the abundance of        Cost of treatment acquired by the               cT
cooperation, and the influence of reduced sizes of the     healthcare provider
healthcare providers’ population on the agent’s behav-     Cost of healthcare management                  cM
ior within the dynamic system and their population.        Extra Patient's benefit when both               ε
   The rest of this paper is structured as follows. Re-    providers cooperate
lated Work section reviews the most relevant litera-
ture. Model and Methods section presents our health-       Strategies                    Payoffs
                                                           P1 P2 P3       Public        Private        Patient
care model and methods applied. Results and Discus-
                                                           C C C          bR −cI −cT    bR −cI −cM     bP + εbP
sion section discusses agent-based simulation results.
                                                           C C D          −cI           −cI            0
The conclusion summarises our findings and explores        C D C          bR −cI −cT    0              bP
their implications for future work.                        C D D          −cI           0              0
                                                           D C C          0             bR −cI −cM     bP − c T
                  Related Work                             D C D          0             −cI            0
                                                           D D C          0             0              −cT
Researchers eager to understand the behavior of dif-       D D D          0             0              0
ferent agent representations within the healthcare sys-
tem use AI (Ziuziański et al., 2014), game the-          TABLE 1: The healthcare model (Public: P1, Private:
ory (Agee and Gates, 2013; Wu et al., 2016), mul-         P2, Patient: P3).
tiagents system (De and Gelfand, 2017) and big
data (Murdoch and Detsky, 2013) which are used
to predict and understand behaviors within systems.       or the public healthcare providers, P2 represents in-
However, little effort has been made to study the dy-     dependent healthcare providers P2 selling healthcare
namics of cooperation and other decision making in        services, and P3 represents those who seek personal
the healthcare domain, which usually involves differ-     treatments. Agents from each population (P1, P2 and
ent actors in the decision making processes. Our pre-     P3 can choose from two strategies: provide/accept
vious work (Alalawi et al., 2019) and this work aim to    sustainable treatment identified as cooperating, other-
bridge this important gap by resorting to population-     wise the game will be dominated by alternative treat-
based methods from EGT to develop an understand-          ments from other providers. On each game encounter
ing of the dynamics of cooperative behaviour in this      or iteration, an agent's payoff is acquired based on
domain.                                                   the strategy played by each agent/individual from the
   The rapid development in research on the learning      three populations. In this game, an interaction hap-
of social behavior has significantly increased our un-    pens among three agents, one from each of the three
derstanding of the dynamic interaction among indi-        populations, see Table 1.
viduals from different populations (Sigmund, 2010).          An agent in each of the three populations has two
Cooperation is one of the fundamental aspects to          strategies, cooperate (C) and defect (D). Here the
measure the strength and dynamism of a popu-              strategy coincides with the action of an agent, despite
lation (Smith, 1974; Kurokawa and Ihara, 2009;            the fact that there is only one decision to make, which
Encarnação et al., 2016). It can be studied by apply-   can be interpreted as follows.
ing EGT to different mechanisms, such as reciprocal       Public healthcare providers:
behaviors, kin selection and costly incentives (Sig-
                                                          • C: offers treatment paid for from taxpayers' money,
mund, 2010; Hofbauer and Sigmund, 1998). EGT has
                                                            which consists of paying a cost cI , and in return
been successfully used across major scientific fields
                                                            gets a reputation benefit.
such as biology, ecology, economics, psychology and
mathematical computation (Sigmund, 2010; Hofbauer         • D: does not want to pay for the treatment.
and Sigmund, 1998).
                                                          Private healthcare providers:
              Model and Methods
                                                          • C: offers treatment either paid by Public (when
Healthcare Model                                            Public cooperates) or self-paid by Patient (so the
In this section, we summarise the model presented           main cost involved is management cost cM ), and
in (Alalawi et al., 2019), where we consider three          obtains a reputation benefit bR . In case of cooper-
populations: Public providers P1, Private providers         ation with the Patient, Private commits to investing
P2 and Patients P3. While P1 represents the NHS             cI from its revenue.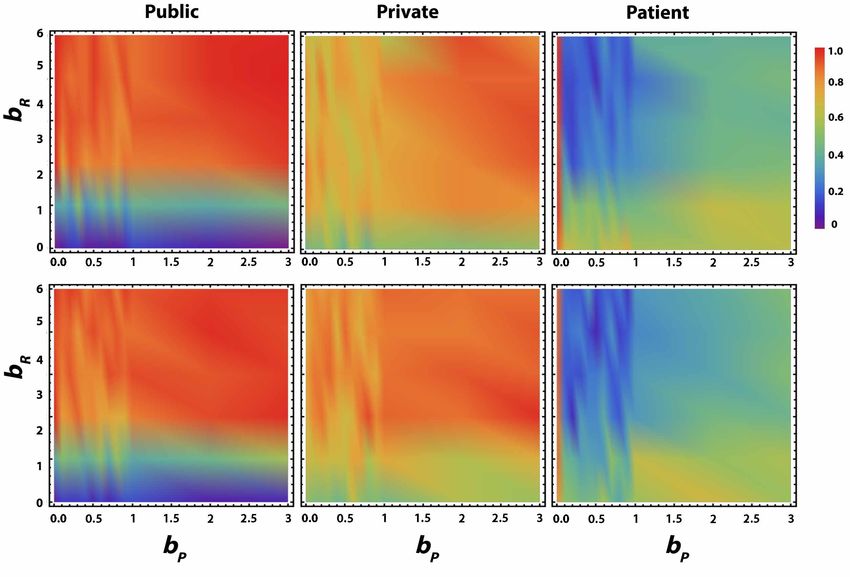
• D: does not want to offer the treatment.
Patient:
• C: accepts being treated and pays for the treat-
ment cT when treated by the Private; Patient ob-
tains health benefit bP if at least one provider coop-
erates and extra health benefit when both providers
cooperate ε.
F IGURE 1: The cooperation level in each of the three
• D: rejects the treatment and looks for alternative populations as a function of the sectors’ benefit bR and
treatment mostly overseas, where above conditions patient’s benefit bP . Other parameters: cI , cT , cM =
are correct, and: bP > 0, ε > 0 and cT > 0. 1; N1 , N2 , N3 = 100; ε = 0.2; µ = 10−4 ; β = 0.1.
Thus, given the strategies of players in each popu-
lation, there are 8 possible strategic combinations or where β > 0 represents the ‘intensity of selection’or
scenarios, represented by XYZ where X, Y, Z can be ‘imitation strength’; β = 0 represents neutral drift
either C or D. We summarize a few of them below where imitation decision is random, while for β → ∞
(full details can be found in (Alalawi et al., 2019)) the imitation decision is increasingly deterministic.
• CCC: individuals from all three populations choose When mutation or behavioral exploration (Gokhale
to cooperate. The Public pays for the treatment and Traulsen, 2010; Duong and Han, 2019) is not rare
provided by a Private healthcare provider and the (which is different from the analysis in (Alalawi et al.,
Patient accepts the provided treatment in pursuit 2019)), we consider that, before A considers to imitate
of her/his own benefit or well-being. The Public, B, with a probability µ, it changes to a randomly se-
which bears the costs of investment and pays for the lected strategy from its behavioural space (in this case,
Patient's treatment (cI + cT ), covered from its allo- C or D). That is, with probability (1 − µ) A considers
cated budget, gains a reputation benefit bR . Rep- to imitate B as above.
utation benefits are derived from the Patient's sat- Individuals in each population have the choice to
C or to D in a paradigm shift fashion. As described
isfaction with the provided service. On the other above, there are eight possible paradigms or scenarios
hand, the Private healthcare provider will provide corresponding to the the eight possible combinations
the required treatment to the Patient and receive of the strategies within the three populations: CCC,
the payment covering the costs from the Public. CCD, CDC, CDD, DCC, DCD, DDC, DDD. Denot-
The cost of investment cI of the Private healthcare ing the numbers of cooperators in P1, P2 and P3 by
x, y, and z, respectively, the payoff of each strategy
provider is to invest in staffing and healthcare fa- can be written as follows:
cilities, while cM refers to administrative and op-
erational costs. Also, the Private provider will ob- PsP ublic (x, y, z) = Psyz
tain a reputation benefit with the Public bR . Pa- PsP rivate (x, y, z) = Pxsz Pairwise comparison (2)
PsP atient (x, y, z) = Pxys
tient gets extra health benefit εbP as both healthcare
providers are cooperating (ε represents a synergis- where Pxyz is the payoff for the strategy selected by
tic factor). individuals from one of the stated populations, and
• DDD: this scenario consists of all three agents (x,y,z) represents the selected strategies C or D. For
choosing not to interact with one another, thus all instance, individuals from P1 have the options to play
the agents get a zero payoff. C or D. The selected strategy will replace the s at x
vertex, while y and z vertices remain unchanged for
Method: Evolutionary Dynamics for Three selected strategies for the Public population in this in-
Populations stance.
EGT method is adopted to study the evolutionary dy-
P ublic → f (Cyz) > PDyz
namics and interactions among individuals from three
P rivate → f (xCz) > PxDz (3)
distinct finite populations: P1, P2 and P3. The pop-
P atient → f (xyC) > PxyD
ulations are of fixed sizes N1 , N2 and N3 , respec-
tively. In each time step, from a randomly selected
population, a randomly selected individual A with fit- Agent-based Simulations
ness fA imitates another randomly selected individual As mutation is not rare, we perform agent-based sim-
B with fB fitness using the pairwise comparison rule, ulations to study the evolutionary dynamics. Initially,
a popular and standard approach to implementing so- agents in the three populations are given a random
cial learning in EGT (Sigmund, 2010; Traulsen et al., strategy (C or D). In each generation or time step,
agents’ fitness is calculated as in Table. 1. Namely, the
2007). Namely, the probability ρ that A adopts B's fitness of an individual adopting a strategy s within a
strategy is given by the Fermi's function population is derived from the average obtained from
−1 the tripartite one-shot game described in Table 1. A
ρ = [1 + e−β[fB −fA ] ] , (1) randomly selected individual in each game obtains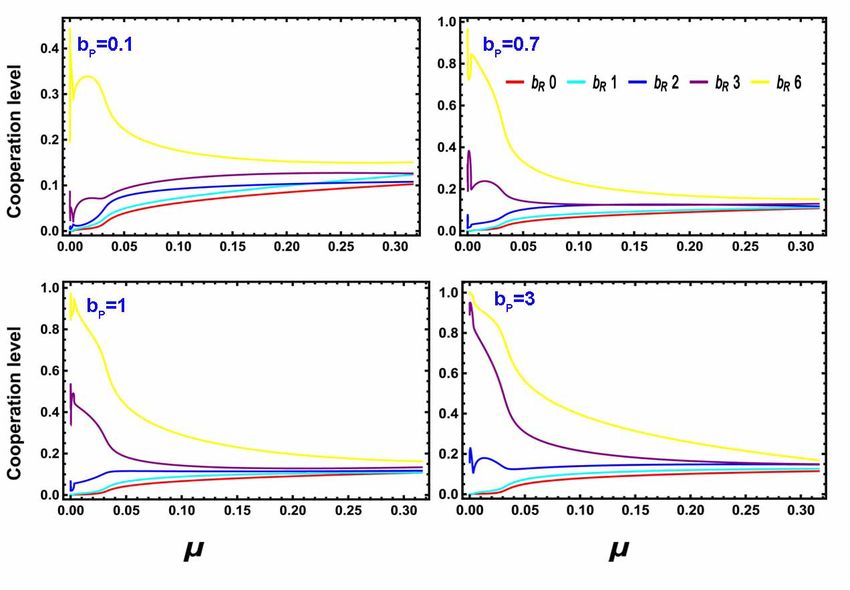
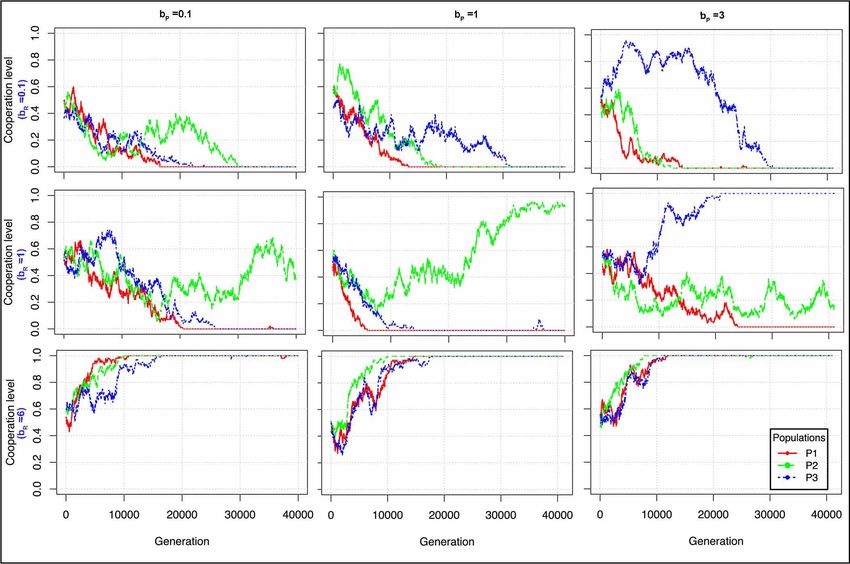
F IGURE 2: Typical simulation runs showing the cooperation levels over time in the three populations (red for
Public, blue for Private and green for Patient). The plots represent the frequency of cooperation adopted by the
populations for different values of bR and bP . Other parameters as in Figure 1.

an average payoff given by (Encarnação et al., 2016;             Figure 1 shows the cooperation levels adopted in
Santos et al., 2016):                                           the populations for varying the sectors’ benefit bR and
                           P ublic
  fSP ublic (x, y, z) = yzPSCC                P ublic
                                   + (1 − y)zPSDC     +         patient’s benefit bP . In general, cooperation in all
             P ublic                P ublic
y(1 − z)PSCD + (1 − y)(1 − z)PSDD ,                             populations is most abundant when both benefits are
  fSP rivate (x, y, z) =    xzPCSC P rivate + (1 −              sufficiently large. The two sectors have similar coop-
      P rivate
x)zPDSC                 P rivate
               +x(1−z)PCSD                   P rivate
                                 +(1−s)(1−z)PDSD      ,         eration for the whole parameter space, except when
                                                                both benefits are small, where the private sector has a
                             P atient
  fSP atient (x, y, z) = xyPCCS                    P atient
                                      + (1 − x)yPDCS        +   slightly higher level of cooperation.
            P atients                     P atient
x(1 − y)PCDS          + (1 − x)(1 − y)PDDS ,                       To better understand the detailed dynamics, in Fig-
                                                                ure 2 we show the evolution of cooperation over time
   where fSP (x, y, z) represents agents’ average pay-          in each population for different combinations of the
off in a population P while adopting strategy s, as-            benefits. Indeed, we can see that when bR is large
suming that the population is present in the vertices           (see bR = 6, bottom row), all the three populations
            S
(x,y,z). PABC     denotes the payoff that an individual         quickly converge to full cooperation even for small
playing in a group with a strategy profile derives from
state S where public plays A, private plays B and pa-
tient plays C . These payoffs are shown in Table 1.
   Each simulation of the stochastic modelling runs
for a number of generations (at least 40,000), where a
stable state is reached in general (see examples in Fig.
2). To ensure accuracy, the accumulated results are
then averaged over the last 100 time steps, and further-
more, for each parameter configuration, the results
were averaged over 50 independent realisations. As
mutation is adopted in the simulations, no absorbed
monomorphic state is reached .

             Results and Discussion
In this study we conduct agent-based simulations (see
Methods), where agents from the three populations               F IGURE 3: Frequencies of CCC for increasing mu-
P1, P2 and P3 interact in a one-shot game and learn             tation rate, µ. It represents the trends of different bR
how they influence the level of cooperation to sustain          values for the stated value of bP on each plot. Other
cost-effective services and better patient satisfaction.        parameters as in Figure 1.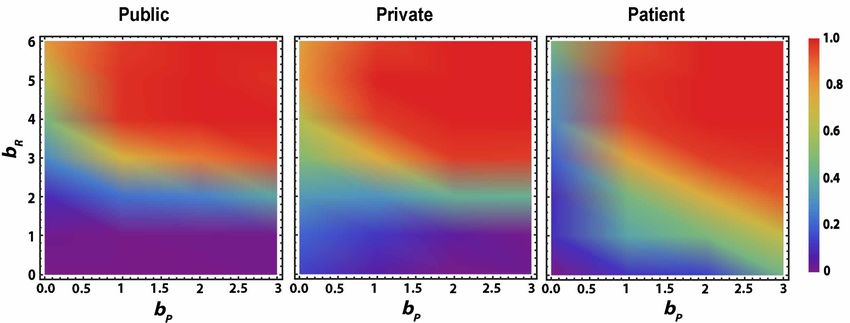
F IGURE 5: Cooperation levels in each population
                                                          based on the ratio of hospital bed availability pro-
                                                          vided by healthcare providers compared to the size of
                                                          the P3 population(N3 =100). Where the size of the
                                                          P1/P2 is: first row N1 = N2 = 10 and second row
                                                          N1 = N2 = 5). Other parameters as in Figure 1.
F IGURE 4: Cooperation levels in three populations
for different values of µ. First column for P1, second
column for P2, and third column for P3. µ values are      the values of the benefits, which is when all popula-
as specified on the right side. Other parameters as in    tions converge to 50% cooperation.
Figure 1.
                                                          The effect of unequal population sizes
                                                          In reality, the availability of hospital beds is very lim-
bP . For intermediate bR (see bR = 1, middle row), P1     ited for the increasing number of patients; i.e: winter
converges to defection, while P2 still maintains some     long waiting time in A&E or in a pandemic (e.g. as
level of cooperation and P3 have high levels of coop-     is the case with the COVID-19). We study the ef-
eration when bP is large (i.e. equals 3). When bR is      fect of this factor by looking at different providers’
small, all populations converge to defection. That is,    population size ratios to that of the Patient’s popula-
P2 population is more willing to cooperate with P3        tion. Fig. 5 shows simulation results for two different
for quite low bP (where bP ≤ 1 and bR ≤ 1). On the        providers’ sizes, 10 & 5. The results reveal that P2
other hand, P3 requires better reputation benefit bR to   cooperates more with lower providers’ and patients’
cooperate with P3 and provides the desired services.      benefits. Whereas the P1 population still prefers to
As a consequence, P3 has to pay extra cost equiva-        cooperate with higher reputation benefit bR . Con-
lent to cT as represented in Table 1, i.e: DCC for the    versely, P3 shows a significantly different behavior in
Patient’s payoff (bP − cT ) compared to the other sce-    the decision making process by defecting upon low
narios, CCC or CDC, where the cost equals zero.           health benefit 0.1 < bP < 1 and willing to cooper-
                                                          ate when bP < 0.1 and bP ≥ 1 for larger providers’
The effect of mutation                                    population sizes.
We now study how increasing the mutation rate µ              These observations show that, in a more realistic
affects the cooperation outcome in each population.       setting where both P1 and P2 usually have a lower
Note that so far we consider rare mutation or low mu-     capacity than what is required by P3, it is more diffi-
tation rate µ = 10−4 , recovering results from our pre-   cult to ensure cooperation from the patients. That is,
vious work using small mutation dynamics (Alalawi         the cooperation issue is more severe, which therefore
et al., 2019). Fig. 4 shows results for higher mutation   requires additional supporting mechanisms such as in-
rates, namely, µ = 10−k , with k = 1.5, 1 and 0.5.        centives to maintain cooperation. We are currently
As expected, as larger mutation leads to greater levels   studying this important setting.
of randomness in agents’ behaviors, we observe more
defection in scenarios where cooperation is abundant                    Concluding Remarks
(high benefits), and vice versa, i.e. more cooperation    We have studied cooperation outcomes and evolution-
in previous scenarios with abundant defections. Inter-    ary dynamics of a three-population healthcare model
estingly, for intermediate µ (µ = 10−1 ), P1’s coop-      using extensive agent-based simulations. We analyze
eration mostly depends on P3’s benefit, while P2 is       cooperation outcomes for incremental rate of muta-
more dependent on the reputation benefit. This obser-     tion, and compare them with those when it is rare, as
vation can also be seen in Fig. 3, where we plot the      reported in our previous work. This result can rep-
frequency of CCC. For sufficiently large µ, the fre-      resent realistic scenarios derived from some elective
quency of CCC always converges to 1/8 regardless of       treatments such as hip replacements (Moscelli et al.,
2016). To link our model to realistic scenarios it will Gokhale, C. S. and Traulsen, A. (2010). Evolutionary games in
make use of data published by the NHS and comple- the multiverse. Proceedings of the National Academy of
Sciences, 107(12):5500–5504.
mented with figures obtained from the Patient Reports
Outcome Measures (NHSDigital, 2019) and the Care Grant, J. (2003). Incentives for Reform in the NHS: An as-
Quality Commission (CQC, 2019). sessment of current incentives in the south-east London
health economy - Jenny Grant - The King’s Fund, 29th
We found abundance of cooperation closely linked September 2005. Technical report, The king’s fund.
with high benefits. Interestingly, for sufficiently high
mutation rates, more cooperation also emerged in sce- Han, T. A., Pereira, L. M., and Santos, F. C. (2012). The
emergence of commitments and cooperation. In Proceed-
narios that are previously dominated by defection in ings of the 11th International Conference on Autonomous
all populations. Agents and Multiagent Systems (AAMAS’2012), pages
We explored the influence of reducing the size of 559–566. ACM.
the healthcare provider population on cooperation be- Hofbauer, J. and Sigmund, K. (1998). Evolutionary games and
tween the three populations. We compared the results population dynamics. Cambridge university press.
of two different healthcare provider population sizes
Kurokawa, S. and Ihara, Y. (2009). Emergence of cooperation
(10 & 5) providing medical services to 100 patients. in public goods games. Proceedings of the Royal Society
We found that the Patient is less likely to cooperate of London B: Biological Sciences, 276(1660):1379–1384.
(small abundance) when the Provider populations are
Moscelli, G., Gravelle, H., Siciliani, L., et al. (2016). Market
small, which means that providers have a limited ca- structure, patient choice and hospital quality for elective
pacity to accommodate the patients’ needs. This find- patients. Technical report, Centre for Health Economics,
ing reveals a critical cooperation problem that needs University of York.
to be resolved. We plan to explore new mechanisms Murdoch, T. B. and Detsky, A. S. (2013). The inevitable ap-
to improve cooperation in this important and realistic plication of big data to health care. Jama, 309(13):1351–
setting, such as via positive or negative incentives in 1352.
the form and institutional rewards and punishments. NHSDigital (2019). Finalised Patient Reported Outcome
Measures (proms) in England for Hip and Knee Re-
References placement Procedures (April 2017 to March 2018).
https://bit.ly/2J3Rq2h.
Agee, M. D. and Gates, Z. (2013). Lessons from game theory
about healthcare system price inflation. Applied health Office for National Statistic (2020). Population estimates for
economics and health policy, 11(1):45–51. the UK, England and Wales, Scotland and Northern Ire-
land, provisional: mid-2019.
Alalawi, Z., Han, T. A., Zeng, Y., and Elragig, A. (2019). Path-
ways to good healthcare services and patient satisfaction: Saltman, R. B. (2002). Regulating incentives: the past and
An evolutionary game theoretical approach. In The 2019 present role of the state in health care systems. Social
Conference on Artificial Life: A Hybrid of the European Science & Medicine, 54(11):1677–1684.
Conference on Artificial Life (ECAL) and the Interna-
tional Conference on the Synthesis and Simulation of Liv- Santos, F. P., Encarnação, S., Santos, F. C., Portugali, J.,
ing Systems (ALIFE), pages 135–142. MIT Press. and Pacheco, J. M. (2016). An evolutionary game the-
oretic approach to multi-sector coordination and self-
Antal, T., Traulsen, A., Ohtsuki, H., Tarnita, C. E., and Nowak, organization. Entropy, 18(4):152.
M. A. (2009). Mutation-selection equilibrium in games
Sigmund, K. (2010). The calculus of selfishness. Princeton
with multiple strategies. Journal of theoretical biology,
University Press.
258(4):614–622.
Smith, J. M. (1974). The theory of games and the evolu-
CQC (2019). Care Quality Commission for All Healthcare ser- tion of animal conflicts. Journal of theoretical biology,
vices in the UK. https://bit.ly/2VkFKyx. 47(1):209–221.
De, Soham; Nau, D. S. and Gelfand, M. J. (2017). Under- Traulsen, A., Hauert, C., De Silva, H., Nowak, M. A., and Sig-
standing norm change: An evolutionary game-theoretic mund, K. (2009). Exploration dynamics in evolutionary
approach. In Proceedings of the 16th Conference on Au- games. Proceedings of the National Academy of Sciences,
tonomous Agents and MultiAgent Systems, pages 1433– 106(3):709–712.
1441. International Foundation for Autonomous Agents
and Multiagent Systems. Traulsen, A., Pacheco, J. M., and Nowak, M. A. (2007).
Pairwise comparison and selection temperature in evolu-
Duong, M. H. and Han, T. A. (2019). On equilibrium prop- tionary game dynamics. Journal of theoretical biology,
erties of the replicator–mutator equation in deterministic 246(3):522–529.
and random games. Dynamic Games and Applications, Wu, C.-K., Chen, Y.-M., and Wu, D. (2016). A game theory
pages 1–23. approach for deploying medical resources in emergency
department. In Game Theory and Applications, pages 18–
Encarnação, S., Santos, F. P., Santos, F. C., Blass, V., Pacheco, 30. Springer.
J. M., and Portugali, J. (2016). Paradigm shifts and the
interplay between state, business and civil sectors. Royal Ziuziański, P., Furmankiewicz, M., and Sołtysik-
Society Open Science, 3(12):160753. Piorunkiewicz, A. (2014). E-health artificial intelli-
gence system implementation: case study of knowledge
Ewbank, L., Thompson, J., and McKenna, H, a. S. A. (2020). management dashboard of epidemiological data in
NHS hospital bed numbers: past, present, future. the poland. International Journal of Biology and Biomedical
Kings Fund. Engineering, 8:164–171.You can also read