The sero-conversion of the people of the Nelson Mandela metropole, 1985-2021
←
→
Page content transcription
If your browser does not render page correctly, please read the page content below
The sero-conversion of the people of the Nelson Mandela metropole

  The sero-conversion of the people of the Nelson Mandela
                  metropole, 1985-2021

                          RCH Shell & P Rama
             Population Research Unit, East London Campus
                           Rhodes University

Abstract:
      The authors draw attention to the little researched pandemic of HIV/AIDS
    in the Western area of the Eastern Cape, South Africa. They use population
    projection programs and new historical case level data which has a broader
    base than the national ante natal clinic (anc) data. They demonstrate the utility
    of the component method for projecting urban population trends as opposed
    to commonly used mathematical (exponential or logistic) projections. While
    there is much more work involved in an urban component projection because
    of problems of recovering reliable in-migration data, the final product of the
    component projection are of such value to planners that it is suggested that
    all South African city planners could benefit from such projections. This
    study also attempts to establish that if the HIV pandemic is allowed to run
    unchecked, the total population of the Nelson Mandela Metropole will be
    just under two million people by the year 2021. Without Aids it would be
    between 2.5 and 4 million. The authors analyze the new data with a view
    to understand the probable historical vectors of the pandemic and to enable
    policy formulation, interventions and planning.

      Any attempt to forecast the course of an urban HIV pandemic is fraught
    with difficulties and uncertainties. These relate primarily to the number of
    assumptions which must be made in building forecasting models, often with
    historical data that is not reliable. The results of any model should therefore be
    treated with caution and must be used responsibly. That uncertainty, however,
    should not deter attempts at developing realistic forecasts for the future course
    of the HIV/AIDS pandemic at the urban level, since these local projections
    are essential in attracting and recruiting the attention of the stakeholder urban
    planners and managers who need to understand the possible impact of this
    disease on their communities, and to plan appropriately.

                                          159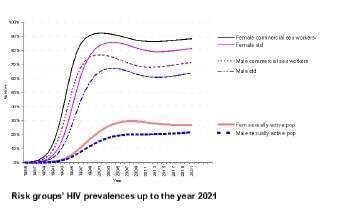
New Contree, No. 50 (November 2005)

    The background of this project
  The NMM municipality advertised for a population projection of the
metropole in 1997. Swedish urban planners of the fob wished to check their
own mathematical projections. In 1997, the Population Research Unit at
Rhodes University won this tender and immediately commissioned a blind
projection for HIV/AIDS of the population of the Nelson Mandela metropole
up to 2021 from the Demographic Information Bureau (DIB).1 The PRU,
for its own AIDS projection, obtained a South African program, ASSA600c
from the Actuarial Society of South Africa, a program which was then still
in prototype but which had many superior features to all other demographic
projection programs. Our methodology was to compare the two projections
and the urban planners estimates and to present the results.
 At the outset it is necessary to emphasize that the two programs are both
component programs.2 However, the ABACUS program works on five-year
input periods and five-year input age groups while the ASSA600c works on
one-year periods and one-year age groups. Not only is the ASSA600c based
on more finer grained data but it also has a built in HIV/AIDS contagion
model which the user may fine tune for local conditions. The ASSA600c
appears to be a highly refined version of the program which the actuary, Peter
Doyle, used for his initial and now famous projections of the whole of South
Africa.3

    General description of the ASSA600c program
 Since reporting of AIDS cases and deaths in South Africa was contested, it
was necessary to develop a model which could be based on Antenatal Clinical
HIV prevalence data, since that surveillance system was most widely used in
1    The present authors wish to thank Johan Calitz at the DBSA, Kobus and his team at the DIB for helping
     us. They used the UN’s ABACUS program. The authors also wish to thank Robert Dorrington, Professor of
     Actuarial Science at UCT, for his help with this project, specifically for explaining many of the features of the
     program. The ASSA program is free and may be downloaded from the ASSA website.
2    Mathematical models are based on extrapolation, while component models break the population into groups
     or cohorts and attempt to emulate their demographic behaviour. For a fuller discussion of the superior
     characteristics of component programs, see chapter one on “Methodology and Rapid Demographic Change”
     in The Philanthropic City State: Some projections and a demographic forecast for the Greater Port Elizabeth
     Region, 1996-2011, 2021 PRU Working Paper No 4 (29 April 1998), pp. 1-5.
3    P Doyle, “The Demographic Impact of AIDS on the South African Population”, in Sholto Cross and Alan
     Whiteside, Facing up to AIDS: The Socio-Economic Impact in South Africa (London: St Martin’s Press, 1993),
     pp. 87-112. We have based some of the description of the model on this work and on a 2000 photostat version
     of the ASSA guide.

                                                        160
The sero-conversion of the people of the Nelson Mandela metropole
South Africa and data went back to 1990. It was felt that a locally developed
model that could more accurately predict the dynamics of the HIV pandemic
in the South African context was required: ASSA600c was the choice. In the
next sections the structure of the model and the assumptions underlying it
are described.
Structure and basic principles of the model
Many methods have been used worldwide to model the HIV pandemic.
These methods include direct measurement of HIV seroprevalence in the
population, extrapolation and back calculation methods, as well as macro-
and micro-level fore-casting models. The program uses macro-simulation fore-
casting, since key assumptions are made about the pandemic at the society-
wide or macro level. The model does, however, make certain assumptions
at the individual risk level, or micro level. For example, assumptions are
made about the risk behaviour of individuals within specified risk groups
in the population. The model is also an actuarial model, since it focuses on
developing age and duration-specific mortality factors, allowing also for
select and ultimate experiences. It consists of a number of sections which are
described in more detail below.
The model is premised on the following assumptions:
1. HIV infection in Africa is transmitted predominantly via heterosexual
contact, uterine descent, breast-feeding and to a lesser known extent by
male homosexual, bisexual and accidental blood transfusion.4
2. There will be no cure or treatment for AIDS over the period for which the
projections are developed, or if treatment is possible it will not be made
available.5
4 Bisexual contact and accidental blood transfusion, for example, from motor vehicle accidents, are not modeled
by ASSA.
5 There are two reasons for this, which are unlikely to change. First, is government(or should one say Presidential?)
denial and second, the lack of local infrastructure. For example, in 2006 only 100,000 persons were on state
sponsored ARV treatment in the whole country. For the lack of health department infrastructure in the Eastern
Cape, see Colm Allan, Neil Overy, Zama Somhlaba, et al., The Crisis of Public Health Care in the Eastern
Cape: The post Apartheid challenges of oversight and accountability (Grahamstown, Oneworldbooks, 2004), pp.
104-133. Detailed discussions with Trudy Thomas (former ANC MEC for health) and Costa Gazi (National
spokeperson for Health for the PAC) also informed our opinions.
161New Contree, No. 50 (November 2005)
3. There will only be changes in sexual behaviour once significant numbers
of persons in the community are dying or dead from AIDS.
According to the 1996 census, over 50 percent of the Eastern Cape population
was illiterate. Knowledge to illiterate people could easily be passed on via
public radio, but the SABC have not followed this suggested and obvious
path, pioneered by Tanzania, Kenya and other countries such as India, Mexico
and Brazil.6
The model attempts to simulate empirically observed HIV infection rates
from the Eastern Cape anc data and to incorporate patterns from the past and
project them into the future. HIV infection data from the Aids Treatment,
Information and Counselling Centers Nelson Mandela metrople were also
used as inputs to the modeling process.7
Description of data from Eastern Cape
In October of each year, all pregnant mothers attending ante natal clinics
(hereafter anc) are tested at specific sites within each health region. Each
health region has two sites, one urban and one rural. Results from these sites
are then averaged. The ante natal clinic data were not always satisfactory. For
example, the Eastern Cape anc age data were not collected for the 1996 ANC
survey. According to the unknown author(s) of the national survey: “[n]o
age information was given for specimens submitted in the Eastern Cape.
Specimens (total number received and the number of positive specimens)
from the Eastern Cape were therefore proportionately redistributed according
to the respective [age] groups of the total sample with known ages.”8 In other
6 I am grateful to Bill Ryerson, the president of the Population Media Center for a fruitful correspondence on
this issue. The wind-up radio was invented for the African AIDS pandemic, cf. William N. Ryerson, “The
effectiveness of entertainment: mass media in changing behavior” mimeo; Charles Westoff, and A. Bankole,
“Mass Media and Reproductive Behavior in Africa,” Demographic and Health Surveys Analytical Reports
No.2, (Macro International Inc., Calverton, Maryland, 1997); E.M. Rogers, P. Vaughan, et al.,, “Effects of
an entertainment-education radio soap opera on family planning behavior in Tanzania,” Studies in Family
Planning 30(3) 1999, pp. 193-211; P Vaughan and EM Rogers, et al., “Entertainment-education and HIV/
AIDS prevention: a field experiment in Tanzania,” Journal of Health Communication, 5, 2000.
7 The late Ettienne “Coco” du Plessis was most helpful in providing the data which he had been collecting
since 1990. Sandi Dunstan and the staff of the ATICC in Brister House were also helpful. These data include
children, males, people older than 45 and a much wider range of persons than the anc data incorpoarted. The
ATICC data also coded for population group and for suburb. The database has 27,000 cases and runs from
1990 to May 2000. For further details see Prabha Rama, “Placing the Dead: The spatial distribution and spread
of HIV in a major South African city” (MPhil, University of Western Cape, 2006).
8 Anon, “Seventh national HIV survey of women attending antenatal clinics of the public health services,
October/November 1996” (25 April, 1997), 1-15, quote page 3.
162The sero-conversion of the people of the Nelson Mandela metropole
words, the Eastern Cape age data for October/November 1996 at least, were
scientific guesses.
Moreover, the 1997 Eastern Cape antenatal data collection had inadequate
samples from three of the five regions (A, B and C, see maps).
Figure 1: Map of Health Regions in Eastern Cape
For example, in Region A the total of pregnant women participating in the
annual antenatal clinic survey at Motherwell (the urban site of Region A)
and Willowmore (the rural site) was 231 (156 at Motherwell but only 75 at
Willowmore). As the editors of the Health department’s bulletin explained: “[a]
sample large enough to detect a 3% change in a population with an estimated
HIV prevalence of 8% (based on the survey results of 1986) was calculated at
about 300 per region (150 per [sentinel] site).”9 Was Willowmore, with just
over half the recommended sample collected, a representative sample?
9 F Meidany and R Puchert “Sentinel surveillance of antenatal clients for human immune-deficiency virus,
Eastern Cape, 1997”, Eastern Cape Epidemiological Notes ,1( 3), June 1998, p 3.
163New Contree, No. 50 (November 2005)
Further, was Willowmore a typical rural site within Region A? According
to the ATICC data, Willowmore had among the lowest absolute number of
tested positives of all regions in Region A, namely two cases. Since the urban
Motherwell (467 positives) was statistically responsible for the high prevalence
of Region A — the highest of all regions in the Eastern Cape — one may
safely conclude that the urban area of NMM might be much higher than the
reported Region A prevalence, which was calculated by averaging the results
from Willowmore and Motherwell, to create the low average of 15.15%.10
The geographical variation of HIV prevalence in the province may be seen
in the accompanying map which also shows syphilis prevalence, an important
input to the ASSA model. One important aspect of this graphic is that the
highest HIV and syphilis levels were in the wealthiest part of the province.
Figure 2: Map of the Health Regions of the Eastern Cape, showing HIV and syphilis
prevalence
10 F Meidany and R Puchert, “Sentinel surveillance of antenatal clients for human immune-deficiency virus,
Eastern Cape, 1997”, Eastern Cape Epidemiological Notes ,1( 3), June 1998, p 6.
164The sero-conversion of the people of the Nelson Mandela metropole
Features of the ASSA600c model:
The three cardinal features of the model are its use of different risk groups,
its modeling of the spread of HIV infection, and its use of the concept of HIV
seed (in the statistical sense) inputs in the model. ASSA600c was developed
with the assumption that heterosexual transmission of HIV would constitute
the major pattern of spread of the pandemic. The features are described in
brief in the following sections.
Risk groups
The spread of the HIV pandemic in any country is not uniform. Rather,
the pandemic is distributed according to a range of risk behaviour and also
according to a rapid spread of infection based on a bewildering variety of
proximal vectors.11 This results in clearly identifiable set of early vectors
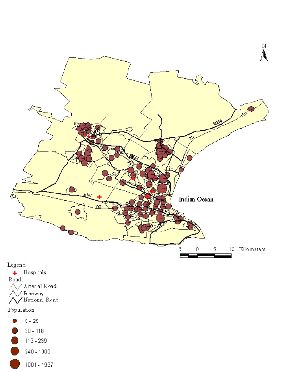
followed by a rapid even diffusion of the virus throughout the city
Figure 3: Map of NMM showing HIV prevalence and vectors in 1998
11 Prabha Rama, “Placing the Dead: The spatial distribution and spread of HIV in a major South African city”
(MPhil, University of Western Cape, 2006).
165New Contree, No. 50 (November 2005)
Figure 4: Map of NMM showing diffusion of HIV throughout the city by May 2000
The ASSA program stratifies the community into four homogenous risk
groups. Sexual behaviour is, of course, not homogenous, but each group is
defined and used so that it represents a cluster of individuals with an associated
sexual behaviour, an average HIV prevalence and infection rate.
The four risk groups are defined as follows:
166The sero-conversion of the people of the Nelson Mandela metropole
CSW (Commercial sex workers): persons characterized by sexual mobility
or promiscuity (for example, sex workers, “rent boys” and their frequent
clients.12)
STD (Sexually Transmitted Disease): a group characterized by a high
prevalence of STD. This indicates a high susceptibility to being infected by
HIV, both because the presence of other STDs increases the probability of
transmission of HIV per contact, and because the presence of an STD may
suggest a relatively high number of new sexual partners per year. For the
Eastern Cape, this was 12% for Region A.
RSK (at Risk): persons characterized by stable sexual relationships, but who
are at risk of infection because they, or their partners, have more than one
sexual relationship.
NOT (Not at risk): persons characterized by either having no sexual contact,
or by having long-term monogamous relationships, and who are therefore
not at risk of HIV infection. This group will comprise the survivors of the
pandemic. They are also responsible for the ultimate “leveling off”13 of the
pandemic in this program.
However, one should not be too sanguine about this particular assumption.
South Africa has never had a Kinsey report on sexual behaviour. It is therefore
anyone’s guess at how big the “Not at risk” group is.14 Reports from the rest of
Africa that the pandemic is “leveling off” might conceivably be due to changes
of the antenatal clinic protocol15 or a degradation of surveillance systems as
the costs of such surveillance increases. Some press reports from KwaZulu,
Botswana and Zimbabwe indicate +50% HIV+ prevalence levels. When will
these areas “level off”? More importantly at what point in the pandemic will
the authorities declare a health emergency?
12 “Rent Boys” are young boys in NMM who offer sexual pleasure to clients in their cars, sometimes for as little
as five Rands per night or even shelter for the night. Some boys had over 200 sexual encounters per year.
Information from Timothy Hepplewhite, former worker at ATICC [ca 1997-ed.].
13 The government is quick to claim that HIV is “levelling off”; however, it should be borne in mind that
“levelling off” in a sexually transmitteddisease is not comparable to the naturalistic levelling off which occurs in
a respiratory tract epidemic.
14 The assumptions regarding this group are the weakest in the model, but can be changed by the author.
15 A good example of this was when the anc protocol was changed in 1999 so as to include asking the pregnant
women whether they minded having their blood tested for syphilis and HIV. Of course, this question effected
the results as a proportion of women, especially younger women, who were perhaps already apprehensive of
returning home with the unwelcome news of an unwanted pregnancy would not want to know about the
additional burden of HIV and/or syphilis. The downturn in prevalence was quickly seized upon by the health
minister as demonstrating that the epidemic had leveled off.
167New Contree, No. 50 (November 2005)
Each level of risk represents a group that may be related to observed categories
of data. For the CSW group, HIV data from studies of sex workers and other
high risk groups were used. Similarly, HIV data from studies of STD patients
were used for the STD category, although the effect of members of the CSW
group of this data was excluded. In the RSK group, data representing the
general adult population were used; for example, data on women attending
antenatal clinics (with adjustments for the effects of members of the STD and
NOT groups on this data).
The relative sizes of the different risk groups are critical to the overall results,
as are the parameters describing the sexual behaviour of each group. Extensive
sensitivity analysis has indicated that the most important group is the STD
group. The STD group, however can be large and is also an important link with
the larger risk (RSK) group. Data are available on the prevalence of syphilis
in the population and has been used as an estimate of the size of the STD
risk group. The CSW group is important in the early stage of the pandemic,
but marginal in terms of the total size of the pandemic. The division of the
rest of the population into the RSK group and the not at risk (NOT) group
is somewhat arbitrary, but only has an effect on the theoretical maximum size
of the pandemic. The program allows for these percentages to be changed
according to regional and diachronic variants.
A pattern of contact is assumed both within and between risk groups
according to the assumed number of partners in each risk group. Allowance
is also made for variation in sexual activity according to age and gender. The
groups are categorized according to behaviour during the peak sexually active
years. The program runs in a yearly cycle and the population ages, generates
births, normal deaths, new HIV infections and new AIDS deaths. A variety
of outputs are generated.
ASSA600c is a fully fledged component projection program designed for
South African populations.16 Its drawback as a general program is that it
insists on a 1985 start year (closest census year to the start of the pandemic)
which requires the user to have access to 1985 population data.
16 For example, the Indian or Chinese population cannot fit into the start population dialogue box.
168The sero-conversion of the people of the Nelson Mandela metropole
The inputs:
Migration
The migration age structures of the respective inputs into ABACUS and
ASSA600c were slightly different but the total number of in-migrants to
the NMM area between the years 1985 and 2021 were the same, namely
350,000. Thus the differing outputs of the two programs were not dependent
on different migration assumptions, at least in total numbers.
Age and sex structure
The age and sex specific data may be seen in accompanying appendices in
the original report. These were derived from the 1985 and 1996 national
censuses.
Seed individuals
The ASSA600c program depends on a number of seed individuals who
were HIV positive being fed into the program at the start year, 1985. This
number was only eighteen individuals. That this tiny number of individuals
could ultimately infect nearly 400,000 in the region should indicate just how
infectious the pandemic is.
Results
The model predicts a steep increase in the CSW, STD and RSK groups’
prevalence which may be seen in the accompanying graphic.
169New Contree, No. 50 (November 2005)
Figure 5: The projected prevalence of different risk groups in NMM, 1985 to 2021
The small number of CSW males and females show quite different projections
of prevalence but in anyone’s language they are high. The larger STD groups
also show steeply rising prevalence levels. A much more aggressive campaign
is needed against STDs in the NMM region.17
The majority of the population, the sexually active female (bottom solid line)
and male (bottom dotted) groups, will peak at different times. The females
will start tapering off after about 2011 while the males will continue to rise
slightly until the end of the projection period.
The program also produces a graph of HIV infections per year, Aids deaths
per year and natural deaths per year.
17 There has been a successful campaign in the Eastern Cape to bring down the high prevalence since 2000.
170The sero-conversion of the people of the Nelson Mandela metropole
Figure 6: HIV infections, Aids deaths and non-Aids deaths, 1985 to 2021
By the year 2004, AIDS deaths (middle series) had outnumbered all other
deaths (bottom series). The results show a sharply rising pandemic which will
only start tapering off in the year 2011. The number of new HIV infections
(top series) per year will stabilize at about 20,000 new cases per year in 1998.
It is important to emphasize that the graphic shows new infections and new
AIDS deaths per year. The tapering off is a result of the input that 40% of
all people in Region A will never be infected, the problematic “NOT at risk”
group.
Putting the ATICC data into the hopper
By December May 2000 ATICC had recorded more than 27,000 accumulated
HIV positives in the NMM region. There are more tested positives in NMM
now than in the whole of Australia and New Zealand combined.18 However,
the ASSA600c model retro-dicted that there were over 18,000 new HIV
infections in 1998. The same projection estimates that there are currently
90,356 HIV positives in NMM in 2004; in other words over 70,000
18 UNAIDS country fact sheet, 2001, s.v. Australia and New Zealand.
171New Contree, No. 50 (November 2005)
people infected with HIV in NMM remain untested and ignorant of their
serostatus.
If one took only AIDS deaths in the first year of the projection period and
then added them to the AIDS deaths of the previous year, that would result in
the following ogive (a graph showing the accumulated annual totals):
Figure 7: Ogive of accumulated AIDS deaths in NMM, 1985 to 2021
The total number of AIDS deaths between 1985 and 2021 will be 400,000.
This is larger by 50,000 than all migrants coming to the NMM area projected
to the same year. In other words, any urbanization will keep the population of
Nelson Mandela Metropole from having a negative growth rate.
The AIDS transition
One of the curious aspects about this pandemic is that it resembles the
demographic transition in its effects on the population pyramid. There are
noted side effects on fertility in all Aids pandemics which result in lower
final projections. The reason for this is that women with HIV have fewer
conceptions. This is part of what Sandra Matanyaire, a young Zimbabwean
172The sero-conversion of the people of the Nelson Mandela metropole
demographer, has called the “Aids transition”, the way in which Aids presents
itself as modernizing the population.19
The characteristic onion shape in which the youngest age groups are smaller
than the older age groups above them is well illustrated here. It is only in the
older female age groups (25 to 45) where the pandemic properly manifests
itself.
Figure 8: Population pyramid of NMM survivors in 2021
The main result was the comparison of the mathematical projections which
the Swedes had used and the two component projections which the PRU had
commissioned and developed. This may be visualized in a graphic.
19 D Matanyaire, “The AIDS transition: impact of HIV/AIDS on the 14 demographic transition of black/African
South Africans by 2021” (University of the Western Cape, MSc., 2004).
173New Contree, No. 50 (November 2005)
Figure 9: The final forecast: projections compared
The base population projection (i.e. no Aids), the blind DIB AIDS projection
and the AIDS ASSA600c projections are compared in the accompanying
graphic. While the ASSA600c projection is the lowest, the present authors
believe in its superiority over the DIB projection, and certainly over the
mathematical projection. One can be certain that the most probable projection
lies between the DIB and the ASSA600c projections.
Conclusion
The base population projection (without AIDS) which the present author
presented to the NMM Comprehensive Urban Plan in April 1997 was
substantially downwardly revised to the consternation of the Swedish town
planners who were expecting “radical urbanization”. How far down is a
tricky question. Both the new AIDS projections share the same migration
assumptions as the base projection. In other words the migration input
variable cannot account for the different outcomes between the ASSA600c
and the DIB projections. The new ASSA600c projected population in the
year 2021 in the greater NMM area is far below the logistic projection, almost
174You can also read