Exploiting the Interdependency of Land Use and Mobility for Urban Planning - CPE CMU
←
→
Page content transcription
If your browser does not render page correctly, please read the page content below
Exploiting the Interdependency of
                                Land Use and Mobility for Urban
                                Planning
Kasthuri Jayarajah
Singapore Management
                                                                                  Abstract
University
                                                                                  Urban planners and economists alike have strong interest
kasthurij.2014@phdis.smu.edu.sg                                                   in understanding the inter-dependency of land use and
                                                                                  people flow. The two-pronged problem entails system-
                                                                                  atic modeling and understanding of how land use impacts
                                                                                  crowd flow to an area and in turn, how the influx of peo-
Andrew Tan
                                                                                  ple to an area (or lack thereof) can influence the viability
Singapore Management
                                                                                  of business entities in that area. With cities becoming in-
University
andrewtan@smu.edu.sg                                                              creasingly sensor-rich, for example, digitized payments for
                                                                                  public transportation and constant trajectory tracking of
                                                                                  buses and taxis, understanding and modelling crowd flows
                                                                                  at the city scale, as well as, at finer granularity such as at
Archan Misra                                                                      the neighborhood level, has now become possible. Inte-
Singapore Management
                                                                                  grating such understanding with heterogeneous data such
University
archanm@smu.edu.sg
                                                                                  as land use profiles, demographics, and social media, en-
                                                                                  ables richer studies on land use and its interdependence
                                                                                  on mobility. In this work, we share findings from our pre-
                                                                                  liminary efforts and identify key lines of research inquiry
                                                                                  that can help urban planners towards data-driven policy
Permission to make digital or hard copies of all or part of this work for         decisions.
personal or classroom use is granted without fee provided that copies are not
made or distributed for profit or commercial advantage and that copies bear
this notice and the full citation on the first page. Copyrights for components    Author Keywords
of this work owned by others than ACM must be honored. Abstracting with
credit is permitted. To copy otherwise, or republish, to post on servers or to    Urban computing, land use, urban mobility, clustering,
redistribute to lists, requires prior specific permission and/or a fee. Request   prediction
permissions from permissions@acm.org.
UbiComp/ISWC’18 Adjunct, October 8–12, 2018, Singapore, Singapore.
Copyright c 2018 ACM ISBN 978-1-4503-5966-5/18/10$15.00.                          ACM Classification Keywords
https://doi.org/10.1145/3267305.3274163
                                                                                  H.4 [Information Systems Applications]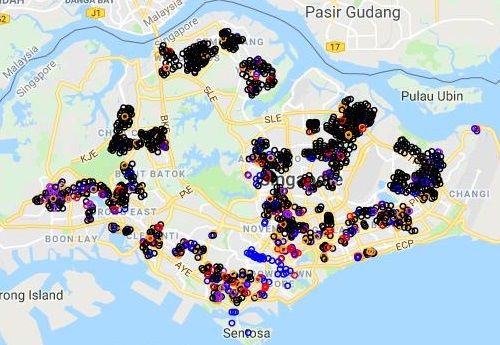
Introduction                                                   In this paper, we share our preliminary efforts and early
Urban planners are often posed with questions such as          findings in studying a specific question: given the mix of
what should the mix of use allocated to an area? (e.g.,        land use in a neighborhood, can we estimate the utiliza-
how many restaurant lots), what’s the viability of a type      tion pattern of a “planned” carpark?. To this end, we
of business if it’s allocated the permit to operate in that    collected longitudinal car park lot availability data from
area?, does the land use profile match the people flow to      over 1500 carparks from across Singapore, and extracted
that area? and so on. The series of Such questions can         the land use around each individual carpark using social
be reduced to a two-pronged problem entailing system-          media, and predict the utilization pattern of a carpark us-
atic modeling and understanding of how land use impacts        ing machine learning algorithms. Although we limit the
crowd flow to an area and in turn, how the influx of peo-      scope to carpark utilization in the current work, the prob-
ple to an area (or lack thereof) can influence the viability   lem is generalizable to traffic and congestion levels in the
of business entities in that area. Traditionally, planners     neighborhood, in general, as it may be observable through
have relied on surveys and limited observational studies to    taxi pickup/dropoff patterns, public transport utilization
help them with such problems.                                  and so on.

With cities becoming increasingly sensor-rich, there’s op-     We make the following key contributions in this work:
portunity now to comprehend the family of problems us-
ing large-scale, longitudinal data. For example, digitized        1. We first explore the use of unsupervised clustering
payments for public transportation and the availability              in extracting categories of carparks based on their
of GPS sensors aboard public buses and taxis enable the              weekly, temporal utilization patterns. We share
modelling of crowd flows at the city scale, and help fur-            preliminary insights from the resulting clusters of
ther our understanding of commute patterns, disease                  carparks and the land use around those.
spread, the impact of local events, etc. The fine spatio-
temporal resolutions of data have made it possible to             2. We then predict the utilization patterns of carparks,
study variations across neighborhoods within the city. At            given the neighborhood land use mix, posing the
the same time, the emergence and popularity of location-             problem as a multi-class classification task. We
based social networks (LBSNs) such as Foursquare and                 achieve an AU C ≈ 0.84 suggesting that our pri-
Google Places have demonstrated their use in studying                mary hypothesis that the activity or land use of an
topics such as crowd flows and business longevity. In ad-            area can be indicative of the people flow in that
dition, they are also useful in profiling neighborhoods by           area.
their land use due to the rich semantics present in the
user-generated data (e.g., type of cuisine a restaurant of-
fers). Integrating such understanding with heterogeneous
                                                               Problem Description
                                                               In this work, we tackle the problem of predicting the tem-
data such as land use profiles, demographics, and social
                                                               poral utilization pattern of a carpark given the land use
media, enables richer studies on land use and its interde-
                                                               around it. We adopt the following definitions and nota-
pendence on mobility.
                                                               tions.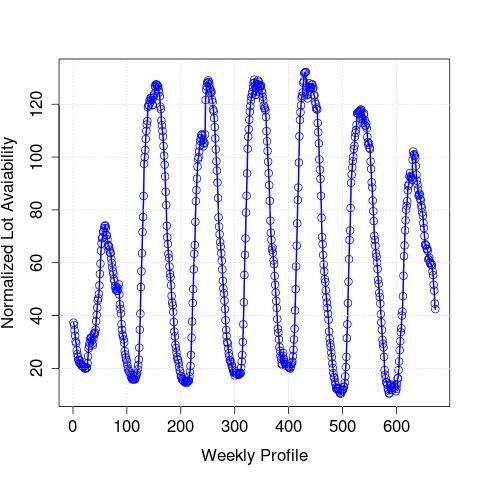
Given a carpark, c, at location < latitude, longitude > to public car park utilization; in particular, we use two
representing its coordinates, we define its weekly temporal sources for this purpose: (1) availability of lots at resi-
profile, wc (t) = mean(availability(c, t)), where t repre- dential areas1 , i.e., at car parks attached to the Hous-
sents a time window which is a combination of one of the ing Development Board (HDB) which comprise of more
seven days of the week and a observation bin representing than 70%2 of the housing units across Singapore and (2)
the a slot during the day. For example, if the bin size is availability of lots in select commercial complexes in the
1 hour, then the vector wc (t) is 7 × 24 = 168 in length. greater Central Business District (CBD) of Singapore 3 .
In this work, we consider bin sizes of 15 minutes. In order In total, we extracted longitudinal car park utilization
to reduce the problem space, and handle any noise in uti- data of 1699 car parks between April through July 2018.
lization data, we first cluster the weekly temporal profiles
of all the carparks using k− means, in an attempt to un- As discussed earlier, we cluster carpark utilization pat-
cover types of carparks (we investigate the choice of k in terns in an unsupervised manner, to uncover categories of
the subsequent section). patterns. With k− means clustering (with k arbitrarily set
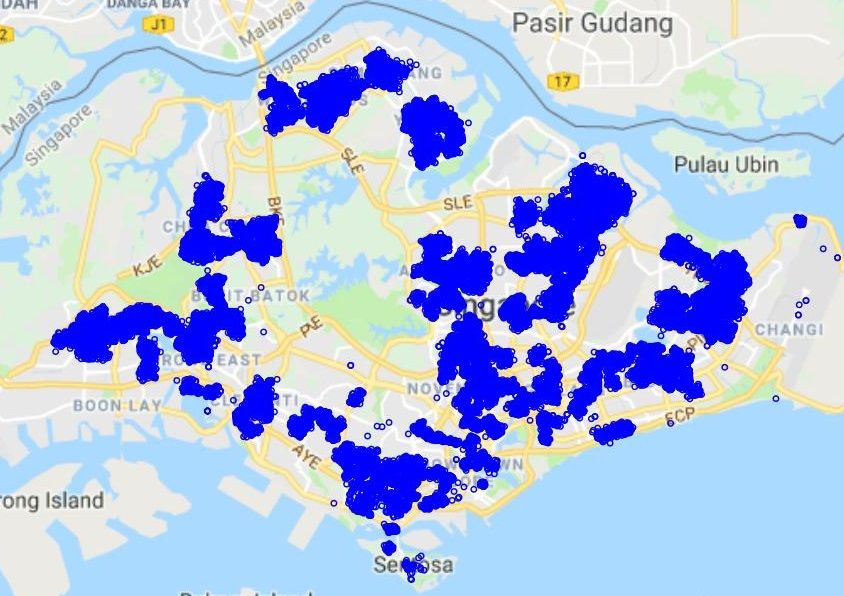
Figure 1: Carparks considered in
to 5), Figure 1 shows the carparks belonging to each of
this work. The 5 colors represent
Further, for each carpark, c, we define its neighborhood the 5 clusters, differentiated by their color. As expected,
5 different clusters resulting from
the carparks’ weekly temporal as the circular region encompassing a radius, r, from its as our dataset is skewed towards having a much higher
patterns. The dominant black < latitude, longitude >. We express this neighbor- number of carparks attached to residential blocks in the
carparks represent mostly hood, or, land use profile, as a distribution over venue country, we see that the cluster represented in black is
carparks attached to residential categories, V (i.e., a vector of length |V | whose elements seen to be widespread and prevalent more dominantly.
blocks. are the counts of venues belonging to each category v ∈
V , within that radius r). Example venue categories are As an illustrative example, we also plot the representa-
“Restaurants”, ”Apartments”, ”Office Spaces”, etc. tive centroid weekly patterns of the five carpark clusters
in Figure 2. The x−axis represents the time bins over a
Finally, we represent the multi-class classification prob- week (7 days × 96 fifteen-minute bins over each day). As
lem with the dependent variable as the cluster type of
carpark utilization and the input feature set, or the inde-
Dataset Total Entities Observation Period
pendent variables, being the distribution of venue cate-
gories around the carpark. Land Use 74,996 venues as at July, 2018
Car Park Util. 1700+ carparks April - July 2018
Datasets Used Table 1: Summary of datasets used in the analyses.
In this paper, we share insights on the prediction of carpark
utilization problem outlined in Section using the fol-
lowing categories of data, broadly. We summarize the
1 https://data.gov.sg/dataset/carpark-availability
datasets in Table 1. 2 https://www.straitstimes.com/politics/parliament-hdb-flats-
made-up-73-of-singapores-total-housing-stock-in-2016
Carpark Utilization: In order to understand people flow 3 https://www.mytransport.sg/content/mytransport/home/
to an area, we rely primarily on information pertaining dataMall/dynamic-data.html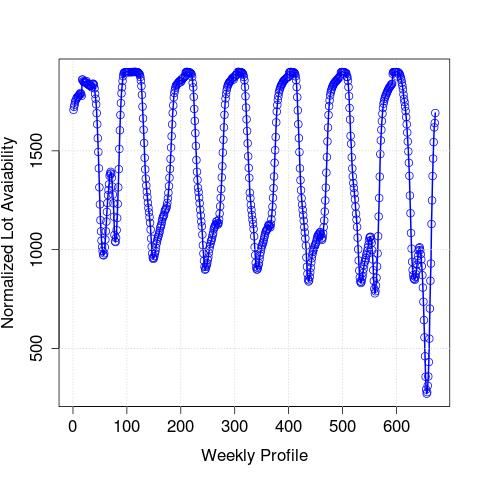
Figure 2: Weekly Carpark Utilization of the Cluster Centroids.

                                                                        speculated, the cluster identified by “black” color in Fig-
                                                                        ure 1 which is the same as the cluster identified as “Clus-
                                                                        ter 0” in this figure, aligns well with our expectations for
                                                                        residential carparks. The maximum lot availability is seen
                                                                        during the day hours (where the car owners would have
                                                                        left for their workplaces), and lowest availability is seen
                                                                        during the late evening hours (where the residents would
                                                                        have returned back home from work). Upon closer ex-
                                                                        amination of the centroid clusters, it is also clear that
                                                                        ”Cluster 1” and “Cluster 3” follow the expected patterns
                                                                        of commercial or office lots. Further investigations are
                                                                        warranted to understand the workings of the remaining
                                                                        clusters.

                                                                        In order to choose the optimal k (i.e., number of clus-
                                                                        ters), we vary the number of clusters (from 2 to 8) and
                                                                        measure the Silhouette coefficient which is a measure
                                                                        of clustering quality. In Figure 3, we plot the number of
                                                                        clusters on the x−axis and the resulting coefficient on the
Figure 3: The impact of choice of the number of clusters k
                                                                        y−axis. We conclude that for the current setting, k = 2
on clustering quality, measured by the Silhouette coefficient.
                                                                        offers the highest quality and adopt this for the subse-
                                                                        quent analyses.
Land Use: In order to extract the land use mix of neigh- is common in Singapore for housing blocks to have their
borhoods (i.e., an area surrounding a given business en- own allocated event space, or multifunction space, and
tity), we rely on the Venue Search API [14]. Given a neighborhood amenities such as barbershops. On the
point location < latitude, longitude >, the API returns other hand, the top categories surrounding the carpark
up to 50 venues within a configurable radius whose gen in the CBD area turned out to be, as expected, venues
categories allow us to define the land use around that pertaining to the retail category: ”Chinese Restaurant”,
location. In this work, we set this distance to 500 me- ”Sporting Goods Shop”, ”Clothing Store”, ”Miscellaneous
ters as prior work [5] has shown that a venue’s operation Shops”, ”Japanese Restaurants”.
is affected primarily by conditions within this radial dis-
tance. We note here that alternative sources exist to ex- Preliminary Results
tract such land use information, albeit at varying degrees In this section, we describe our early efforts in predicting
of accuracy; for instance, the Google Places API 4 which the temporal utilization patterns of planned carparks.
functions similarly and returns up to 20 establishments
within a neighborhood, whereas digitized land information As described in earlier sections, we pose the problem
from government authorities5 are more likely to consist of predicting the utilization patterns as a classification
of the most accurate and fine-grained representation of a task where the class pertains to the unsupervised cluster
city’s land use although harder to obtain. Figure 4 depicts or category of carpark. For each carpark instance, c, in
the 75,000+ venues considered in this work. the dataset, we consider the distribution of categories of
Foursquare venues within a 500 m neighborhood as the
To further illustrate the validity of our central hypoth- input set of features. As a measure of feature selection,
Figure 4: Foursquare venues esis that land use affects traffic patterns in the vicinity, we prune out categories of venues that are not present
considered in this work for we compare the utlization patterns (see Figure 5of two around at least 100 of the carparks. This brings down the
profiling land use. carparks, one from a residential area and the other from number of categories retained to 32 (from 506).
the Central Business District and the top-5 categories
of venues around them, respectively (see Figure 6). In We pick the number of carpark clusters as k = 2 as it
Figure 5, the patterns of the individual carparks clearly exhibits the highest Silhouette coefficient; in effect, this
depict their similarity to the cluster centroids (residen- reduces the problem to a binary classification task. As
tial: cluster 0 and CBD: cluster 1) with the times dur- our dataset consists of an unbalanced number of samples
ing which the lots fill or become free, being the inverse per class (i.e., Cluster 0: 1321 samples, Cluster 1: 378
of the other. We observe that the top 5 categories of samples), we first create a subset including all samples
venues surrounding the residential carpark to be ”Hous- from cluster 2 and randomly sampled, equal sized samples
ing Development”, ”Apartment/Condos”, ”Parking”, from cluster 1, generating a balanced dataset. We then
”Event Space”, ”Salon/Barber Shop”. We note that it perform 10-fold cross-validation and report the average
performance metrics in Table 2, for a number of machine
4 https://developers.google.com/places/web-service/search learning algorithms.
5 https://www.sla.gov.sg/Services/Street-Map/Licensing-of-
Digitised-Land-Information We observe that the highest accuracy is obtained withNaive Bayes, with an AUC (area under the Receiver Op- the commercial carparks – as a result, the categories of
erating Characteristic curve ) of ≈ 0.84. The improved carparks resulting from the clustering stage predominantly
performance over other algorithms warrants further in- represent only two variations, and also suffer from skew
vestigations which we defer as future work. We note that in cluster sizes (i.e., one dominant, very large cluster,
one possible reason could be either due to a lack of de- and several smaller clusters). Further, the business en-
pendence between the features, or, the dependences ei- tities in the vicinity of a carpark are queried through the
ther being distributed evenly across classes, or cancelling Foursquare API but are limited by the query results – i.e.,
each other out. there is a hard limit of only 50 results for every queries
GPS location. For a fixed search radius, this means that
Discussion and Ongoing Work the resulting search may not be able to distinguish be-
In this paper, we examined the fundamental hypothesis tween dense and sparse neighborhoods, which may lead to
(a) Residential of whether and how the mix of land use in a neighbor- different results. In ongoing work, we are attempting to
hood can impact the traffic level or people flow in that alleviate these drawbacks by (1) improving the coverage
area. To operationalize this, we relied on social media for of existing datasets, (2) sourcing from alternate datasets
understanding the various business entities in a neighbor- (e.g., land use data from local planning agencies), and
hood (surrounding an existing or potential carpark), and (3) consider additional layers of data (e.g., proxy for pop-
weekly carpark utilizations as proxy for traffic or footfall ularity of venues in the neighborhood using check-in data
to that area. In this section, we highlight some key limita- from social media, additional modes for learning foot-
tions to the current work and outline lines of inquiry and fall/traffic including taxi dropoffs, public transportation,
open questions that we are actively pursuing. etc.).
Current Limitations: One of the key limitations in the Ongoing Work: In this current work, the key goal was
current work lies with the data sources used in the anal- to be able to predict the utilization patterns of a carpark
yses. For instance, the carpark utilization covers much of based on the mix of entities surrounding it. As part of
(b) CBD
the residential carparks of the island, but only a few of ongoing work, we are exploring the feasibility of being
Figure 5: The weekly utilization able to explain the utilization pattern of a transport re-
pattern two representative source (e.g., carparks, in this case) based on the activity
Precision Recall F-Score AUC
carparks, one from a residential or dynamics of the neighborhood. In other words, given
Naive Bayes 0.808 0.806 0.805 0.837
area and the Central Business a mix of activities (e.g., work, retail, residential, etc.), we
District area in Singapore. Random Forest 0.768 0.766 0.766 0.818
would like to systematically estimate the expected traffic
SVM 0.776 0.775 0.775 0.775
(e.g., road congestion) or utilization patterns as a genera-
Logistic 0.704 0.704 0.704 0.752
Decision Tree 0.733 0.732 0.732 0.703
tive process using technqiues such as tensor factorization.
We believe that this would be a key enabler for urban
Table 2: Classification accuracy from using different machine planners in the decision making process of allocating new
learning algorithms. resources, or understanding the individual needs of neigh-
borhoods. We are also actively investigating the impactof the spatial placement and function of other carparks [16] and detecting the occurrence of anomalous events
in the vicinity – in other words, we believe that there are [3, 15, 13], etc. In contrast, the nature of problems de-
merits to considering the transportation resources as a scribed in this paper attempt to understand the interplay
multilayer network, instead of as isolated, independent between the two facets, mobility (extracted and learned
entities. from longitudinal traces similar to these works) and land
use/activity.
Related Work
We briefly survey past literature in the following sub- Interplay between Mobility and Urban Activity: A
domains relevant to the work described in this paper. few recent works have focused on establishing the inter-
dependency between mobility and urban activity, at vari-
Retail Performance and Land Use using Social Me- ous levels. More close to our work, recently, d’Silva et al.
(a) Residential dia: In recent years, the feasibility of using social media [6] explore the impact of factors such as the catchment of
activity (check-ins in LBSNs, in particular) as proxy for a neighborhood, connectivity or accessibility of a neigh-
understanding retail performance has been studied ex- borhood and the alignment of a business establishment
tensively. d’Silva et al. [7], the authors predict the ex- with its neighborhood, on the longevity of businesses in
pected demand patterns for a newly opening business en- an area. Further, Georgiev et al. [9] discuss the indirect
tity based on its location and category of business by ob- impact of events (which draw unusually large number of
serving past patterns similar, existing businesses. Daggitt people to an area) on the profitability of retail businesses
et al. [5] discuss the attractiveness of certain localities to in the area. Fan et al. [8] propose and evaluate a theoret-
categories of businesses. Further, Hristova et al. [11] in- ical framework that factorizes mobility patterns of an area
vestigate the spending behavior of consumers at sporting as a mixture of various activity patterns (e.g., work, com-
events whilst Karamshuk et al. [12] explore the use of so- mute, etc.) conducted in that area. The activity patterns,
cial media for finding optimal placements for new retail in effect, are artefacts of the nature of land use of that
stores. Additionally, works such as those of Zhao et al. area. Similar in spirit to these works, we attempt here
(b) CBD
[18], explain the economic impact of cultural investments to understand the interplay between urban land use and
Figure 6: The top categories of (e.g., a new museum) on their surroundings. mobility, in a broader sense.
venues in the neighborhood of
two representative carparks, one Large Scale Urban Mobility: A large number of studies Concluding Remarks
from a residential area and the have explored the use of longitudinal, passively extracted In this work, we posed the problem of interdependency
Central Business District area in data such as telecommunication records [2], taxi trips [16, of land use and mobility and shared our preliminary re-
Singapore. 1], transit App logs [13], social media logs [10, 4], etc. sults from tackling the specific question of estimating the
for modeling urban mobility. These works have broadly carpark utilization patterns based solely on the land use
focused on detecting work-home locations of the public profiles around it. We show that even with a simplistic
[2, 4], commute patterns (e.g., for applications in opti- representation of the problem, a reasonably high accuracy
mizing trip time, efficient routing, etc.) [1], understand- of 0.84 (AUC) can be achieved validating our key hypoth-
ing disease propagation [17], forecasting traffic patterns esis. We discussed limitations of the current work andoutlined our next steps in studying this problem in-depth. 7. Krittika D’Silva, Anastasios Noulas, Mirco Musolesi,
Cecilia Mascolo, and Max Sklar. 2017. If I build it,
ACKNOWLEDGMENTS will they come? Predicting new venue visitation
This material is supported partially by the National Re- patterns through mobility data. In SIGSPATIAL.
search Foundation, Prime Minister’s Office, Singapore un-
der its International Research Centers in Singapore Fund- 8. Zipei Fan, Xuan Song, and Ryosuke Shibasaki. 2014.
ing Initiative. K. Jayarajah’s work was supported by an CitySpectrum: A Non-negative Tensor Factorization
A*STAR Graduate Scholarship. Approach (UbiComp ’14).
9. Petko Georgiev, Anastasios Noulas, and Cecilia
REFERENCES Mascolo. 2014. Where Businesses Thrive: Predicting
1. Rajesh Krishna Balan, Khoa Xuan Nguyen, and the Impact of the Olympic Games on Local Retailers
Lingxiao Jiang. Real-time Trip Information Service for through Location-based Services Data (ICWSM
a Large Taxi Fleet (MobiSys ’11). 2014).
2. Richard Becker, Ramón Cáceres, Karrie Hanson,
10. Samiul Hasan, Xianyuan Zhan, and Satish V
Sibren Isaacman, Ji Meng Loh, Margaret Martonosi,
Ukkusuri. 2013. Understanding urban human activity
James Rowland, Simon Urbanek, Alexander
and mobility patterns using large-scale location-based
Varshavsky, and Chris Volinsky. 2013. Human
data from online social media. In Proceedings of the
mobility characterization from cellular network data.
2nd ACM SIGKDD international workshop on urban
Commun. ACM 56, 1 (2013), 74–82.
computing.
3. Sanjay Chawla, Yu Zheng, and Jiafeng Hu. Inferring
11. Desislava Hristova, David Liben-Nowell, Anastasios
the Root Cause in Road Traffic Anomalies (ICDM
Noulas, and Cecilia Mascolo. 2016. If You’ve Got the
’12).
Money, I’ve Got the Time: Spatio-Temporal
4. Eunjoon Cho, Seth A. Myers, and Jure Leskovec. Footprints of Spending at Sports Events on
Friendship and Mobility: User Movement in Foursquare. (2016).
Location-based Social Networks (KDD ’11).
12. Dmytro Karamshuk, Anastasios Noulas, Salvatore
5. Matthew L. Daggitt, Anastasios Noulas, Blake Shaw, Scellato, Vincenzo Nicosia, and Cecilia Mascolo.
and Cecilia Mascolo. 2016. Tracking urban activity 2013. Geo-spotting: Mining Online Location-based
growth globally with big location data. Open Science Services for Optimal Retail Store Placement (KDD
3, 4 (2016). ’13).
6. Krittika D’Silva, Kasthuri Jayarajah, Anastasios 13. Tatsuya Konishi, Mikiya Maruyama, Kota Tsubouchi,
Noulas, Cecilia Mascolo, and Archan Misra. 2018. and Masamichi Shimosaka. 2016. CityProphet:
The Role of Urban Mobility in Retail Business City-scale Irregularity Prediction Using Transit App
Survival. Proc. ACM Interact. Mob. Wearable Logs (UbiComp ’16).
Ubiquitous Technol. 2, 3 (Sept. 2018).14. n.d. 2018. Search for Venues. https://developer. 17. Yingzi Wang, Xiao Zhao, Anastasios Noulas, Cecilia
foursquare.com/docs/api/venues/search. (2018). Mascolo, Xing Xie, and Enhong Chen. Predicting the
[Online; Last accessed 09-May-2018]. Spatio-Temporal Evolution of Chronic Diseases in
Population with Human Mobility Data (IJCAI’18).
15. Linsey Xiaolin Pang, Sanjay Chawla, Wei Liu, and Yu
Zheng. On Mining Anomalous Patterns in Road 18. Xiao Zhou, Desislava Hristova, Anastasios Noulas,
Traffic Streams (ADMA’11). Cecilia Mascolo, and Max Sklar. 2017. Cultural
investment and urban socio-economic development: a
16. Masamichi Shimosaka, Keisuke Maeda, Takeshi
geosocial network approach. Open Science 4, 9
Tsukiji, and Kota Tsubouchi. 2015. Forecasting
(2017). DOI:
Urban Dynamics with Mobility Logs by Bilinear
http://dx.doi.org/10.1098/rsos.170413
Poisson Regression (UbiComp ’15).You can also read