Exploring Synergies between EU Cohesion Policy and Horizon 2020 Funding across European Regions - APRE
←
→
Page content transcription
If your browser does not render page correctly, please read the page content below
Exploring Synergies between EU
Cohesion Policy and Horizon 2020
Funding across European Regions
                    An analysis of regional funding
                    concentration on key enabling
                    technologies and societal grand
                    challenges
                    Mathieu Doussineau,
                    Julia Bachtrögler-Unger

                    2021

                                                      EUR 30678 EN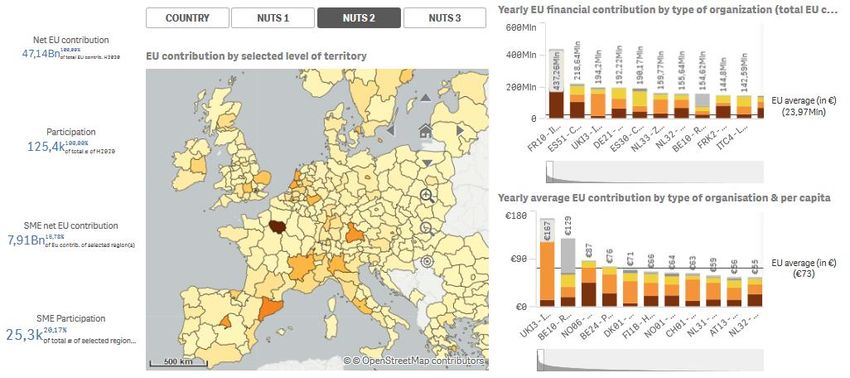
This publication is a Science for Policy report by the Joint Research Centre (JRC), the European Commission’s science and knowledge service.
It aims to provide evidence-based scientific support to the European policymaking process. The scientific output expressed does not imply
a policy position of the European Commission. Neither the European Commission nor any person acting on behalf of the Commission is
responsible for the use that might be made of this publication. For information on the methodology and quality underlying the data used
in this publication for which the source is neither Eurostat nor other Commission services, users should contact the referenced source. The
designations employed and the presentation of material on the maps do not imply the expression of any opinion whatsoever on the part
of the European Union concerning the legal status of any country, territory, city or area or of its authorities, or concerning the delimitation
of its frontiers or boundaries.

Contacts:
Name: Mathieu Doussineau
Address: Edificio Expo, c. Inca Garcilaso 3, 41092, Seville, Spain
Email: mathieu.doussineau@ec.europa.eu / mathieu.doussineau@gmail.com
Tel.: +34 954 487 172

Name: Julia Bachtrögler-Unger
Address: Arsenal Objekt 20, 1030 Wien, Austria
Email: julia.bachtroegler-unger@wifo.ac.at.
Tel.: +43 1 798 26 01-473

EU Science Hub
https://ec.europa.eu/jrc

JRC123485

EUR 30678 EN

   PDF          ISBN 978-92-76-36247-0                ISSN 1831-9424             doi:10.2760/218779

Luxembourg: Publications Office of the European Union, 2021

© European Union, 2021

The reuse policy of the European Commission is implemented by the Commission Decision 2011/833/EU of 12 December 2011 on the
reuse of Commission documents (OJ L 330, 14.12.2011, p. 39). Except otherwise noted, the reuse of this document is authorised under
the Creative Commons Attribution 4.0 International (CC BY 4.0) licence (https://creativecommons.org/licenses/by/4.0/). This means that
reuse is allowed provided appropriate credit is given and any changes are indicated. For any use or reproduction of photos or other mate-
rial that is not owned by the EU, permission must be sought directly from the copyright holders.

All content © European Union, 2021 (unless otherwise specified)

How to cite this report: Doussineau, M., Bachtrögler-Unger, J., Exploring synergies between the EU Cohesion policy and Horizon 2020 fund-
ing across European Regions, EUR 30678 EN, Publications Office of the European Union, Luxembourg, 2021, ISBN 978-92-76-36247-0,
doi:10.2760/218779, JRC123485.
Contents

Abstract .................................................................................................................................................................................................................... 2
Acknowledgements ........................................................................................................................................................................................... 3
Executive summary ........................................................................................................................................................................................... 4
1 Introduction .................................................................................................................................................................................................... 5
2 Data and methodology ............................................................................................................................................................................ 8
       2.1 R&I funding datasets at the project level ......................................................................................................................... 9
       2.2 Taxonomy used to link Horizon 2020 and ERDF project datasets .................................................................. 10
       2.3 Measuring funding concentration ....................................................................................................................................... 10
       2.4 R&I viewer: a tool to monitor the allocation and the concentration of funding ..................................... 11
3 Synergies between EU’s R&I funding in EU regions ............................................................................................................ 15
       3.1 Is there a concentration of funding and synergies among the EU’s two main funding instruments
       for R&I activities? ..................................................................................................................................................................................... 15
       3.2 What are the most synergetic EU regions for KETs and SGCs? ........................................................................ 16
       3.3 Which technological and policy domains are the most suitable for funding concentration and
       synergies? ..................................................................................................................................................................................................... 19
       3.4 In which regions is R&I funding concentrated on specific KET and SGC? ................................................... 21
4 Discussion and conclusions................................................................................................................................................................ 26
References ........................................................................................................................................................................................................... 28

                                                                                                               i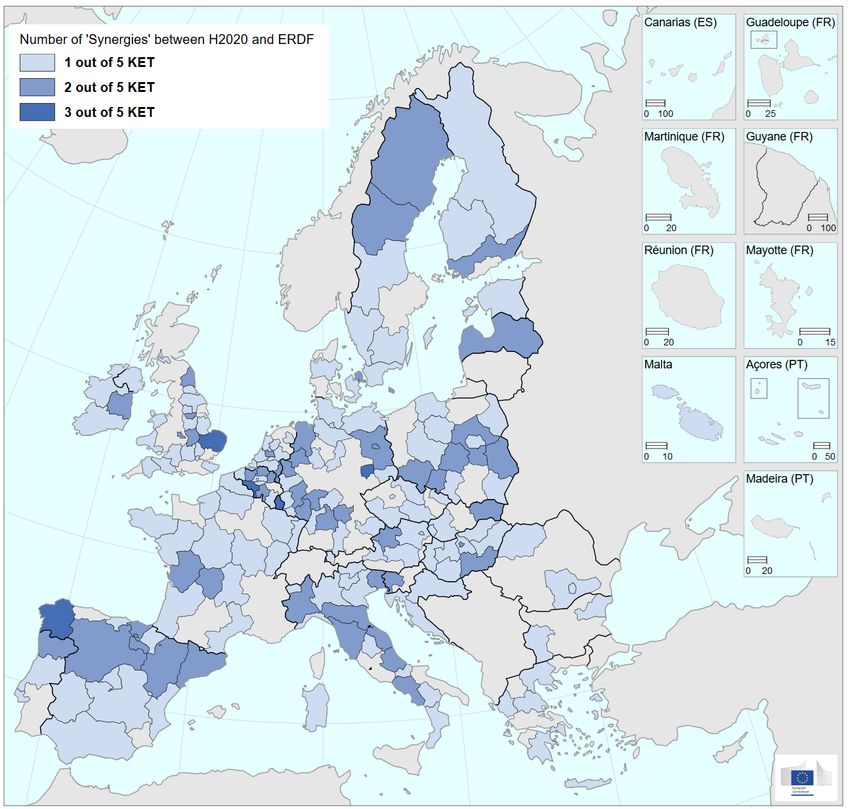
Abstract
Over the course of the 2014-2020 period, the European Union has invested more than €125bn into sup-
port to research and innovation through two main channels: the excellence-based Horizon 2020 pro-
gramme and its cohesion policy implemented through the European Structural and investment funds (ESIF)
and in particular the European Regional Development fund (ERDF). While projects funded by ESIF are se-
lected in the context of place-based operational programmes and smart specialisation strategies (S3),
Horizon 2020 grants are assigned based on the quality of the project proposals and consortia without any
geographical criteria. A concentration of R&I funding from both funding schemes in the same technological
or policy area could point to the creation of a synergy between EU funding as suggested by the concept
of smart specialisation and encouraged by the European Commission. This report uses project data to
analyse the regional distribution of Horizon 2020 and ESIF funding among key enabling technologies and
societal grand challenges and to map potential synergies between different EU funding policies.

2
Acknowledgements
The authors of this report would like to thank Nicholas Harrap, Michaela Batorova and Filipe Batista e Silva for
their valuable comments and suggestions.

Authors
Mathieu Doussineau*, Julia Bachtrögler-Unger**
*European Commission Joint Research Centre, Territorial development unit
**Austrian Institute of Economic Research (WIFO)

                                                                                                              3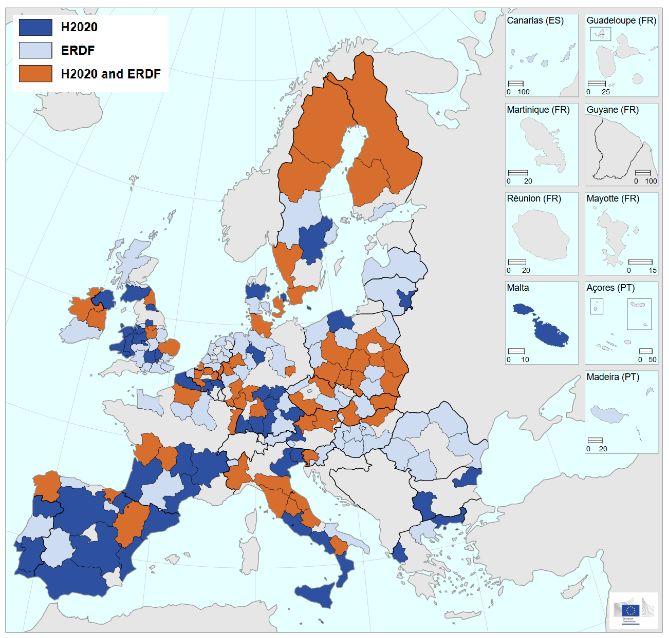
Executive summary
The European Union dedicates an increasing share of its financial resources to support research, techno-
logical development and innovation. In line with the concept of smart specialisation, regions are encour-
aged to direct European (R&I) funding towards technological, industrial or policy areas that fit or are re-
lated to regional strengths, challenges and growth potentials.
The two most important EU R&I funding instruments - Horizon 2020 and the European Regional Develop-
ment Fund (ERDF) – follow different funding principles and procedures. In line with their smart specialisa-
tion strategies, regions shall focus (ERDF) funding on specific thematic and sectoral priority areas. More-
over, regions are encouraged to exploit complementarities between the ERDF, Horizon 2020 and other
funds in order to achieve a critical mass of funding in the priority areas. Until now there is little research
on the regions’ use of European R&I funding in the multi-annual financial framework (MFF) 2014-2020.
Therefore, this report explores the distribution of ERDF co-funding for R&I activities as well as Horizon
2020 grants among European NUTS-2 regions and thematic areas. It investigates the occurrence of po-
tential synergies in regions stemming from a concentration of funding from both schemes in the same
field. This is done by using a new dataset including detailed information on projects co-funded by the ERDF
in 2014-2020 that is enriched by assigning key enabling technologies (KET) and societal grand challenges
(SGC) in order to bridge ERDF funding data with the CORDIS database of Horizon 2020 projects.
The analysis covers Horizon 2020 and ERDF grants allocated between 2014 and 2019 to thousands of
organisations located in the 281 European NUTS-2 regions. In terms of funding, the range of projects
considered in the analysis represents more than €60bn of R&I funding provided. Using the average the-
matic distribution of funding in EU regions as a benchmark, the analysis reveals substantial differences
among regional funding concentration profiles concerning technology and policy areas. Comparing the two
funding instruments, a larger share of regions concentrates Horizon 2020 funding in specific key enabling
technologies, while ERDF funding is more often concentrated on projects addressing certain societal grand
challenges.

However, the findings indicate substantial differences among the frequency of regional funding concen-
trations in specific technology and policy areas. Characteristics of the technology or policy areas, such as
distance to the market the relatedness to a certain industry or the need for the presence of an industrial
ecosystem (e.g. transport or security), seem to play an important role.

The analysis shows that the KET for which the most synergies are observed across EU regions are those
closest to the market (advanced manufacturing and processing, advanced materials and ICT). With regards
to SGC, the areas related to Clean Energy, Food Security and Environment are the most implemented
across EU regions. By contrast, it seems that only a limited number of EU regions concentrate the R&I
funding available to them on technological and policy areas linked to traditional industries and requiring
more pre-existing industrial assets, such as Clean Transport and Security. The mapping of synergies be-
tween ESIF and Horizon 2020 proposed in this report suggests that some KET and SGC not only fit well
the funding logic of Horizon 2020 but also the funding requirements and priorities of EU cohesion policy
(ERDF), particularly, the increase of R&I capacities or the support to SMEs.

Creating synergies between EU funding and policies also is an objective in the new programming period
2021-27. In the Conclusions of a special meeting of the Council in July 20201, it is stated for the Horizon
Europe programme that “particular attention will be paid to the coordination of activities through Horizon
Europe with those supported under other Union programmes, including through cohesion policy. In this
context, important synergies will be needed between Horizon Europe and the structural funds for the pur-
pose of ‘sharing excellence’, thereby enhancing regional R&I capacity and the ability of all regions to de-
velop clusters of excellence”. The beginning of the new MFF 2021-2027 is an opportune moment to learn
from past experiences and to improve and adapt public intervention in the field of R&I for better address-
ing future needs.

1
    https://www.consilium.europa.eu/media/45109/210720-euco-final-conclusions-en.pdf

4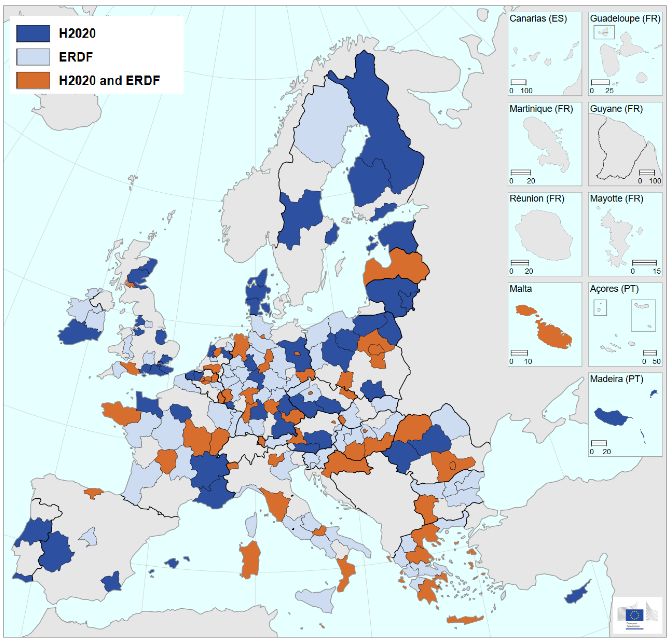
1       Introduction
The combination of funding and financing sources aimed at creating synergies is a challenge that the
European Commission is encouraging and supporting through the provision of guidelines and various ini-
tiatives. Following an initiative of the European Parliament, the Joint Research Centre (JRC) and the Direc-
torate General for Regional and Urban Policy (DG REGIO) launched the Stairway to Excellence (S2E) Pilot
Project in 2014. Throughout the project duration which ended in 2020, S2E was centred on the provision
of assistance to EU Member States and regions with the aim of contributing to closing the innovation gap
through the creation of synergies between EU funding. This report aims at providing an overview of po-
tential synergies between EU funding by exploring the allocation of research and innovation (R&I) grants
across EU regions.
The “Lamy” report published in 2017 argued that the numerous EU funding schemes illustrate the lack of
a systemic and coordinated R&I policy at the EU level. It is crucial, according to the report, that the post-
2020 EU R&I programme and future structural funds are designed from the beginning with complemen-
tary, mutually reinforcing and inter-operable intervention logics. However, some academics argue that EU
R&I policy and EU cohesion policy follow distinct goals and can hardly coexist harmoniously. The conven-
tional objective of R&I excellence needs to be complemented by a broader and more complex approach to
generate place-based innovation ecosystems: the concept of European 'excellence' supported by the Hori-
zon framework programme should be complemented with regional 'relevance’ (Foray, Morgan & Radose-
vic, 2018).
The support of research and innovation (R&I) has been an important priority of EU policies in the multi-
annual financial framework (MFF) 2014-2020 - and will become even more relevant in the future. The
largest amounts of funding for R&I activities were allocated through the Horizon 2020 programme, which
provides €80bn for excellence-based projects in specific thematic areas, and through the European Struc-
tural and Investment Funds (ESIF), of which €43.2bn2 have been allocated to EU regions to support
strengthening research, technological development and innovation in order to foster smart and sustainable
growth. The European Regional Development Fund (ERDF) is the major funding instrument of R&I activities
in the context of EU cohesion policy (ERDF represents 95% of ESIF R&I funding allocations). Given the
design of these main R&I funding schemes, the objective of the EU is twofold: First, to strengthen European
excellence in science and technology by improving cross-border collaboration between the most appropri-
ate European organisations, and second, to support the competitiveness of EU regions by promoting intel-
ligent, inclusive and sustainable growth.
European R&I funding distributed across European regions should be targeted to relevant technological
fields and socio-economic challenges and, especially concerning the ERDF, tailored to region-specific
needs, existing local strengths and identified opportunities in R&I. The excellence-based rationale of Hori-
zon 2020 supporting European “champions” and the purpose of the ERDF as part of EU cohesion policy,
which aims to support EU regions in closing the R&I gap between them and more advanced regions, should
ideally complement each other. However, the differences in funding principles and objectives, considering
the excellence of project proposals and consortia in the case of Horizon 2020 granting and regional prior-
ities in the case of ERDF project selection, could also lead to unintended discrepancies in achieving the
overall objective of increasing innovation activities and output (see e.g. Foray et al. 2018B).3
With the aim to address socio-economic challenges and opportunities faced by EU regions, the concept of
smart specialisation strategies (RIS3) is based on identifying specific priority areas in which regional com-
petitive advantage can be exploited and further developed, considering local conditions, economic activity

2
    Open Data Portal for the ESIF, DG REGIO (accessed: 23 January 2021).
3
    Refer to Foray et al. (2018A, 2018B) for a discussion on the embeddedness of R&I policy within the framework of cohesion
       policy.

                                                                                                                          5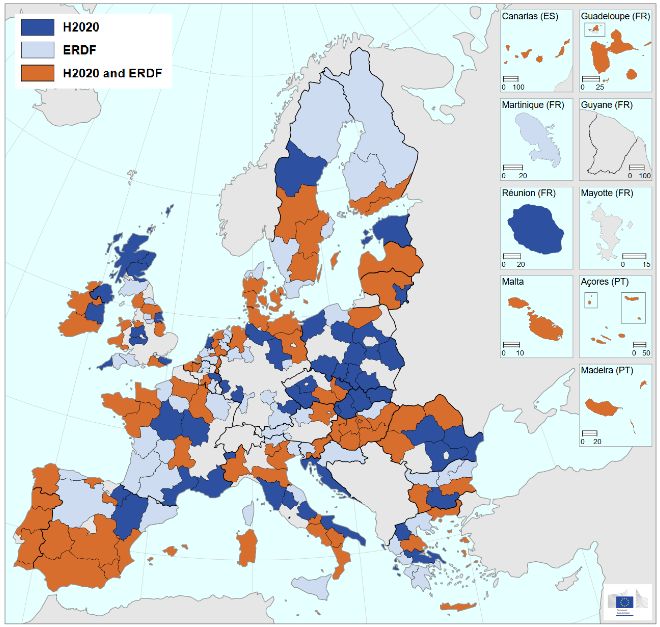
and knowledge. In practice, specialisation areas selected by regions in their RIS3 cover a wide range of
technology and policy areas corresponding to place-based assets and needs (McCann and Ortega-Argilés
2016). Though, there is also evidence that priorities set in RIS3 often do not sufficiently consider local
conditions but mimic those from other regions (Di Cataldo et al. 2020).
In order to achieve a critical mass of financial support targeted at selected priorities and corresponding
actors, the implementation of RIS3 should target complementarities among different funding instruments,
such as Horizon 2020 and ERDF, despite different funding principles, rules and legal frameworks (European
Commission 2014). The successful combination of different funding sources is expected to contribute to
enhancing innovation in specific priority areas as well as the overall success of the EU’s (regional) R&I
policy. Therefore, the European Commission encourages regions to develop strategies for combining fund-
ing instruments to possibly exploit synergies already at the beginning of a funding period (Foray et al,
2012). Ideally, strategic funding synergies should be planned or at least envisaged at the design phase of
the RIS3 strategies by involving and informing relevant actors about Horizon 2020 and ERDF funding
opportunities and e.g. by supporting innovative firms in their applications for certain Horizon 2020 calls.
In accordance with the place-based approach of smart specialisation, there is no universal concept for
combining different EU R&I funding schemes in an optimal way, as differential funding profiles of EU
regions concerning the individual funding schemes as well as the diversity of EU regions in terms of eco-
nomic development and institutional settings need to be taken into account.4
Since 2014, thousands of projects and R&I activities have been supported through both the Horizon 2020
framework programme and cohesion policy. A comprehensive monitoring system of RIS3 as well as de-
tailed information on the usage of EU (R&I) funding, in their own but also in other European regions, would
help managing authorities to monitor the allocation of funding to thematic areas fuelling their respective
RIS3, and to better evaluate and update their strategies in view of the upcoming next programming period.
This report uses a novel dataset of R&I-related projects co-funded by the ERDF as well as data on Horizon
2020 projects in 281 European NUTS-2 regions to explore synergies between EU R&I funding schemes.5
Therefore, in a first step, the distribution of ERDF and H2020 funding among thematic areas, depicted by
key enabling technologies and societal grand challenges, is analysed. Within the Horizon 2020 programme
framework, calls for project proposals are organised around the key enabling technologies (KET) and so-
cietal grand challenges (SGC) to be addressed. KETs are expected to play a major role in facing societal
grand challenges such as climate change (Montresor and Quatraro 2015), and allow recombining given
technological capabilities for innovation (see e.g. Frenken et al. 2012). Therefore, regions are encouraged
to focus on them in their RIS3 and thus also in the distribution of ESIF6, which encourages the use of KETs
and SGCs as an analytical framework for the thematic analysis of R&I activities co-financed by ERDF and
Horizon 2020 (see also European Commission 2012, Sörvik & Kleibrink 2015). Although European R&I
funding only mirrors a part of financial support for R&I activities in the Member States, a concentration of
ERDF or Horizon 2020 funding in (a few) specific areas would be in line with the rationale of smart spe-
cialisation.
In a second step, it is investigated whether potential synergies between ERDF and Horizon 2020 funding
exist by focusing on the same specific areas occur in NUTS-2 regions. A synergy between funding is con-
sidered when a concentration of funding is observed for both sources in the same area. From a policy

4
   The European Commission provides methodological guidelines to public authorities and to final beneficiaries (European
      Commission 2015) that are either generic (European Commission, 2014) or relate to specific thematic areas. Moreover,
      the Stairway to Excellence (S2E) pilot project initiated by the European Parliament and co-implemented by the JRC and
      DG for Regional and Urban Policy in 2014 assists regional and national authorities in the implementation of synergies
      between funding (Doussineau et al 2018, Perez et al 2014, Ozbolat et a, 2018, Haegeman et al 2018).
5
  In the following, the Nomenclature of territorial units for statistics (NUTS) 2016 is considered.
6
  Indeed, according to information provided by the smart specialisation platform, 60% of regions registered in the platform
      have specified at least one KET as area of specialisation (Sörvik et al 2013).

6
perspective, this may either confirm the selection of a (related) priority area or inform policy makers about
a potential new priority to be considered in the S3 strategy. Moreover, detecting potential synergetic areas
allows to identify innovative and competitive actors that successfully applied for Horizon 2020 grants and
are also benefiting from ERDF support.
This report does neither aim at evaluating the success of regional R&I funding strategies (relative to other
regions) nor at its alignment with the content of RIS3. Its objective is to analyse – and map results -
whether regions, relative to the EU average distribution, concentrate their ERDF funding on projects in the
field of specific technological and policy areas, as the smart specialisation concept suggests, and whether
potential synergies with Horizon 2020 in supporting R&I activities in the same thematic area occur. This
exercise hopes to feed future research on how synergies and the concentration of EU funding influence
EU policy effects and whether they promote regional growth and development.
The remainder of this report is structured as follows: Section 2 introduces the methodological approach
applied in order to create a link between a newly created dataset of ERDF beneficiaries and Horizon 2020
beneficiaries. More specifically, Section 2.1 briefly introduces the R&I funding project-level datasets used,
and Section 2.2. outlines the taxonomy based on which KET and SGC were assigned to ERDF projects.
Section 2.3 describes the calculation of the location quotient which is used to identify specialization pat-
terns. Section 2.4 presents descriptive statistics of the data and introduces the R&I viewer available online
at the Smart Specialization platform. Section 3 shows the results of the analysis of synergies in European
NUTS-2 regions and Section 4 concludes.

                                                                                                           7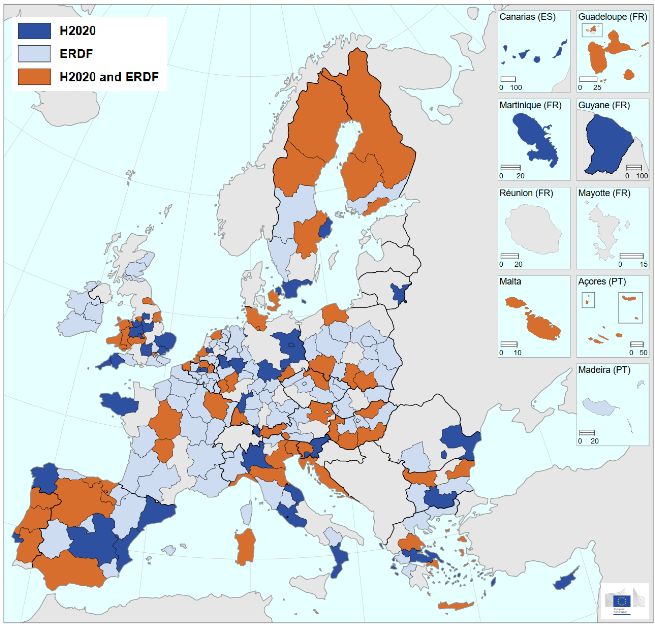
2       Data and methodology
Three main components are necessary to analyse the concentration of European R&I funding and syner-
gies: First, a Horizon 2020 and an ERDF dataset gathering information about funded projects. Second, a
common taxonomy describing technological and policy areas linking the two datasets, and third, an indi-
cator depicting concentration of funding and therefore usable to identify synergies across funding
schemes.
Figure 1 shows the steps taken from raw project datasets to the mapping of synergies, including the
design of a data visualisation web-platform7 to better understand the use of EU funding by regions:
       1. Collect and/or design datasets of ERDF and H2020 funding (Section 2.1)
       2. Choose of a common taxonomy to link dataset (Section 2.2)
       3. Define an indicator to measure the concentration of funding (Section 2.3)
       4. Design an analytical framework to visualize the data (Section 2.3)
       5. Visualize and map results (Sections 3 & 4)

Figure 1 Synoptic overview of the methodological approach

           Datasets               Taxonomy                      Indicator                    Analytical           Mapping
                                                                                            Framework       (& Data visualisation)
                                                                     LQ KET 1   0/1
                                                                     LQ KET i   0/1 Four possible cases
                                  5 KETs           LQ (KETs)                        for each KET or
          H2020                                                                     SGC and for each
                                  7 SGCs           LQ (SGCs)         LQ SGC 1   0/1 NUTS-2 region:
                                                                     LQ SGC i   0/1    1_No concentration
                                                                                       2_H2020 only             Mapping of
                                                                                       3_ERDF only             funding con-
                                                                                       4_H2020 & ERDF         centration and
                                                                                                                 synergies
                                                                     LQ KET 1   0/1
                                                   LQ (KETs)         LQ KET i   0/1
                                  5 KETs
       ERDF (R&I)                                  LQ (SGCs)
                                  7 SGCs                            LQ SGC 1    0/1
                                                                     LQ SGC i   0/1

    Design of ERDF Operations dataset            Location quotient: Funding concentration
                                                 indicator
                                Assignment of KETs and SGC to ERDF op-
                                erations through text analysis

Source: Own elaboration.

7
    R&I Regional Viewer: https://s3platform.jrc.ec.europa.eu/synergies-tool.

8
2.1 R&I funding datasets at the project level
In order to explore synergies between the Horizon 2020 framework programme and the ERDF, detailed
thematic and geographical information on funded projects is required.
The Horizon 2020 programme is centrally managed by the DG Research & Innovation of the European
Commission. Information concerning projects and beneficiaries is gathered in a structured dataset, the
CORDIS database.8 Regarding ERDF, data on projects and beneficiaries is collected and published by
individual national or regional managing authorities in EU member States. Therefore, a recently compiled
structured database by the JRC Seville based on lists of operations co-funded by the ERDF is used9.
Information on ERDF operations is provided by regional or national public authorities managing operational
programmes, as required by Article 115(2) of the common provisions regulation in Regulation (EU) No.
1303/2013), by June 2019. INTERREG projects centrally reported in the KEEP database10 are also
considered. In order to standardise and enrich the data, project names and descriptions are translated into
English and beneficiary names linked with business data. Based on the ESIF categories of intervention11
(intervention field), projects are defined as related to R&I or not (see Bachtrögler et al. 2020 for a detailed
documentation of the dataset).12
To create a thematic link with Horizon 2020 project data, key enabling technologies (KET) and societal
grand challenges (SGC) are assigned to R&I projects co-funded by the ERDF based on project descriptions
(refer to Section 2.2 for more details). As an additional link, name matching of ERDF and Horizon 2020
beneficiaries allows for the identification of organisations profiting from both schemes, which could be
important for further analyses on the usage of different funding instruments within the same beneficiary
firm or institution. The dataset of R&I-related projects co-financed by the ERDF as well as the dataset of
Horizon 2020 projects, together with descriptive analysis, can be explored in the R&I regional viewer
provided by the S3 Platform which is introduced in Section 2.4 of this report.
For beneficiaries supported by both schemes, information on the project location (NUTS regions), the
amount of allocated EU support (for some ERDF projects, total eligible expenditure and EU co-financing
rates) as well as thematic information (KET and SGC in the case of Horizon 2020, categories of intervention
for the ERDF) is reported. To link the two datasets at the level of beneficiaries, beneficiary names of ERDF
projects are matched with those of Horizon 2020 beneficiaries. This allows to get first insights on the
frequency of firms or organisations successfully applying for research funding from both schemes.
In total, the Horizon 2020 dataset analysed consists of 8,393 projects gathering 73,749 participations
(grants) from 2014 to October 2019. For the analysis, only projects that relate to the five key enabling
technologies and the seven societal grand challenges are considered. In terms of funding, this selection
covers 56% of the total Horizon 2020 funding amount13 (€26.4bn). The ERDF dataset includes more than
84,000 projects that were classified as R&I-related based on the categories of intervention as reported
8
Source: CORDIS Horizon 2020 dataset, EC DG Research & Innovation.
Note: Other measures than project grants funded by Horizon 2020, such as ERC grants or Marie S. Curie Actions, are not
considered in the analysis.
9
Bachtrögler, J., Doussineau, M., Reschenhofer, P., Dataset of projects co-funded by the ERDF during the multi-annual fi-
nancial framework 2014-2020, Publications Office of the European Union, Luxembourg, 2020, ISBN 978-92-76-
18860-5, doi:10.2760/491487, JRC120637.
10
See website https://keep.eu/.
11
Commission Implementing Regulation (EU) No 215/2014 of 7 March 2014.
12
Categories of intervention defined as R&I related comprise R&I processes in large enterprises and SMEs, Investment in
infrastructure, capacities and equipment in small and medium-sized enterprises (SME) and large enterprises directly
linked to R&I activities, Public and private R&I infrastructure, R&I activities in research centres, Technology transfer and
university-enterprise cooperation as well as cluster support and business networks primarily benefiting SMEs, Cluster
support and business networks, etc. (Bachtrögler et al. 2020, pp. 7 f.).
13
The other share of the H2020 budget mostly comprises ERC grants (20%) and Marie Sklodowska-Curie Actions (10%),
9by regional (or national) managing authorities from 2014 to June 2019. This corresponds to a total ERDF
amount of €35.3bn and represents a share of 86% of ERDF funding dedicated to the thematic objective
Research & innovation14. As this analysis can only take into account projects that could be assigned a KET
or SGC, the amount of funding considered in the analysis is slightly reduced (€30.1bn).
2.2 Taxonomy used to link Horizon 2020 and ERDF project datasets
A same technology and a policy taxonomy are used to analyse the concentration of both sources of funding
in order to bridge the two datasets and identify synergies. KETs and SGCs areas are assigned, when
possible, to ERDF projects through text analysis of project titles and descriptions. With regards to the
technology taxonomy, the list of keywords adopted by the Knowmak platform (https://www.knowmak.eu/)
and based on an ontological approach serves as basis for the assignation of KETs and SGCs to ERDF
operations. There can be one or more KET or SGC or none assigned to a single project. In this analysis, we
consider five KETs representing an important component of Horizon 2020 through the ‘Leadership in
Enabling and Industrial Technologies’ (LEIT)15. Concerning the policy taxonomy, the seven societal grand
challenges as defined in the Horizon 2020 programme constitute a cross-cutting policy dimension
completing the technological one. The challenges reflect the policy priorities of the Europe 2020 strategy
and cover activities from research to market with a new focus on innovation-related activities, such as
piloting, demonstration, test-beds, and support for public procurement and market uptake16. In total,
44.7% of ERDF operations are found to be related to at least one key enabling technology and 72.8% to
at least one societal grand challenge. The technological areas considered are the following:
- EU.2.1.1 Information and Communication Technologies (ICT)
- EU.2.1.2 Nanotechnologies
- EU.2.1.3 Advanced materials
- EU.2.1.4 Industrial biotechnologies
- EU.2.1.5 Advanced manufacturing and processing
The policy taxonomy (SGC) is structured as follows:
- EU.3.1 Health, demographic change and wellbeing
- EU.3.2 Food security, sustainable agriculture and forestry, marine and maritime and inland water
research and the bioeconomy
- EU.3.3 Secure, clean and efficient energy
- EU.3.4 Smart, green and integrated transport
- EU.3.5 Climate action, environment, resource efficiency and raw materials
- EU.3.6 Europe in a changing world - inclusive, innovative and reflective societies
- EU.3.7 Secure societies - protecting freedom and security of Europe and its citizens
2.3 Measuring funding concentration
In this report the location quotient (LQ) is used to quantify differences in the regional distribution of Eu-
ropean R&I funding to specific technological or policy areas relative to the EU average distribution.17 Thus,
it allows to i
14
Open Data Portal for the ESIF, DG REGIO (accessed: 13 April 2021). The usage of the remaining share of ERDF funding is
expected to be reported by managing authorities in future lists of operations.
15
A European strategy for Key Enabling Technologies – A bridge to growth and jobs’ European Commission, 2012, 341 final
16
https://ec.europa.eu/programmes/horizon2020/en/h2020-section/societal-challenges.
17
The location quotient (Florence 1939) was introduced by Sargent Florence (1939) in his “Theory of Location” and has
been developed by Billing and Johnson (2012) as an estimator of industrial concentration. Location quotient is equiv-
alent to the revealed comparative advantage which is an index used in international economics for calculating the
relative advantage or disadvantage of a certain country in a certain class of goods or services as evidenced by trade
flows. It is based on the Ricardian comparative advantage concept.
10nvestigate whether a region concentrates relatively large amounts of funds on a certain area as compared
to the EU average.
For the purpose of this analysis, we consider it as a specialisation of (European R&I) funding if a region
dedicates a larger share of Horizon 2020 and ERDF funding, respectively, on a specific technological or
policy field than this is the case at the European level. In case project funding under both funding schemes
is concentrated in the same area, we assume this to potentially generate a synergy between Horizon 2020
and ERDF funding.18
The location quotient is calculated as follows:
LQi = (Xi,j/∑Xj) / (Xi,EU/∑XEU)
Where:
-LQi= Location quotient for area I (KET or SGC)
-Xi,j = total funding allocated to area i by region j
-∑Xj = total funding allocated in region j
-Xi, EU = total funding allocated to area i in the EU
-∑XEU = total funding allocated in the EU
To investigate the degree of specialisation in European R&I support in the 281 NUTS-2 regions of the EU,
the LQ is calculated for each KET and SGC, and each source of funding, considering the corresponding EU-
wide distribution as a benchmark, i.e. a threshold value of 1.19 For the purpose of this analysis, a concen-
tration of funding is defined according to the following criteria:
- A LQ greater than 1 implies a concentration of funding in a given area (the relevant share of
funding in the region is higher than the EU reference.
- An LQ equal to 1 means that the share of funding in the given area is equal to the share at the
EU level.
- An LQ smaller than 1 means that the share of funding in the region is lower than at the EU
reference level.
Based on calculated location quotients, Table 1 summarises four cases which characterise the distribution
of R&I support available within EU regions. Case number 4 is particularly interesting as it flags a concen-
tration of funding in both Horizon 2020 and ERDF, thereby pointing to the possible exploitation of synergies
between European R&I policy instruments.
Table 1 The 4 possible cases of concentration of funding for an Area (KET or SGC) in a given NUTS 2 region
Case Definition LQ H2020 >1 (concentration) LQ ERDF>1 (concentration)
Case 1 No concentration no no
Case 2 Concentration of funding in H2020 yes no
and not in ERDF
Case 3 Concentration of Funding in ERDF no yes
and not H2020
Case 4 SYNERGY: concentration of funding yes yes
in both programmes
2.4 R&I viewer: a tool to monitor the allocation and the concentration of funding
18
Although national R&I funding programmes are not considered in this analysis, a concentration of EU-funded R&I inter-
ventions in a certain technological or policy field can be expected to point to regional R&I funding specialisation. Note
that this report does not go into detail regarding the content of R&I activities funded, and therefore cannot take into
account possible overlaps or a duplication of funding.
19
Obviously, if we consider 1.05 or a larger value as a threshold value, the number of synergies found will decrease. To get
a first overview of potential (thematic) synergies between the European main R&I funding schemes, this report sticks
to the benchmark value of 1.
11The S3 web Platform hosted by the JRC Seville assists EU countries and regions in developing, implement-
ing and reviewing their RIS3. Established in 2011, following the Communication on "Regional Policy con-
tributing to smart growth in Europe 2020", the role of the S3 Platform is to provide information, method-
ologies and advice to policy makers offering a knowledge repository of guidelines and methodologies
tackling various components of the concept (ie. interregional collaboration, monitoring & evaluation), and
also good practices collected since 2014. In addition, the S3 platform provides a set of web-tools allowing
policy makers to better monitor and benchmark their respective territories in the EU regional context.
Among the web-tools available on the S3 platform, the R&I regional viewer (available at https://s3plat-
form.jrc.ec.europa.eu/synergies-tool) provides two dashboards proposing a set of indicators, maps and
graphs based on dataset of projects funded by Horizon 2020, on the one hand, and by ERDF, on the other
hand. The tool offers the possibility to visualise and compare investments under different funding channels
of EU programmes across EU regions (at NUTS level 1, 2 and 3). Benchmarking is also possible considering
any selection of regions from a scroll down menu placed on top of the dashboards or directly on the map.
This first version of the R&I viewer is composed of two distinct dashboards dedicated to respectively
Horizon 2020 and ERDF. The two dashboards follow the same structure:
1-Territorial information (EU contribution)
2-Thematic & specialisation information (specialisation indicators and thematic distribution)
3-Project and beneficiary information (lists of projects and beneficiaries)
Information on the specialisation of funds is based on the methodological approach outlined in this report.
The content within each section of the dashboard varies according to the availability of information. In-
formation on projects supported through the Horizon 2020 programme appears to be more comprehensive
than the one for ERDF projects, particularly regarding the type of beneficiaries (e.g. University, Public re-
search centre, Private company including SME).
Figures 2 provides a synoptic overview of the three sections of the Horizon 2020 and ERDF dashboards. It
provides a description of the information for each source of funding and indicates the variables bridging
the two datasets for each section: Territories (NUTS regions) for first, thematic (KET and SGC) for the
second, and beneficiaries for the third one. The screenshot pictured in Figure 3 shows the dashboard.
12Figure 2 Synoptic view of the R&I viewer
Horizon 2020 dash- S3 platform ERDF Dashboard
board
0. Origin of data: funding R&I viewer 0. Origin of Data: Allocation
granted from 2014 to (2 dashboards) of R&I-related ERDF
October 2019. Indica- funding (incl. Interreg
tors and figures are projects) over the period
based on the amount of 2014- 2019 (as re-
funding captured by Horizon 2020 ERDF ported by June 2019).
beneficiaries in the re- Data source are lists of
gions. The source of the operations published by
data is DG for Research managing authorities as
& Innovation of the Eu- well as the KEEP data-
ropean Commission. base of Interreg projects.
1. Key performance indi- 1. Key performance indica-
cators and histograms tors and histograms
about the amount and about the amount and
shares of H2020 contri- 1.Territorial in- 1.Territorial in-
shares of ERDF funding
bution and shares of formation formation contribution allocated to
SME participants. The NUTS EU Regions. The (first)
(first) filter linking the Levels 0 filter linking the ERDF to
to 3
H2020 to the ERDF the H2020 dashboard is
dashboard is the re- the region(s) selected by
gion(s) selected by the the user (at NUTS level
user (at NUTS level 0,1,2 or 3)
0,1,2 or 3)
2. Information based on 2. Information based on
the distribution of the distribution of ERDF
H2020 funding in the funding in the R&I re-
sections of the pro- 2. Thematic & 2. Thematic & lated categories of inter-
gramme. The speciali- specialisation specialisation ventions. The specialisa-
information 5 KET, information
sation analysis covers 5 7 SGC tion analysis covers the
key enabling technolo- same key enabling tech-
gies and the 7 societal nologies and societal
grand challenges and grand challenges as the
uses the location quo- H2020 dashboard. A
tient. Specialisation is depicted
by the concentration of
funding in using the lo-
cation quotient.
3. Information on projects 3. Information on projects
and beneficiaries: pro- and beneficiaries: project
ject acronyms and ti- acronyms and titles and
tles and beneficiaries 3. Projects & 3. Projects & beneficiaries’ names lo-
names based in the se- Beneficiaries Beneficiaries cated in the selected re-
lected region(s) and information H2020 information gion(s) and their ERDF
their H2020 funding PIC in use funding allocation. Ben-
allocation eficiaries of ERDF are
identified and weblink
towards H2020 partici-
pant portal is provided.
13Figure 3 Screenshot of the R&I viewer (H2020 regional dashboard) 1 Territorial information 2 Thematic & specialisation information 3 Projects & beneficiaries information 14
3     Synergies between EU’s R&I funding in EU regions
In the following, results on EU funding synergies between Horizon 2020 and the ERDF in the support of
specific thematic areas are discussed. First, we analyse the thematic distribution of EU R&I funding pro-
vided by the ERDF or Horizon 2020, in particular, whether a concentration of funding in specific areas
relative to the EU average occur. This would be in line with the concept of smart specialisation and, at the
same time, is a prerequisite for a synergy among both schemes (Section 3.1). Second, the number of
synergies as well as thematic specialisations of either the ERDF or Horizon 2020 in technological and
policy areas is visualised in a map of EU regions (Section 3.2). Third, we have a closer look at individual
KET and SGC to see whether a relative concentration of funding is more likely concerning specific fields
and specific funds (Section 3.3). Finally, we investigate the regional distribution of specialisations of fund-
ing in certain areas (Section 3.4).

3.1 Is there a concentration of funding and synergies among the EU’s two main
    funding instruments for R&I activities?
Calculating location quotients for each region, technology and policy area, respectively, according to equa-
tion (1) indicates that there is a specialisation of Horizon 2020 funding relative to the EU average in at
least one thematic field in almost every (up to 277 of 281) European NUTS-2 region. Likewise, also ERDF
funding is concentrated on at least in one thematic area in most regions.
To give an example, Table 3 shows the LQ calculated for each KET and SGC, considering Horizon 2020 and
ERDF funding, respectively, in the Austrian region of Upper Austria. Unilateral concentration of ERDF fund-
ing relative to the EU average can be observed in the technological areas of EU.2.1.3 (Advanced materials),
EU.2.1.4 (industrial biotechnologies) and EU 2.1.5 (Advanced manufacturing and processing). Horizon 2020
funding in the region also focuses on advanced materials and advanced manufacturing and processes,
suggesting a possible exploitation of synergies between the two funding schemes. These thematic syner-
gies reflect the economic structure of Upper Austria, where more than a quarter of workers are employed
in the manufacturing sector (Piribauer et al. 2020) and point to the implementation of a place-based R&I
policy. Regarding SGC, one synergy among funding schemes is detected in the area of EU 3.3 (secure, clear
and efficient energy). Furthermore, a location quotient greater than 1 is found for ERDF funding in the
policy areas EU 3.2 (Food security, agriculture and forestry, marine water research and the bioeconomy)
and EU 3.5 (Climate action, environment, resource efficiency and raw materials), and for Horizon 2020
funding in Upper Austria in the field of smart green and integrated transport (EU 3.4).
Table 2 Example of Location Quotients in Upper Austria (AT31)
                                                       ERDF                                    Horizon 2020
     Area                                    LQ           Concentration                 LQ            Concentration
    codes    (shortened) Area labels                        (yes/no)                                     (yes/no)
 EU.2.1.1.   ICT                            0.569               No                     0.722               No
 EU.2.1.2.   Nanotechnologies               0.566               No                     1.968               Yes
 EU.2.1.3.   Advanced materials             1.177               Yes                    1.599               Yes
 EU.2.1.4.   Industrial biotech             1.055               Yes                    0.244               No
 EU.2.1.5.   Adv. Manufacturing& proc.      2.095               Yes                    1.818               Yes
  EU.3.1.    Health                         0.637               No                     0.125               No
  EU.3.2.    Food                           1.668               Yes                    0.364               No
  EU.3.3.    Energy                         1.473               Yes                    2.190               Yes
  EU.3.4.    Transport                      0.990               No                     1.934               Yes
  EU.3.5.    Climate                        1.035               Yes                    0.195               No
  EU.3.6.    Society                        0.866               No                     0.090               No
  EU.3.7.    Security                       0.410               No                     0.120               No
Source: ERDF dataset of R&I-related projects (Bachtrögler et al. 2020a), CORDIS database of Horizon 2020 projects, own
calculation. Total # of regions: 281.
Table 2 presents descriptive statistics based on the location quotients (LQ) calculated for each technology
and policy area (five KETs and seven SGCs). In 261 regions, Horizon 2020 grants are concentrated in at

                                                                                                                      15
least one technological area, which points to the existence of competitive actors and favourable conditions
for research in the respective field. Even in 277 regions, Horizon 2020 funds are specialised in at least
one societal grand challenge. Also, regarding the ERDF, there are only six (five) out of 281 NUTS-2 regions
for which no relative concentration of funding on at least one KET (SGC) is found (LQ > 1). The mean of
the location quotients is notably larger for the Horizon 2020 scheme than in the case of the ERDF, which
indicates a more pronounced average concentration of Horizon 2020 funding in the regions.20
The total number of specialisations in a certain KET or SGC ranges from 571 (Horizon 2020) to 610 (ERDF)
for KET, from 840 to 896 for SGC. This implies that regions concentrate their R&I funds on, on average,
two technological areas and on three policy areas, respectively.
Table 3 Concentration of funding in KET and SGC among Horizon 2020 and ERDF funding: Descriptive statis-
tics of the location quotient (LQ) based on 281 NUTS-2 regions
ERDF Horizon 2020
Avg LQ Std. Min Max ∑ of ∑ of regions Avg LQ Std. Dev Min Max LQ ∑ of ∑ of regions
Dev LQ LQ LQ LQ>1 with at least LQ LQ LQ>1 with at least
one LQ >1 one LQ >1
KET 1.11 0.84 0 10.23 610 275 1.44 1.75 0 23.73 571 261
SGC 1.02 0.55 0 6.27 896 276 1.20 1.15 0 11.37 840 277
Source: ERDF dataset of R&I-related projects (Bachtrögler et al. 2020a), CORDIS database of Horizon 2020 projects, own
calculation. Total # of regions: 281.
Having a look at location quotients reported for KET on the one hand, and SGC on the other hand, it turns
out that there are more specialisations concerning the societal grand challenges. As these policy areas are
formulated relatively broadly, it appears intuitive that there are more projects related to those than to
more specifically defined KET. However, similar to the comparison of the extent of funding among Horizon
2020 and ERDF, the average intensity of the specialisation on a specific technological area is notably
larger than the average one on a particular policy area, especially when considering Horizon 2020 funds
(LQ of 1.44 as compared to 1.20 for Horizon 2020, LQ of 1.11 as compared to 1.02 for the ERDF).
If there is a funding concentration of both Horizon 2020 and the ERDF in the same area, we speak of a
(potential) synergy. In total, there are 625 synergies with regard to KET and SGC across all European
regions. More than 60% (382) of them refer to a policy area (SGC), 243 to a technological area. Thereby,
at least one R&I funding synergy in a technological field is detected in 182 NUTS-2 regions, and at least
one synergy in a policy area in 236 regions.
3.2 What are the most synergetic EU regions for KETs and SGCs?
In almost each European region, concentration of ERDF and Horizon 2020 funding is detected with regard
to, at least, one specific technological or policy area. However, only 122 out of 281 European NUTS-2
regions focus ERDF funds available to them on R&I-related projects in at least one specific technological
field(s) also supported intensely by Horizon 2020; 56 regions are found to have focused funding by both
the ERDF and Horizon 2020 on two or even three technological fields (see Map 1). Furthermore, in 126
regions a possible funding synergy between ERDF and Horizon 2020 is found concerning (at least) one
societal grand challenge. Referring to policy areas, also the maximum number of possible synergies arising
in one region is higher (see Map 2).
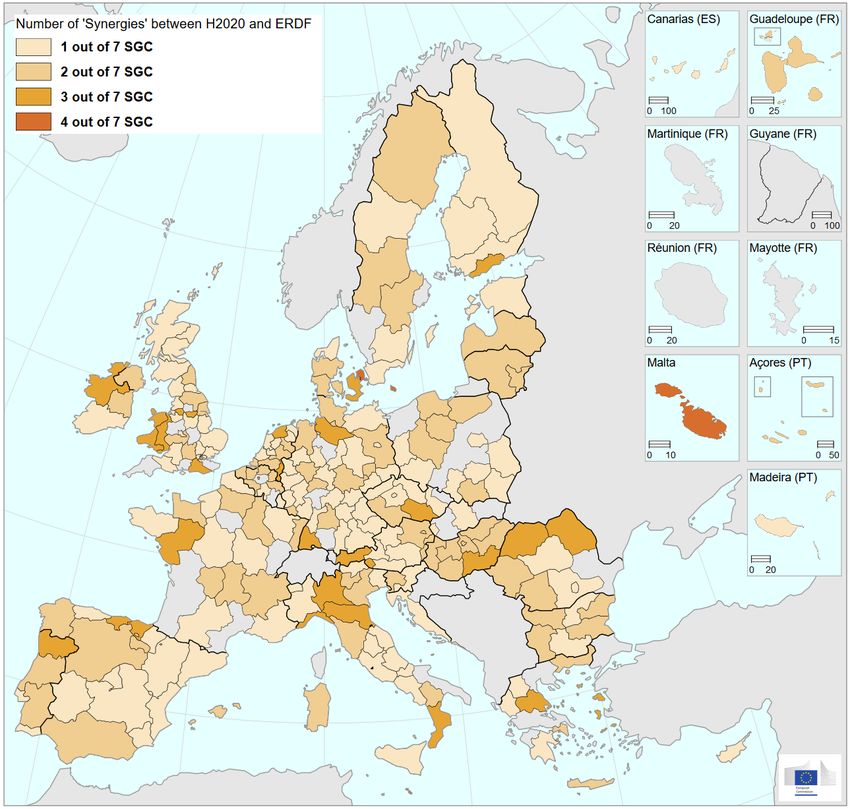
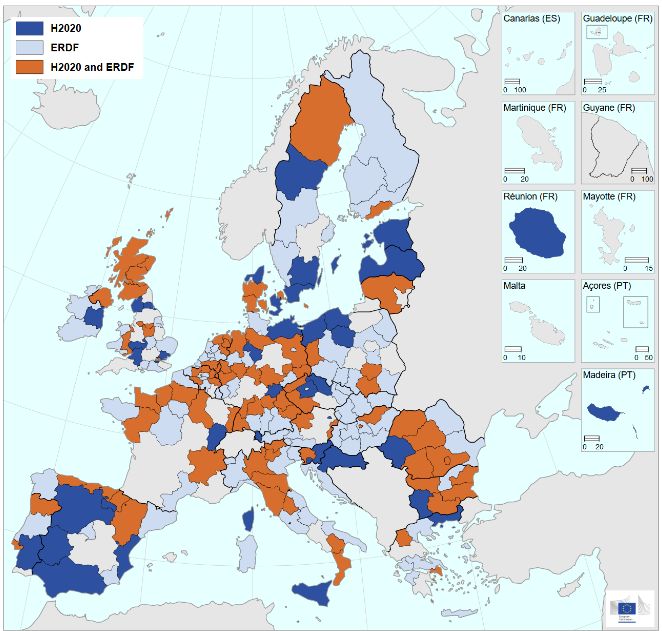
Map 1 shows the distribution of the number of synergies among KET across European NUTS-2 regions,
and Map 2 the same among SGC.
20
When considering a location quotient of 1.05 as a benchmark value, the total number of synergies observed decreased
by 13.92% compared to a location quotient of 1. The number of regions for which a relative concentration of Horizon
2020 funding is detected amounts to 277. Regarding the ERDF, it is 278 regions.
16Map 1 Number of synergies per NUTS-2 region referring to Key Enabling Technologies
Source: ERDF dataset of R&I-related projects (Bachtrögler et al. 2020), CORDIS database of Horizon 2020 projects, own
elaboration. Total # of regions: 281.
As discussed before, synergies among R&I funding schemes are more frequent for societal grand
challenges, which are defined more broadly. Up to three (possible) synergies concerning KET and up
to four synergies concerning SGC are found for single European NUTS-2 regions.
There is a considerable variation in the number of synergies within Member States. Related to this,
Gianelle et al. (2020) find that around a third of ERDF R&I related calls in Poland and Czechia do not
contain the alignment with RIS3 priorities as a binding eligibility criterion for project selection. In contrast,
almost 90% of calls for proposals in Italy and all calls in Portugal, Lithuania and Slovenia only allow for
projects targeted at pre-defined strategic priorities. Although smart specialisation strategies are not only
centred around KET and SGC, it could be of interest to look at Figures 4 and 5 before that background (in
future research).
Regarding the map of synergies in societal grand challenges, there does not appear to be an
obvious pattern of the occurrence and frequency of synergies, such as a North-South-divide or
differences between EU-15 (including United Kingdom) and EU-13. Regarding potential funding synergies
17in KET, though, it strikes out that only a few regions in Greece, the South of Italy, and the South of Spain, Bulgaria and Romania bundle their R&I funding in the same technological area. It appears to be an EU-wide pattern that there are relatively few synergies found for capital regions. For example, in Portugal, Spain, Austria, the Netherlands, Slovakia or Poland, there is only one synergy regarding KET and only one or two synergies regarding SGC. In Lazio region in Italy, a potential synergy is found for only one societal grand challenge (inclusive, innovative and reflective societies), whereas e.g. Berlin in Germany has two synergies regarding KET (ICT and nanotechnologies) and only one regarding SGC (inclusive, innovative and reflective societies). Dublin in Ireland appears to have two syn- ergies in KET and SGC each, while in the capital region of France or Sweden, there is neither a synergy in Horizon 2020 nor ERDF funding. In Paris, there is a relative specialisation of R&I-related ERDF spending in nanotechnologies and advanced materials and, at the same time, Horizon 2020 funds are concentrated on ICT and industrial biotechnologies. There does not appear to be a notable correlation between the amount of R&I-related ERDF project funding and the occurrence of (one or more) synergies in a NUTS-2 region. However, there is a slight positive correlation with the frequency of synergies (spearman correlation coefficient of 0.18). Refer to the R&I regional viewer for a visualisation and further details on the geographical distri- bution of Horizon 2020 and R&I-related ERDF support. 18
Map 2 Number of synergies per NUTS-2 region referring to Societal Grand Challenges

Source: ERDF dataset of R&I-related projects (Bachtrögler et al. 2020), CORDIS database of Horizon 2020 projects, own
elaboration. Total # of regions: 281.

3.3 Which technological and policy domains are the most suitable for funding
    concentration and synergies?
The presence of an ecosystem which has the capacity to trigger project ideas or is able to integrate existing
networks is a key component for R&I activities. The extent of the concentration of funding in a certain field
is expected to vary significantly. Variation may arise from the spectrum of R&I activities and actors a
technological or policy area is linked to. For instance, among key enabling technologies, the area related
to ICT concerns a wider range of industries and organisations and ecosystems than nanotechnologies or
industrial biotechnologies. The same observation can be made with regard to the societal grand challenge
of inclusive, innovative and reflective societies which affects a broader set of R&I activities than e.g. the
challenge related to security.
Box 1 Organisations benefitting from both EU main R&I funding schemes
 Another approach to analyse the interplay and potential synergies between Horizon 2020 and ERDF support
 for R&I activities is to investigate the existence of firms or organisations that receive funding from both
 schemes. In a first analysis matching the beneficiaries by their name revealed that around 15% of R&I
 projects co-financed by the ERDF are carried out by firms or organisations that also receive Horizon 2020

                                                                                                                  19
support, and that this share varies significantly across EU member states (see Bachtrögler & Doussineau, 2020). It can be of interest in this context to investigate in which thematic area the research of organisations receiving funding from both schemes is carried out. Regarding KET, almost a half of all projects carried out by a beneficiary that also receives Horizon 2020 funding relates to industrial biotechnologies. Moreover, around a fifth of relevant projects each is carried out in the technological areas of nanotechnologies and advanced materials. Concerning societal grand challenges, around a half of R&I-related ERDF projects that were assigned a SGC and carried out by a beneficiary of Horizon 2020 funding corresponds to the – rather broadly defined – challenge of inclusive, innovative and reflective societies. More than a quarter of projects is furthermore related to challenges in the field of transport, energy and climate action, which – unlike security, health and food security - have also been main priority areas of EU cohesion policy (and thereby the ERDF) in the MFF 2014-20. The following Figures show for each technology (Figure 4) and policy area (Figure 5) the share of the 281 regions considered for which a concentration of funding is observed for (1) Horizon 2020 funding only, (2) ERDF funding only, (3) both funding schemes and (4) none of the schemes. Comparing the profiles of concentration of funding between the individual KET and SGC suggest the following: There are substantial differences in concentration profiles of ERDF and Horizon 2020 funding between technology and policy areas. In general, a larger share of regions concentrates its respective Horizon 2020 funding in key enabling technologies than in societal grand challenges. Conversely, societal grand challenges seem to be more suitable to concentrate ERDF funding. This finding corresponds to a certain extent to the rationale behind each source of funding, the Horizon 2020 programme targeting technological excellence while the ERDF within EU cohesion policy addresses the territorial divide. When comparing concentration profiles from the perspective of the source of funding, we can observe that the share of regions concentrating ERDF funding is superior to Horizon 2020 in almost all technology areas excepting the KET EU.2.1.5 Advanced manufacturing and processing and the two societal grand challenges EU.3.4 Sustainable transports and EU.3.7 Secure society & Security. Those three areas are most industry-oriented and may require stronger place-based assets with traditional ecosys- tems made of large structuring companies and SMEs than other areas. The concentration in both H2020 and ERDF concerns a larger share of regions in the societal grand chal- lenges. However, significant differences are observed between areas particularly in societal grand chal- lenges. For instance, only 5.4% of the regions are implementing synergies in the area of secure society and security and 9.3% in the sustainable transports, while more than 30% are doing so in areas related to clean energies and food security. A tentative explanation of these difference could be the preexistence of traditional industrial ecosystems based in a limited number of regions as well as the importance and current public focus on energy transition. Another factor that could explain the difference in funding concentration profiles among certain areas is the distance from the market. The closer the area is from the research laboratory (and the further to the market), such as nanotechnologies and industrial biotechnologies, the more these technological areas are concentrated on a limited number of regions gathering the necessary ecosystems (e.g. universities, public research organisations or large companies). 20
You can also read