Fact-checking on Twitter: An examination of campaign 2014 - American Press Institute
←
→
Page content transcription
If your browser does not render page correctly, please read the page content below
Fact-checking on Twitter:
             An examination of campaign 2014∗
                                Andrew M. Guess†
                                   March 4, 2015

                                Executive summary
          I combine machine learning methods with a complete set of histori-
      cal Twitter data to examine how fact-checking interventions play out on
      social media. Overall, tweets (or retweets) containing misleading or fac-
      tually wrong statements outnumber tweets with corrective information.
      However, as I show in two case studies, the amount of misinformation de-
      creases over time as corrections make up a larger share of tweets relating
      to a particular claim. Despite controversies surrounding factual interpre-
      tations, especially as they relate to political debates, I find that sentiment
      toward journalistic fact-checking on Twitter is more likely to be positive
      than negative or neutral.

   ∗ This report was made possible by the American Press Institute and The Democracy Fund.

Many thanks to Lucas Graves, Brendan Nyhan, and Jason Reifler for their guidance on this
project. Special thanks to Caroline Sohr for excellent research assistance.
   † Ph.D. Candidate, Department of Political Science, Columbia University; @andyguess

                                            1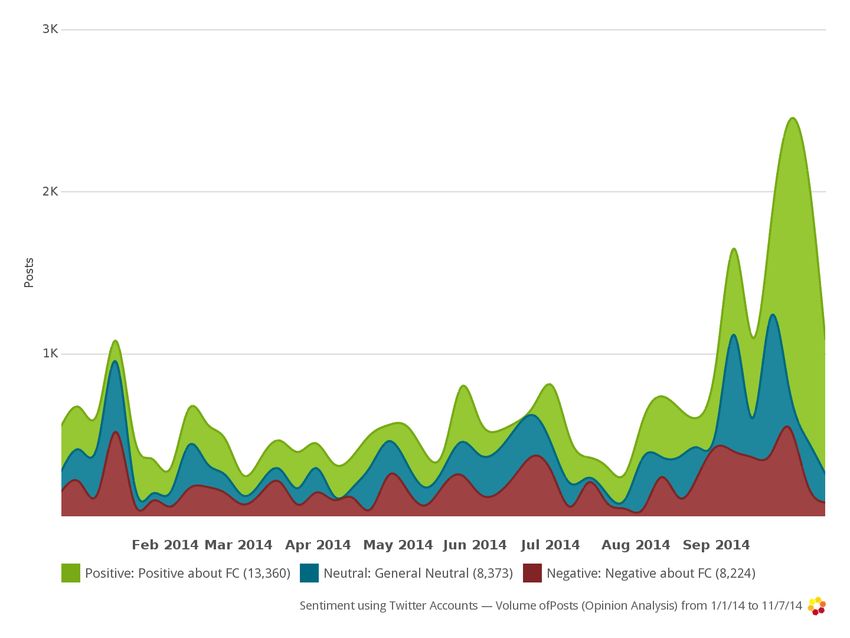
1    Introduction

      Figure 1: Lies vs. facts, October 2014: Eventually, truth wins out?

    Discussions about events in the news can happen anywhere. Increasingly,
they occur on social media, where those who report the news and those who
consume it meet. In 2014, the Pew Research Center found that 46% of on-
line news consumers who use a social network have “discussed a news issue
or event” there.1 Where discourse about current events takes place, political
disputes—often heated disputes involving factual claims—inevitably occur. It
is not surprising, then, that social media has become a focal point for those who
seek to set the record straight. As journalistic fact-checking has become more
prominent, it has become an increasingly frequent topic in online discourse.
However, little is known about how these social-media interventions play out
among news audiences.
    This report examines the spread and impact of fact-checking practices on
social media, using comprehensive data from Twitter analyzed using a machine
learning approach. The findings cover three main areas: descriptive information
about the prevalence of tweets related to fact-checking; evidence on how Twitter
users feel about fact-checking activities in general; and an analysis of how the
flow of tweets about a claim changed in two case studies when fact-checkers
intervened.
    The general approach of this report is to apply machine learning algorithms
to a massive database of every tweet ever posted, which allows for an aggregate,
macro-level picture of information dynamics. It is important to note that this
approach does not allow for a specific examination of each tweet in question, nor
does it overcome the fundamental obstacle to social research of this kind—the

                                       2
inability to observe a counterfactual world in which a particular fact-check was
not published. Still, the trends documented here, especially when supplemented
with the case studies I consider, point toward similar conclusions.
    First, I find that tweets correcting falsehoods or pointing to a correction
are completely swamped by tweets making or repeating the claim. However,
whether by virtue of the corrections or not, the volume of tweets about the ini-
tial claim tends to level off quickly. This is likely related to the fact that most
of the tweet volume (both corrections and false claims) consists of retweets of
a relatively small core of tweets. These tweets originate primarily from jour-
nalistic fact-checking organizations, but other self-appointed guardians of truth
often emerge: politicians (when the target is an opponent), governmental orga-
nizations, and mainstream media outlets.
    Second, overall sentiment on Twitter toward fact-checking is relatively pos-
itive. Focusing on tweets that involve fact-checking, I find significantly more
positive tweets about fact-checking—praising the efforts of fact-checking orga-
nizations, imploring media organizations to check their facts, etc.—than nega-
tive ones. Digging more into the sentiment embedded in tweets, I also see that
the targets of fact-checking are seen in an overwhelmingly negative light. This
could be at least partially an artifact of fact checkers’ bias toward correcting
falsehoods rather than affirming a limitless number of correct statements.
    Below, I detail the methodology of this section and outline both the strengths
and limitations of the approach. I then present a series of graphs illustrating
the basic findings. Finally, I look at two case studies: the spread of false claims
that Ebola is airborne, and a CBO report that was interpreted (misleadingly)
as evidence that the implementation of Obamacare will lead to the loss of more
than 2 million jobs.

2    Methodology
I use Crimson Hexagon’s ForSight platform2 to conduct the analysis. ForSight
relies on a proprietary algorithm, BrightView, that uses supervised machine
learning to classify large quantities of posts on social media—in this case,
tweets—into user-defined categories. For the purpose of this analysis, those
categories represent either sentiment (“positive”/“negative”) or topics (claims
vs. corrections).
    The method proceeds in two steps. First, a sample of tweets meeting a cer-
tain set of search criteria is hand-coded (“trained”) using the given classification
scheme. Second, the algorithm uses the so-called training corpus to generate a
complete classification of the entire set of tweets. Assuming a well-defined set of
categories and proper training, the result is an accurate picture of the number
and proportion of tweets in each category within a given period of time. When
possible, this is done by two independent coders who then also manually cat-
egorize a subset of the automatically classified tweets in order to validate the
results.
    To make this concrete, suppose we want to know the proportions of tweets

                                         3
asserting that the color of a dress is white and gold vs. blue and black. We would
first take a sample of tweets about the dress and hand-code them as “white and
gold” or “blue and black,” then feed this training set into the algorithm, which
would use the linguistic characteristics of the coded tweets to classify all tweets
about the dress on Twitter. We could then take a sample of the automatically
classified tweets and determine whether the results match how human coders
would (blindly) classify them in order to validate the procedure.
    The advantage of this approach is clear: It allows us to make generalizations
about a vast quantity of individual tweets over time so that trends and pat-
terns are clearly visible. The disadvantage is that it is susceptible to commonly
acknowledged problems of causal inference. First, as suggested above, most
claims are never fact-checked because they are banal or obviously true. This
means that in choosing the sample of tweets to analyze, we are “selecting on
the dependent variable”: restricting the search to cases that are more likely to
take a particular value (in this case, to be false). If, for example, fact-checking
truly has an impact on the volume of claims on social media but the magni-
tude is relatively modest, then by selecting in this way we could understate the
true effect. A second issue is that we cannot observe counterfactuals—that is,
we cannot re-run history to see what happens when fact-checkers fail to inter-
vene in a given instance and then compare the result. As a result, our primary
comparisons are over time and between cases.

3     How prevalent is fact-checking on Twitter?

    Figure 2: Volume of tweets about fact checking, January-November 2014.

    What does Fact Check Twitter look like? To find out, I used a list of Twitter
accounts connected to journalistic fact-checking organizations, including both
official handles (such as @PolitiFactOhio) and those of affiliated staff mem-
bers. I then set the algorithms loose on tweets that originated, replied to, or

                                        4
in some other way mentioned any of the accounts on that list. The result is a
dynamic, real-time view of the fact-checking universe on Twitter. (Of course,
there are discussions on Twitter surrounding factual claims that occur sepa-
rately from the actions of this particular group, and they will fall outside the
universe of tweets as defined in this way. To confirm the robustness of the re-
sults, I also repeat the analysis using fact-check-related keywords rather than
specific accounts.) An important feature of this universe is that it is relatively
centralized: I collected a sample of thousands of tweets—almost 100,000 over
the course of 2014—originating from or interacting with a group of only 26 ac-
counts. This means that the vast bulk of the tweets I analyze are posted in
response to the pronouncements of the fact checkers.
This structure is reminiscent of the “Broadcast Network” audience profile in
Pew’s typology of Twitter topic networks,3 which is described as follows:
Twitter commentary around breaking news stories and the output
of well-known media outlets and pundits has a distinctive hub and
spoke structure in which many people repeat what prominent news
and media organizations tweet. The members of the Broadcast Net-
work audience are often connected only to the hub news source,
without connecting to one another. In some cases there are smaller
subgroups of densely connected people—think of them as subject
groupies—who do discuss the news with one another.
Figure 2 shows the overall prevalence of fact-check-related tweets, from Jan-
uary 2014 until the first week of November when the midterm campaign ended.
In general, the number of tweets citing the fact-checkers remains under 500,
but large spikes are observed coinciding with the State of the Union address
at the end of January and candidate debates in governor and Senate races in
October. The number of fact-check-related tweets on any given day over the
course of the 2014 campaign did not typically rise much higher than 2,000, even
at peak times. Toward November, however, the volume increased, with almost
7,000 tweets from and interacting with fact-checking organizations in the last
weeks of October. From January until the election, there were more than 95,000
tweets meeting my account-based criteria for inclusion in the sample.
It is important to note that fact-checking could have more influence on the
broader discourse than the raw numbers suggest, especially if many of the users
interacting with the organizations on social media are themselves influential.
4 Sentiment toward fact-checking
How do people on Twitter feel about fact-checking? I applied the categorization
approach outlined above to the same set of tweets in order to better understand
people’s reactions toward fact-checking interventions.4 ...
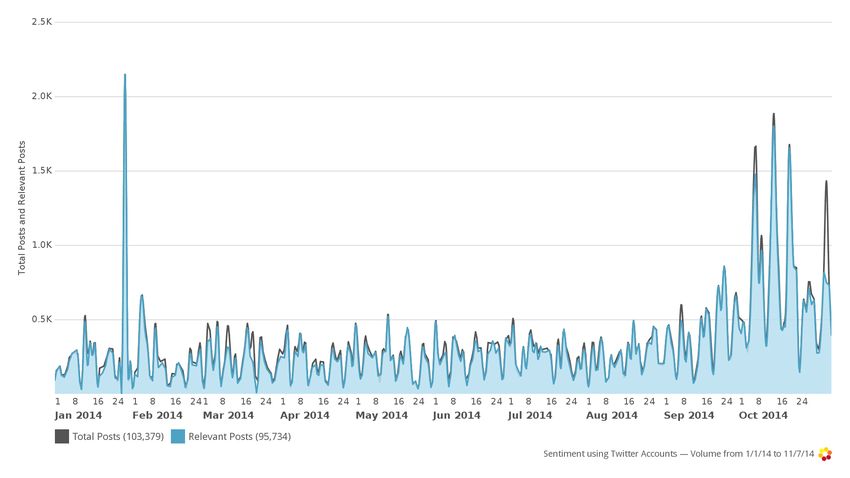
Figure 3 breaks down the tweets into three groups: those that express posi-
tive sentiment toward fact-checking, those that are neutral, and those that are
negative. As the graph shows, positive tweets were more common than both
5negative and neutral tweets at all times last year—even toward the end of the
2014 midterm campaign, when fact-checking activity (and potential disputes
over factual claims) reached its peak. Moreover, neutral tweets just barely out-
numbered negative ones: 15% were positive, and roughly 9% each were negative
or neutral. Another 45% of these tweets simply posted links to assessments of
factual claims without any particular sentiment attached.
Figure 3: Sentiment of tweets about fact checking, January-November 2014.
Tweets about fact-checking don’t only concern the enterprise itself, how-
ever. Many contain implicit or explicit sentiment about the targets of the fact
checkers—the politicians and other public figures whose utterances are so often
subjected to scrutiny. In the sample, there were so few tweets expressing posi-
tive sentiment toward the targets of fact checking that I was unable to train the
algorithms for that category. This is likely a function of fact checkers’ tendency
to intervene when high-profile misleading claims are made (as opposed to claims
that end up being verified as accurate). In the sample, a full 22% of tweets over
the course of the campaign expressed disapproval toward the target of a fact
check, more than the 15% containing positive sentiment toward the enterprise
in general. (While an overlap between the two categories is likely, I constructed
the training sample so that tweets containing implied sentiment toward both
fact checking and the target were coded for the latter. This means that the
estimate of positive sentiment toward fact checking is actually a lower bound.)
To verify the validity of the results in this section, I repeated the analysis
using a different definition of the Twitter population. Rather than use tweets
6by and interacting with a group of accounts related to journalistic fact-checking
organizations, I built a query using terms commonly associated with fact check-
ing, such as “Pinocchio,” “fact check,” etc. This approach replicates the broad
outlines of the sentiment analysis, increasing confidence in my findings. See the
Appendix, which shows a version of Figure 3 in which positive tweets outnumber
neutral and negative ones, this time by an even larger margin.
5 Case 1: Ebola transmission
To select cases for further study, I searched the universe of tweets from the
previous section for clusters about specific topics that experienced surges in
volume at critical points during 2014. From those possibilities, I narrowed down
to two well-known issues that spilled over into the political discourse: a specific
claim about the transmission of Ebola virus, and assertions about job losses
resulting from the implementation of Obamacare. These cases do not represent
the range of all possible ways in which fact-checking plays out on Twitter—they
are two among many—but they give a sense of how corrections can and do
interact with specific misleading claims.
Over the summer of 2014 and into early fall, hysteria over the Ebola virus
hit a fever pitch in the United States. Severe outbreaks of the virus had broken
out in West Africa, and a handful of infections were documented among medical
personnel returning from the continent. Among the many rumors inspired by
these events, one particularly potent one maintained that Ebola is transmitted
by air, or that a mutation giving it that ability would soon occur. This belief
circulated throughout social media, but a big boost came from a mainstream
source: Washington Post columnist George Will, who stated on an episode of
Fox News Sunday 5 that the disease could spread via a cough or sneeze.
Tweets containing some version of the rumor were common throughout Oc-
tober:
#Ebola Outbreak: The Latest #US Government Lies. The Risk of
#Airborne Contagion? http://t.co/eMCZrpxg2E #Ebola #Men-
songessu...
Oh so Ebola is airborne now?? Welp
apparently ebola is airborne now........................
’Airborne’ Ebola Virus - Public Health Agency of Canada!: http://t.co/bmuI4WA6DS
via @YouTube RED ALERT!
Pushback from the scientific community and fact-checking organizations was
immediate. After the broadcast, PunditFact rated the claim “False.” The next
day, the site followed up with “A few words to those who think George Will
was right about Ebola going airborne through a sneeze,” 6 which restated its
evaluation of the claim and made a distinction between “particles that remain
suspended in the air after an infected person coughs or sneezes” and trans-
mission requiring direct contact with bodily fluids. As the top half of Figure
74 shows, tweets making the claim were fairly prevalent both before and after
Will’s statement, with more than 10,000 posts a day mentioning or accepting
the claim at its peak in October.
Figure 4: Volume (top) and proportion (bottom) of tweets claiming Ebola air-
borne transmission and tweets correcting the claim, September-November 2014.
The red line indicates when the first fact check occurred.
The graph also illustrates that the claim generally swamped the correction.
From September through November, only 27% of all tweets relating to the trans-
mission of Ebola contained some information debunking misleading assertions
about airborne contagion. Tweets making the claim outnumbered tweets with
8corrective information by more then 2.7 to 1. Despite the higher volume of the
claim at all times during most of this period, mentions of Ebola transmission
tapered off toward the middle of November. By the end of this period there
were roughly as many tweets countering the claim as tweets making it. This
suggests a pattern: A correction reaches parity with the originating claim only
after the volume of discussion about the claim diminishes considerably.
Did the corrections cause the decline in the volume of misleading claims
about Ebola transmission on Twitter? These findings alone cannot prove such a
statement for several reasons. The first is the general one that we cannot com-
pare what we find on Twitter with a counterfactual world in which the same
claims are made but no corrections are issued. For example, would we have seen
more tweets repeating misleading statements about Ebola had PunditFact not
intervened? Second, the timing of the tweets does not show a clear pattern in
which a claim is followed immediately by a correction, and then a decline in mis-
leading tweets. But as the bottom half of Figure 4 shows, proportionally more
tweets about Ebola contagion began to incorporate information about the cor-
rection as time went on. This growth in the proportion of accurate information
could have been due to the interventions of fact checkers, or the dissipation of
the misleading claims, or some combination of both. Third, the overall drop-off
in tweet volume about Ebola transmission doesn’t necessarily imply that beliefs
about the virus being airborne were successfully “eradicated.” The trends illus-
trate over-time changes in the aggregate composition of tweets, not changes in
the tweet behavior (or beliefs) of individual users. Still, changes in volume and
the share of tweets uncritically repeating the misleading claim suggest that the
public discourse itself, at least on social media, changed measurably.
A final point concerns the issue of Ebola transmission itself. While clear cut
from a scientific standpoint, it is worth noting that the definition of “airborne” is
potentially confusing. Scientists distinguish between viruses that travel signifi-
cant distances via air droplets or small particles of dust—the threshold for air-
borne microorganisms—and those that require close, direct contact (often with
bodily fluids). Consider the following quotation from a Harvard researcher:7
If you were on a plane, and someone sneezed, you wouldn’t be at risk
of getting infected unless you were sneezed on directly within close
quarters, and that cough or sneeze transferred droplets into mucosal
membranes.
It isn’t difficult to imagine such a statement inflaming panic about Ebola
transmission: it is far from an equivocal refutation, and the words “sneeze”
and “droplets” could easily be taken out of context to imply the opposite of
the intended conclusion. Even more difficult, not all scientists have stayed
on message: a month before Will’s statement, the director of the Center for
Infectious Disease Research and Policy at the University of Minnesota raised
the possibility of mutations in an op-ed in The New York Times titled “What
We’re Afraid to Say about Ebola.” Other attempts at nuanced treatments of the
issue were susceptible to being mischaracterized, such as a Reuters story tweeted
by the official @ReutersOpinion account (and subsequently retweeted):
9Ebola’s not airborne, but it is “droplet-borne.” Read this to get a
better understanding of how the disease spreads: http://reut.rs/1vnS7Gf8
6 Case 2: 2.3 million jobs
Claims that President Obama’s health care reform would destroy jobs date
back to before the law was enacted, but on Feb. 4, 2014, they seemed to win
the backing of an influential source: the Congressional Budget Office, which
predicted “a decline in the number of full-time-equivalent workers of about 2.0
million in 2017, rising to about 2.5 million in 2024.” 9 The projected decline was
in the number of hours worked, rather than the number of jobs being created,
but the news was immediately taken by some to imply that employers would
have to cut positions as a result of Obamacare.
The report itself clarified the distinction: “The estimated reduction stems
almost entirely from a net decline in the amount of labor that workers choose to
supply, rather than from a net drop in businesses’ demand for labor.” However,
many commentators conflated the two, leading to numerous claims about Oba-
macare leading to a loss of jobs. For example, Gretchen Carlson of Fox News
claimed, “The CBO now says the president’s health care law will cut the num-
ber of full-time jobs in the United States by 2.3 million by 2021.” 10 She later
clarified that this would result from individual workers’ decisions not to work,
but the initial claim—which PunditFact deemed “Mostly False”—was picked up
on social media:
Obamacare to cut work hours by equivalent of two million jobs: CBO
Obamacare kills...jobs! ** Obamacare will push 2 million workers
out of labor market: CBO.
Explosive CBO Report: How #Obamacare Will Drive People Out
of the Workforce #p2
The top half of Figure 5 shows the pattern of claims and corrections as it
played out on Twitter in the first months of 2014. As with Ebola transmission,
tweets repeating or referring to the claim swamp tweets containing corrective
information—in this case, 93% about health care and jobs endorsed the false
claim versus 7% that corrected it in the first three months of 2014 (more than
13 times as many). And as with Ebola, the corrective tweets appear at around
the same time as the misleading comments about the CBO’s projections. The
pattern continues as the initial spikes corresponding to the release of the report
subside. As the bottom half of the figure illustrates, the share of corrective
tweets increases as this happens.
One way in which the jobs claim played out differently on Twitter than the
airborne Ebola rumor is that corrective tweets did not steadily overtake tweets
repeating the claim (in proportional terms). Instead, progress was halting and
the end state appears to be less stable: The bottom half of Figure 5 shows how
the share of corrective tweets alternates between nearly 0% and almost 80%.
10Figure 5: Volume (top) and proportions (bottom) of tweets about the CBO job
loss claim, January-March 2014.
Why did this issue play out differently? While numerous factors could be at
play, including timing (the Ebola issue flared up closer to the end of the midterm
campaign), one possibility is that the issue itself was inherently more complex.
Even the rating, “Mostly False,” was less equivocal than the verdict on Ebola
transmission. Another possibility is that the topic proved more difficult for the
algorithm to isolate, resulting in noisier estimates.11
Regardless of the reason, mentions of the claim on Twitter—whether to re-
peat it or to debunk it—tapered off by April to virtually zero from a peak of
11more than 52,000 per day at the beginning of February. A notable addendum,
however, is that the claim was temporarily revived—along with the correction—
in October during a Senate debate between then-Minority Leader Mitch Mc-
Connell and his opponent Alison Lundergan Grimes, but with only a fraction
of the tweet volume.
7 Conclusion
On social media, where instantaneous feedback combines with limited social
context, politics can get taken to extremes. Opinions are amplified, memes
spread like wildfire, and rumors propagate. While these tendencies can cause
false or misleading statements to be repeated frequently, they also mean that
clarifications and corrections have an opportunity to spread and influence the
discourse as well.
Fact-checking organizations must now compete against falsehoods on social
media. As this report has shown through an analysis of a large set of tweets,
fact checking is an active topic of debate on Twitter, especially when political
activity intensifies during election season. The fact-checks that are published
sometimes induce controversy; coming down on one side in a political dispute
can inflame partisan tensions. Nonetheless, sentiment toward fact-checking is
significantly more positive than negative among people who express an opinion
about it on Twitter.
When it comes to specific factual claims, I find a suggestive pattern in which
spikes of Twitter activity repeating misleading information occur at approxi-
mately the same time as a relative surge in fact checking, likely in direct re-
sponse to the claims. While the latter doesn’t overtake the former in numeri-
cal terms in the two case studies I consider—tweets repeating misinformation
greatly outnumber corrective tweets overall—the corrections eventually become
more common in proportional terms. In short, all social media frenzies eventu-
ally fizzle. As this process occurs, the relative share of corrective tweets seems
to increase.
The role of fact checkers in this process is clear: they provide much of the
source material with which Twitter users confront mistaken beliefs. I cannot
determine whether the mistaken beliefs they target are changed or simply go
dormant, but the messages they promote appear to help make debate on the
platform more accurate.
12Appendix: Sentiment analysis using keyword-based
sample definition
Figure 6: Sentiment of tweets about fact checking, January-November 2014.
The sample of tweets used to make this graph was constructed using keywords
rather than interactions with specific accounts.
13Notes
1 http://www.pewresearch.org/fact-tank/2014/09/24/how-social-media-is-reshaping-news/
2 http://forsight.crimsonhexagon.com
3 http://www.pewinternet.org/2014/02/20/mapping-twitter-topic-networks-from-polarized-
crowds-to-community-clusters/
4 Cohen’s κ for two human coders constructing the training corpus: 0.626.
5 October 19, 2014
6 http://www.politifact.com/punditfact/article/2014/oct/20/few-words-those-who-think-george-
will-was-right-ab/
7 http://www.politifact.com/punditfact/article/2014/oct/20/few-words-those-who-think-george-
will-was-right-ab/
8 https://twitter.com/reutersopinion/status/521753248404099072, Oct. 13, 2014
9 http://www.politifact.com/truth-o-meter/documents/obamcare-cbo-budget-economic-outlook-
february-2014/
10 http://www.politifact.com/punditfact/statements/2014/feb/05/gretchen-carlson/carlson-
cbo-says-obamcare-will-cut-full-time-jobs-/
11 There is some evidence for this possibility. Cohen’s κ computed between a human coder
and automated classifications on the same tweets (blindly) were lower for the CBO jobs claim
(0.78) than for the Ebola claim (0.901). Both are well above common thresholds for validity,
however.
14You can also read