Factors associated with back pain in children aged 6 to 12 years of age, an eight months prospective study
←
→
Page content transcription
If your browser does not render page correctly, please read the page content below
www.nature.com/scientificreports
OPEN Factors associated with back pain
in children aged 6 to 12 years
of age, an eight months
prospective study
Claire Henriot‑Jéhel1,2,3*, Jocelyn Lemire4, Caroline Teulier1,2, André Bussières4,5 &
Arnaud Lardon1,2,3
Associated factors of back pain (BP) development before puberty and its persistence are poorly
documented. We investigated the association and possible temporality between prior BP history
(PBPH), muscular endurance (ME), aerobic capacity (AC), sport activity variables (SAV) and BP in
children aged 6 to 12. We collected baseline characteristics (demographics, PBPH, ME, AC and SAV)
of children from three primary schools in Canada. Parents replied to weekly text messages regarding
their children BP status over an 8-month period. Logistic regression models were adjusted for
potential confounders. Data from 242 children (46% female; 8.6 ± 1.7 years) were included. Over the
8-month survey BP prevalence was 48.1%, while the cumulative incidence was 31.9%. The occurrence
of at least one BP event was associated with PBPH [OR (IC 95%) = 6.33 (2.35–17.04)] and high AC [2.89
(1.21–6.90)]. High AC was also associated with the development of a first BP episode [2.78 (1.09–
7.07)], but ME and SAV were not. BP appears to be relatively common before puberty. BP history
seems to be strongly associated with BP recurrence in children. Aerobic capacity is associated with
first BP episode development.
Back pain (BP) is one of the most frequent musculoskeletal disorders in adults and represents a critical public
health issue1. Indeed, BP can result in significant physical and psychological burden, and high societal c ost2.
Approximately half (49.6%) of the years lived with disability originates from BP a lone3.
Youth is a turning point regarding BP development. Recent evidence suggests that BP starts early, during
childhood and adolescence. A 3-year prospective cohort study of 1465 children aged 8 to 15 years followed weekly
using text messaging estimated the BP annual prevalence to approach 30%4.
To date however, elements of the causal relationship with BP first occurrence have not been well e xplored5.
One crucial (but insufficient) criterion of the 9 Bradford Hill criteria for causality, is temporality. To infer causal-
ity, exposure must precede the outcome of interest. Recent literature concerning the causality of low back pain
(LBP) does not differentiate between the ‘disease’ of LBP and its recurring episodes mainly due to a lack of a
clear definition of absence of LBP at b aseline5. Thus, reporting whether the child has a prior history of BP at the
time of enrolment is necessary.
Furthermore, BP during youth is a predictor of BP in a dulthood6. Consequently, exploring predictors of BP
during childhood and adolescence may help design more effective early interventions to influence or manage its
trajectory. Despite the large number of potential factors investigated to date, the causes of early BP onset remain
unclear7. Linear growth during puberty, physical activity level and physical capacity are some of the main fac-
tors examined thus far.
In young people, the puberty period has been highlighted as a critical period for BP occurrence8,9. Linear
growth during puberty appears to be an independent risk factor for the development of spinal pain, those under-
going greater growth experience increased spinal pain frequency and d uration10.
Prior studies have also reported physical activity behaviour to be associated with BP in young people. Inter-
estingly, moderate intensity physical activity seems to be associated with a decrease of BP, while more vigorous
intensity may increase its i ncidence11,12.
1
Université Paris-Saclay CIAMS, 91405 Orsay, France. 2Université dOrléans CIAMS, 45067 Orléans, France. 3Institut
Franco-Européen de Chiropraxie, 24 Boulevard Paul Vaillant Couturier, 94200 Ivry sur Seine, France. 4Université
du Québec À Trois-Rivières, Trois‑Rivières, Canada. 5Faculty of Medicine and Health Science, McGill University,
Quebec, Canada. *email: chenriot-jehel@ifec.net
Scientific Reports | (2022) 12:603 | https://doi.org/10.1038/s41598-021-04060-7 1
Vol.:(0123456789)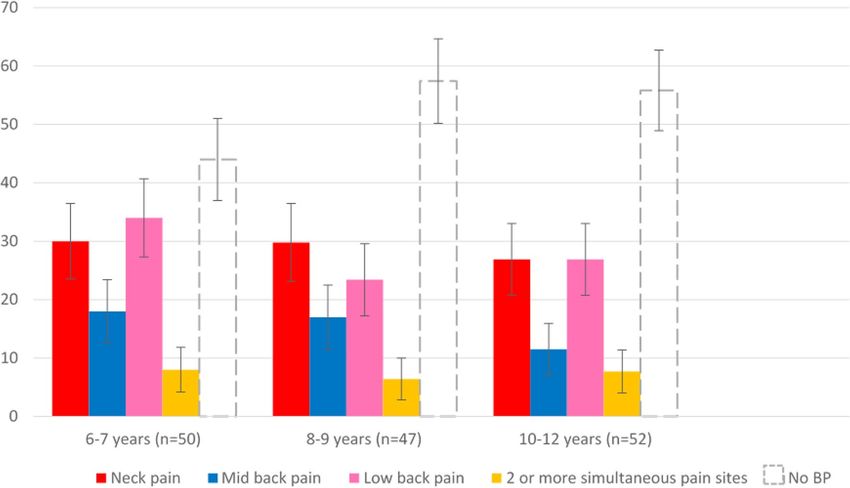
www.nature.com/scientificreports/
Objective physical capacity factors such as aerobic capacity and muscular endurance are often considered as
plausible BP predictors. However, studies have provided inconsistent results. A systematic review13 exploring
the association between aerobic capacity and BP in children included three longitudinal studies. One reported a
positive association, but this association disappeared when the results were adjusted for muscular e ndurance14.
Cardon et al.15 found a protective association, while a more recent study by Perry et al.16 found that the par-
ticipants with a higher aerobic capacity reported more BP episodes. In addition, a 2007 systematic r eview17
showed no association between trunk muscular endurance and LBP occurrence. In contrast, a more recent
meta-analysis13 suggested that an efficient trunk extension muscular endurance may be a protective factor for
BP in children and a dolescents13.
This conflicting evidence among available studies may be explained by sample sizes variations, the age range
of the study populations (e.g., 9–10 vs. 15–16), confounders adjusted for in the data analysis, or recall bias.
The primary objectives were to estimate the prevalence and the cumulative incidence of back pain in the study
population, and to explore the association between BP events and prior history of BP, physical capacity factors
including muscular endurance and aerobic capacity and sport activity variables, over an 8-month weekly SMS
survey in children aged 6 to 12. We secondarily aimed to determine if these factors possibly are associated with
the occurrence of first BP episode.
Method
Design. This prospective cohort study gathered baseline data from children attending three different elemen-
tary schools in October 2017, and followed them each week over eight months between November 15th 2017
and June 26th 2018. We used the Strengthening the Reporting of Observational Studies in Epidemiology (STROBE)
Statement to report study results18.
Ethics approval and informed consent to participate. All methods were carried out in accord-
ance with the Declaration of Helsinki ethical principles for research involving human subjects. This study was
approved on June 13, 2017 by the Research Ethics Committee for Human Beings at the Université du Québec
à Trois-Rivières [CER-17-235-07.06]. Informed consent was obtained from all subjects and/or their legal
guardian(s).
Participants and setting. A convenience sample of 451 children aged 6 to 12 years old attending three
elementary schools; two public (n = 328) and one private (n = 123), were eligible to participate in this study in a
town included 137,188 inhabitants at the time of the data collection.
Eligibility criteria. To be included in the study, the child had to be in good general health as to allow data
collection, be between age 6 to 12 years, and one parent had to be reachable via text messaging. Children with
physical disabilities or illnesses that contraindicated physical effort were excluded.
Procedure. School principals were initially contacted by phone by a team member. Subsequently, the nature
of the project was fully explained in person. An explanatory brochure of the research project was then provided
to all the parents. Those agreeing for their children to participate signed an informed consent form. Even after
consenting, children could choose not to participate in one or several physical activities or abandon the study
altogether without any consequence.
Baseline data collection and independent variables. At inclusion, a baseline questionnaire was com-
pleted at home by parents to gather contact information (mobile phone number and email address), as well as,
the child history of BP and sport activities performed. More specifically:
Prior BP history was assessed to differentiate a first BP episode from any other BP event (i.e. BP reported
at any other time point during study). BP history at baseline served to estimate BP point prevalence (is the child
having BP at the time of study enrolment?), and BP before study onset to estimate the lifetime prevalence (has the
child ever had BP prior to enrolment?) (Fig. 1).
Muscular endurance was measured by a static test called the abdominal board test, without time limit. This
test has been shown to be feasible, valid and reliable for assessing torso muscle endurance for children 8 to
12 years of age (Boyer et al., 2013). It consists of measuring the time during which a participant can maintain the
board position. Participants were warned whenever their board position was relaxing. At the second warning,
the endurance time (seconds) was noted and the child had completed his test. The test was performed twice and
the longest time was retained.
Aerobic capacities were measured using the Andersen test19, a reliable shuttle-running test adapted and
validated for the age of our sample20. Children were asked to run as quickly as possible for 15 s, then to remain
still for the next 15 s. They were asked to repeat this sequence (15 s run, 15 s still) during a 10-min period. The
results of this test were reported in total length (meter) covered for each child. The greater the distance the child
covered in 10 min, the greater was the aerobic capacity.
Sport activity variables such as sport activity performance (yes/no), and if yes, the number of sports practiced
and the frequency per week were collected. Only sport activities happening outside of school’s regular physical
education classes (e.g. hockey, soccer or swimming) were taken into consideration.
With the participation of physical education teachers who helped clarify instructions to the children, other
exploratory variables listed below were collected by experienced chiropractors and graduate students at the three
different schools during the children’s physical education classes. A manual explaining each physical test to be
Scientific Reports | (2022) 12:603 | https://doi.org/10.1038/s41598-021-04060-7 2
Vol:.(1234567890)
www.nature.com/scientificreports/
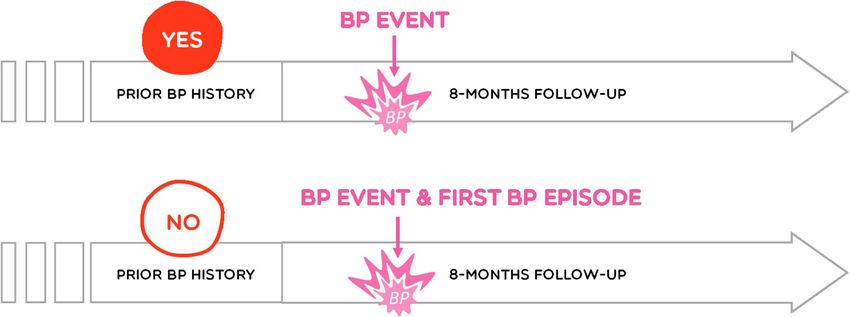
Figure 1. Prior BP history and BP events reporting.
Figure 2. BP event and first BP episode.
carried out by children during these sessions was given to physical education teachers beforehand. All measure-
ments were performed systematically in the same order.
Confounding factors. Sex, age and a growth spurt occurrence during the course of the study have been
identified as possible confounding factors7,10,21. A growth spurt was defined as the presence of a whole-year peak
height velocity of at least 9 cm/y in girls and 10 cm/y in boys22. To determine whether a “growth spurt” occurred
during the course of this 8-month study, a proportional peak height velocity had to reach 6 cm/8 months in girls
and 6.7 cm/8 months in boys. Anthropometric measurements including height (cm) and weight (kg) were meas-
ured twice using a tape measure and a digital scale respectively, once at baseline and again after eight months.
Back pain outcomes: prevalence and cumulative incidence (dependent variables). In the cur-
rent study, prevalence was defined as number of responders reporting the occurrence of at least one event of
BP during the 8-month follow-up over the total number of responders (Fig. 1). BP event was defined as pain
felt in the back at any time point during 8-month follow-up for both children with or without prior back pain
history. A diagram of the three regions of the spine (neck/cervical, mid-back/thoracic, lower back/lumbar) was
given to the parents to indicate accurately the painful regions. BP events were collected weekly using the SMS
Factor platform, a web-based text messaging system, over an 8-month period. SMS systems allow for a more
precise estimate of the incidence of BP, having a high response rate and limiting the recall bias (Dissing et al.,
2017). Each week parents received the following text message: “Hello, did your child have back pain during the
past week? Thank you.” Parents had to choose one or more of the proposed answers: (N = no spine pain, 1 = neck
pain, 2 = mid back pain and / or 3 = low back pain). In case of non-response, a reminder was automatically sent
48 h later. Traumatic causes of BP event were not specified during the collection of BP data (Fig. 2).
In contrast, cumulative incidence was defined as the proportion of children (without back pain history at
inclusion) who experienced a first BP episode during the 8-month follow-up. Here, a first back pain episode
was considered when a child without any prior back pain history at baseline reported a first back pain episode
during the 8-month follow-up (Fig. 2).
Statistical analysis. All analyses were performed by a statistician using Stata 15.1. Chi-square tests of inde-
pendence compared the study variables of follow-up responders (i.e., participants whose response rate to the
Scientific Reports | (2022) 12:603 | https://doi.org/10.1038/s41598-021-04060-7 3
Vol.:(0123456789)www.nature.com/scientificreports/
32 weeks SMS survey reached at least 70%) to those who were lost during follow-up (i.e., participants who did
not reach a 70% response rate over 32 weeks and were excluded from the follow-up analyses).
Prior BP history was reported as a binary variable (present or absent history of BP at enrolment or prior to
enrolment). BP outcomes were reported and synthetized as presence or absence of at least one BP event during
the 8-month tracking. Aerobic capacity and muscular endurance data were categorized as follow: low (inferior
to the first quartile), medium (between the first and the third quartiles) or high (superior to the third quartile).
Sport activity performance was reported as a binary variable (yes/no). Both the number of sports practiced and
weekly sports activities or training sessions were classified in three categories (none, 1–2 or more than 3). Lastly,
the occurrence of a “growth spurt” was reported as a ’yes/no’ variable.
Tests for bivariate correlation were performed to determined associations between the potential associated
factors and the presence of a BP event during the 8-month tracking period. Independent variables with a degree
of statistical significance inferior to 0.2 were included in the stepwise multivariate regression model, and adjusted
for three confounding factors: sex, age and occurrence of a “growth spurt”. Non-significant variables (P > 0.05)
were removed from the model starting with the one with the lowest association level to end up with a model
comprising significant variables only. Similar analyses were performed on participants without prior BP history
to determine temporality associated factors with a first BP episode and temporality. The stepwise multivariate
regression model allowed us to calculate odds ratios. The level of significance was p < 0.05 for all analyses unless
otherwise specified.
Results
Baseline characteristics. Of the 451 children aged 6 to 12 years invited to participate in the study, 242
(53.7%) returned a signed consent form and the completed baseline questionnaire. Of those, 131 were boys
(54%) and 111 were girls (46%) with a mean age of 8.6 ± 1.7 [range 6.0–12.0] years. The mean weight was 30.7
(± 8.1) kg [range 17.0–63.0] and the mean height was 135.5 (± 11.7) cm [range 110.0–166.0] with a mean body
mass index (BMI) of 16.5 (± 2.3) kg.m2 [range 12.1–25.8].
The mean aerobic capacity was 726.0 ± 161.1 m [range 80.0–860.0] for the low category, 943.7 ± 45.4 m [range
868.0–1036.0] for the medium category and 1100.2 ± 62.0 m [range 1040.0–1418.0] for the high category. The
mean muscular endurance was 46.0 ± 14.2 s [range 5.0–63.0] for the low category, 91.5 ± 19.7 s [range 64.0–136.0]
for the medium category and 218.2 ± 80.0 s [range 137.0–603.0] for the high category. Table 1 displays the sample
baseline characteristics.
At baseline, 19.7% of the 242 children reported BP before study onset (lifetime prevalence). The point preva-
lence or the proportion of participants who reported BP at study onset was 8.6%. BP before and/or at study onset
(prior BP history) was reported by 51 children (21.8%).
Follow‑up characteristics. The average weekly response rate to the SMS survey was 68.7% over the
32 weeks with a total of 5284 observations recorded altogether.
Among the 242 participants, 160 (66.1%) reached a response rate of at least 70% to the 32-weeks SMS survey
and were included in the statistical analysis (Fig. 3). This responder group included 83 boys (51.5%) and 77 girls
(48.5%) with a mean age of 8.6 ± 1.7 [range 6.0–12.0] years, and was followed an average of 30.9 ± 2.3 [range
23.0–32.0] weeks. Forty-five participants (18.6%) never responded to the SMS survey (Fig. 4).
No significant difference was found between the follow-up responders (i.e., the group with a participation
rate > 70%) and those lost to follow-up (n = 82) on baseline characteristics, except for sport activities. Compared
to participants with a lower participation rate, responders had a higher proportion of children who were involved
in sport activities (72.2% vs 86.2%, p = 0.009), practiced three or more different sports (17.7% vs 30.2%, p = 0.008),
and practiced sport at least three times per week (35.9% vs 45.2%, p = 0.017) (Table 1).
At eight months after enrolment, the mean weight of the responder group was 32.9 ± 9.1 [range 16.3–67.1]
kg and the mean height was 140.4 ± 10.7 [range 115.0–171.0] cm with a mean BMI of 16.5 ± 2.5 [range
9.1–28.1] kg.m2. Of those, 21.6% presented a peak height velocity of at least 6 cm/8 months for the girls and
6.7 cm/8 months for the boys, i-e; a “growth spurt”.
Over the 8-month follow-up period, the prevalence was 48.4%, while the cumulative incidence was 31.9%.
About half of the children (48.1%) never experienced BP in their life, neither prior to enrolment, nor over the
course of the study. Only 6 of the 160 children (3.8%) with a prior history of BP reported having no BP event
over the course of the study (Table 2). The BP prevalence among female and male participants did not vary
significantly (p = 0.927), with a prevalence of 23.1% and 25% respectively.
The mean number of weeks with back pain was 1.8 ± 2.8 weeks [range 0–16]. Over half of the children (51.9%)
in the responder group did not report any BP event during the 8-month follow-up period. The proportion of
children reporting BP only once during the survey was 20%, and 13.5% reported BP six times or more (Table 3).
Furthermore, neck pain and low back pain 8-month prevalence were equally predominant at 28.8%, followed
by mid-back pain at 15%. Only 7.5% of the participants reported pain in two regions or more simultaneously at
least once. The proportion of children with and without BP events during the SMS survey as a function of age
and pain location(s) is presented in Fig. 2.
Back pain associated factors. Table 4 lists the results of the logistics regression model predicting at least
one BP episode during the follow-up period. Table 5 lists the results of the logistics regression model predicting
a first BP episode during the follow-up period.
Scientific Reports | (2022) 12:603 | https://doi.org/10.1038/s41598-021-04060-7 4
Vol:.(1234567890)www.nature.com/scientificreports/
All participants Follow-up responders (> 70% of SMS survey)
Sample, n (%) 242 160 (66.5)
Gender, n girls (%) 111 (46%) 77 (48.4)
Age, mean ± SD [range], years 8.6 ± 1.7 [6.0–12.0] 8.6 ± 1.7 [6.0–12.0]
Weight, mean ± SD [range], kg 30.7 ± 8.1 [17.0–63.0] 30.7 ± 8.4 [18.0–63.0]
Height, mean ± SD [range], cm 135.5 ± 11.7 [110.0–166.0] 135.3 ± 11.9 [110.0–166.0]
BMI, mean ± SD [range], cm 16.5 ± 2.3 [12.1–25.8] 16.4 ± 2.3 [12.1–25.2]
Practice of a sport activity, n (%) 194 (81.5) 137 (86.2) *
Number of sports practiced, n (%)
None 45 (18.9) 22 (13.8)
1–2 131 (55) 89 (56.0)
≥3 62 (26) 48 (30.2) *
Sport practice frequency/week, n (%)
None 45 (19.2) 22 (14.0)
1–2 91 (38.7) 64 (40.8)
≥3 99 (42.1) 71 (45.2) *
BP lifetime prevalence, n (%) 46 (19.7) 29 (18.5)
BP point prevalence at baseline, n (%) 20 (8.6) 14 (8.9)
Prior BP history, n (%) 51 (21.8) 32 (19,9)
Aerobic capacity, mean ± SD [range], meter
Low category 726.0 ± 161.1 [80–860] 743.4 ± 150.7 [80–860]
Medium category 943.7 ± 45.4 [868–1036] 941.0 ± 45.2 [868–1036]
High category 1100.2 ± 62.0 [1040–1418] 1103.7 ± 70.0 [1040–1418]
Muscular endurance, mean ± SD [range], sec
Low category 46.0 ± 14.2 [5–63] 46.0 ± 12.6 [7–63]
Medium category 91.5 ± 19.7 [64–136] 89.3 ± 19.7 [64–136]
High category 218.2 ± 80.0 [137–603] 212.5 ± 92.2 [137–603]
Growth spurt, n (%) 43 (20.6) 30 (21.6)
Table 1. Baseline characteristics of included participants and participants who responded to at least 70% of
the SMS survey. *Significant difference (p < 0.05) between study participants and responders with over 70% of
SMS survey data over the course of the study.
Prior BP history. Association with BP event over eight months. Prior BP history was associated with the
occurrence of at least one BP event during the 32 weeks SMS survey [OR (95% CI) = 6.33 (2.35–17.04), p = 0.000]
(Table 4).
Aerobic capacity. Association with BP event over eight months. High aerobic capacity was associated
with the occurrence of at least one BP event during the 32 weeks SMS survey [OR (95% CI = 2.89 (1.21–6.90),
p = 0.017] after adjusting for age, sex and growth spurt occurrence. The categories defined as low and medium
did not indicate a significant association with BP outcomes (Table 4).
Association with a first BP episode during the SMS survey. High aerobic capacity was also associated with the
development of a first episode of BP during the 32 weeks SMS survey [OR (95% CI = 2.78 (1.09–7.07), p = 0.032].
The categories defined as low and medium did not indicate a significant association with BP outcomes (Table 5).
Muscular endurance. Muscular endurance showed no significant association with either the occurrence of
at least one BP event, nor the development of a first BP episode during follow-up (Tables 4 and 5).
Sport activity variables. Sport activity performance, the number of sports practiced and practice fre-
quency per week showed no significant association with either the occurrence of at least one BP event reports,
nor the development of a first BP episode during follow-up (Tables 4 and 5).
Discussion
At baseline, nearly 20% of the children reported a prior episode of BP and 8.6% admitted experiencing BP among
the 242 participants. In contrast, nearly half of the 160 children (51.1%) reported at least one BP event over the
32 weeks follow-up, and the study cumulative incidence was 31.9%. NP and LBP were the most frequent pain
locations, while MDP was less common. Over half of the children never reported any BP (either before or dur-
ing the study). Interestingly, a prior history of BP and a high aerobic capacity are associated with at least one
Scientific Reports | (2022) 12:603 | https://doi.org/10.1038/s41598-021-04060-7 5
Vol.:(0123456789)www.nature.com/scientificreports/
Figure 3. Flowchart of study participants.
BP event reported during the 32 weeks SMS survey, while a high aerobic capacity was associated with a first BP
episode occurrence.
Prevalence. While historically considered a rare and potentially serious condition, research over the past
decades has shown that back pain in children is a common d isorder23. For instance, a Danish National Birth
Cohort study of 46,726 11–14-year-olds reported severe spinal pain (neck, middle back, and low back pain) in
9.8% of boys and 14.0% of girls, and moderate spinal pain in approximately 30% of all c hildren24. Intriguingly, a
2007 review of BP lifetime prevalence reported estimates ranging from 5 to 74% in studies of a dolescent25. Such
a wide variation is partly due to: how back-pain is defined, differing methods of data collection and lengths of
recall period. For these reasons, it seems difficult to compare our results with other published studies. However,
a previous prospective cohort study using similar BP data collection method (SMS track) and recall period on a
children population over a 2.5-year period26 reported that three quarters of the children never experienced any
back pain. In contrast, our study found that about half of participants never experienced any BP. Such difference
might be due to the fact that the former prospective cohort study asked both for spinal, upper limb and lower
limb pain, while the present study focused solely on spinal pain.
BP history. Our findings suggest that children with a history of BP are six times more likely to report BP at
follow-up. Similarly, the review by Beynon et al.27. reported that a having a history of back pain predicts further
back pain in late adolescence and in adulthood (odds ratios ≥ 2.7). Participants included in these longitudinal
studies were older (≥ 12 years) than our population6,28,29. Despite the short follow-up period and small sample,
our findings suggest that BP in young children may also be associated with BP event in early adolescence.
Scientific Reports | (2022) 12:603 | https://doi.org/10.1038/s41598-021-04060-7 6
Vol:.(1234567890)www.nature.com/scientificreports/
Figure 4. Proportions (standard error) of children with and without BP during the SMS survey as a function of
age and pain location(s).
BP prevalence during the 8-month follow-up, n (%; 95% CI) 77 (48.4; 40.7–56.2)
Never reported any BP before or during the study, n (%; 95 CI) 76 (48.1; 40.3–55.9)
Prior history of BP, but none during follow-ups, n (%; 95% CI) 6 (3.8; 0.81–6.8)
BP cumulative incidence (first BP episode) at 8-month, n (%) 51 (31.9)
Table 2. BP description during the 8-month follow-up, and proportion of children who never reported any
BP among responders (n = 159).
Number of weeks with BP, mean ± SD [range] 1,8 ± 2,8 [0–16]
Children who never reported any BP during survey, n (%; 95% CI) 83 (51.9; 44.1–59.6)
Children who reported BP once, n (%; 95% CI) 32 (20; 13.8–26.2)
Children who reported BP 2–5 times BP, n (%; 95% CI) 24 (15; 9.5–20.5)
Children who reported BP between 6–10 times, n (%; 95% CI) 17 (10.6; 5.9–15.4)
Children who reported BP > 10 times, n (%; 95% CI) 4 (2,5; 0.8–4.9)
Table 3. Proportion of children reporting BP during the study period among responders (n = 160).
Aerobic capacity. In the current study, children with a high aerobic capacity, measured using the Andersen
t est19, had greater than a two-fold increase risk of BP (cumulative prevalence) and of having a new episode of
BP (cumulative incidence). Interestingly, a review by Lardon et al.13 found conflicting results from three cross-
sectional studies, showing no association14, a negative association15 and a positive association16.
Muscular endurance. Muscle endurance measured in our sample using the abdominal board test, with-
out time limit did not show any association with BP. In contrast, a review and meta-analysis by Lardon et al.
2015 reported a protective association between back muscle endurance in extension, and back pain (OR = 0.75,
95% CI 0.58–0.98)13. All included studies in this review assessed back muscle endurance in extension using the
Biering-Sorensen test30 while in the present study we used the abdominal board test following instructions from
a Canadian guide for children physical skills assessment31.
Physical activity. Using self-reported measures of physical activity level, our study did not show any associ-
ation between the type and number of sport activities or the frequency of activities per week and the occurrence
Scientific Reports | (2022) 12:603 | https://doi.org/10.1038/s41598-021-04060-7 7
Vol.:(0123456789)www.nature.com/scientificreports/
Independent variables Odds ratio 95% IC P value
No 1
istorya
Prior BP h
Yes 6.33 [2.35–17.04] < 0.000 *
Muscular endurance (s)b - - - -
Low 2.09 [0.89–4.92] 0.091
Aerobic capacity (m)a Medium 1
High 2.89 [1.21–6.90] 0.017*
a
No 1
Sport activity
Yes 1.87 [0.54–6.47] 0.323
None 1
Number of sports practiceda 1–2 1.26 [0.46–3.5] 0.65
≥3 1 (omitted)
None 1
Frequency of sport activities/weeka 1–2 0.49 [0.18–1.36] 0.172
≥3 1 (omitted)
Table 4. Association between Prior BP history, muscular endurance, aerobic capacity, sport activity variables
and presence of at least one BP event during the SMS survey (n = 160). * p < 0.05; a Variables with p < 0.2 to
the bivariate regression model were added to the multivariate regression model and adjusted for age, sex and
growth spurt occurrence; b: variables with p > 0.2 in the bivariate correlation test and thus not included in the
stepwise multivariate regression model.
Independent variables Odds ratio 95% IC P Value
Muscular endurance (s)b - - - -
Low 1.95 [078–4.94] 0.154
Aerobic capacity (m)a Medium 1
High 2.78 [1.09–7.07] 0.032 *
Sport activityb - - - -
Number of sports practicedb - - - -
None 1
Frequency of sport activities/weeka 1–2 1.38 [0.37–5.07] 0.630
≥3 2.22 [0.63–7.81] 0.213
Table 5. Association between muscular endurance, aerobic capacity, sport activity variables and first BP
episode incidence during the SMS survey (i.e., only follow-up responders without BP at study onset, n = 128).
* p < 0.05; a Variables with p < 0.2 to the bivariate regression model were added to the multivariate regression
model and adjusted for age and sex; b: variables with p > 0.2 in the bivariate correlation test and thus not
included in the stepwise multivariate regression model.
of BP. Similarly, Aartum et al.32 school-based longitudinal cohort study found neither cross-sectional (n = 906)
nor longitudinal (n = 625) associations between physical activity, measured using accelerometers, and spinal
pain (neck pain, mid back pain, LBP) in 11–15 year old Danes adolescents. In contrast, a prospective cohort
of 1160 school age Danish children (age 6 to 12 years) found that greater physical activity was associated with
increased occurrence of spinal pain. However, the nature of this relationship depended on the intensity of activ-
ity. Increased time in vigorous physical activity predicted future spinal pain, while increased time in moderate
intensity activities tended to protect against spinal pain12.
A recent scoping review of potential risk factors or triggers for BP (first time, recurrent, and ongoing BP) in
children and young adults identified the female gender, older age, a history of BP, late pubertal status, a fam-
ily history of back pain, and increased growth spurt, as likely risk factors. There is limited research on muscle
endurance in the development of BP27. Potential risk factors or triggers for incident and episodic BP included
female gender and older age, as well as increased / vigorous intensity physical activity and psychosocial factors.
No association or weak associations were found for body mass index, height, muscle strength, smoking, and
systemic/illness factors27.
Strengths and limitations. Strengths of this study are a prospective design and the availability of infor-
mation on several factors studied within the same study sample. The cohort design of the study enabled us to
include data from questionnaires at different point in time, including the assessment of prior history of spinal
pain.
Scientific Reports | (2022) 12:603 | https://doi.org/10.1038/s41598-021-04060-7 8
Vol:.(1234567890)www.nature.com/scientificreports/
Nonetheless, this study has several limitations. First, the main outcome, spinal pain, was studied based on a
parent reported questionnaire which may affect the reliability of the data. It can be challenging for children to
describe the presence and type of pain and for the parents to systematically report children’s complaints. However,
parents decide whether or not to restrict or motivate their children to engage in their activities, based on their
interpretation of their child’s pain33. In our study the risk of excessive pain reporting seems unlikely, nonetheless,
perhaps more pain episodes might have been reported if the children had responded themselves34. Furthermore,
despite an effort to standardize the definition of an episode of BP to the participants and their parents, the lack of
specification of the traumatic or incidental nature of the BP notified by the participants induces a risk of measure
bias for this variable. Also, the results on pain location might not strictly represent spinal pain. Although a pain
diagram was included in the questionnaire, the source of pain might be in some cases non-MSK pain.
The sport activity variable’s collection might have suffered from an unclear wording of the questions encour-
aging a subjective interpretation, especially regarding the definition of the activity’s intensity.
Finally, a large number of participants were lost during follow-up according to our responder definition
of over 70% response rate across the 32 weeks SMS. The collection of mobile phone numbers on paper format
implied a risk of error both in the decryption of some handwriting, as well as, in the manual transcription of
the numbers. Since the potential for human error is not negligible, it could explain part of the 18.6% of partici-
pants who never answered the survey along with potential technical concerns with mobile phones or telephone
plans and participation retraction. Indeed, some parents may have deemed unimportant to respond if their
child felt no pain, resulting in an overestimation of the prevalence. Because the missing values in the multivari-
able analysis were selective (i.e., not random), imputation was not suitable. Furthermore, no inferences can be
made on causality or direction of associations due to the cross-sectional approach of the analyses. As selection
bias towards a healthier population and higher socio-economic status might have occurred, results should be
interpreted with caution.
Other methodological considerations include the following: we could not contact parents directly, likely
influencing recruitment and retention rates. In addition, intake questionnaire instructions regarding types and
frequency of sport activities were unclear as some parents reported on active transportation (e.g., cycling to
school) or did not report total time of weekly sports practiced per week for all sports they listed (e.g., soccer but
not for hockey). While muscular endurance was measured at the school, encouragements received from team
members in small groups may have varied.
Future research. Future studies should document both the presence and the intensity level of back pain
reported by the children using validated pain measuring tools35, and determine a pain threshold (e.g., ≥ 2/10 on
the VAS) for inclusion at any point in time of the study. Our finding suggests that 21.8% of participants already
experienced prior BP at baseline. Future studies should seek to include preschoolers and follow them throughout
the lifespan to determine BP trajectory considering potential influence of socioeconomic and psychosocial fac-
tors. For instance, a recent Danish study found that children living in less-educated or lower-income families,
not living with both of their parents, and those without biological full siblings were more likely to experience
spinal pain24. Recent reviews also suggest that adverse childhood experiences (ACEs) such as child maltreatment
and exposure to domestic violence are associated to long-term causes of ill health, including depression, cancers,
cardiovascular disease, and diabetes, and possibly chronic spinal pain and disability in later life36–38. High quality
longitudinal studies should seek to determine the effect of unique and cumulative ACEs (number and type) as
risk factors for persistent pain and disability in adolescence and adulthood.
Data availability
The data used and/or analyses during the current study are available from the corresponding author on reason-
able request.
Received: 5 November 2020; Accepted: 14 December 2021
References
1. Hartvigsen, J. et al. What low back pain is and why we need to pay attention. Lancet 391, 2356–2367 (2018).
2. Hurwitz, E., Randhawa, K., Yu, H., Côté, P. & Haldeman, S. The Global Spine Care Initiative: a summary of the global burden of
low back and neck pain studies. https://www.ncbi.nlm.nih.gov/pubmed/29480409 (2018).
3. GBD 2015 Disease and Injury Incidence and Prevalence Collaborators. Global, regional, and national incidence, prevalence, and
years lived with disability for 310 diseases and injuries, 1990–2015: a systematic analysis for the Global Burden of Disease Study
2015. Lancet Lond. Engl. 388, 1545–1602 (2016).
4. Dissing, K. B. et al. Spinal pain in Danish school children - how often and how long? The CHAMPS study-DK. BMC Musculoskelet.
Disord. 18, 67 (2017).
5. Ardakani, E. M., Leboeuf-Yde, C. & Walker, B. F. Failure to define low back pain as a disease or an episode renders research on
causality unsuitable: results of a systematic review. Chiropr. Man. Ther. 26, (2018).
6. Hestbaek, L., Leboeuf-Yde, C., Kyvik, K. O. & Manniche, C. The course of low back pain from adolescence to adulthood: eight-year
follow-up of 9600 twins. Spine 31, 468–472 (2006).
7. Calvo-Muñoz, I., Kovacs, F. M., Roqué, M., Gago Fernández, I. & Seco Calvo, J. Risk factors for low back pain in childhood and
adolescence. a systematic review. Clin. J. Pain (2017) doi:https://doi.org/10.1097/AJP.0000000000000558.
8. Lardon, A., Leboeuf-Yde, C., Le Scanff, C. & Wedderkopp, N. Is puberty a risk factor for back pain in the young? A systematic
critical literature review. Chiropr. Man. Ther. 22, 27 (2014).
9. Wedderkopp, N., Andersen, L. B., Froberg, K. & Leboeuf-Yde, C. Back pain reporting in young girls appears to be puberty-related.
BMC Musculoskelet. Disord. 6, 52 (2005).
10. Hebert, J. J. et al. Pubertal development and growth are prospectively associated with spinal pain in young people (CHAMPS
study-DK). Eur. Spine J. https://doi.org/10.1007/s00586-019-05905-6 (2019).
Scientific Reports | (2022) 12:603 | https://doi.org/10.1038/s41598-021-04060-7 9
Vol.:(0123456789)www.nature.com/scientificreports/
11. Aartun, E. et al. The most physically active Danish adolescents are at increased risk for developing spinal pain: a two-year prospec-
tive cohort study. BMJ Open Sport Exerc. Med. 2, e000097 (2016).
12. Franz, C. et al. Physical activity is prospectively associated with spinal pain in children (CHAMPS Study-DK). Sci. Rep. 7, 11598
(2017).
13. Lardon, A., Leboeuf-Yde, C. & Le Scanff, C. Is back pain during childhood or adolescence associated with muscle strength, muscle
endurance or aerobic capacity: three systematic literature reviews with one meta-analysis. Chiropr. Man. Ther. 23, 21 (2015).
14. Bo Andersen, L., Wedderkopp, N. & Leboeuf-Yde, C. Association between back pain and physical fitness in adolescents. Spine 31,
1740–1744 (2006).
15. Cardon, G. et al. Physical fitness, physical activity, and self-reported back and neck pain in elementary schoolchildren. Pediatr.
Exerc. Sci. 16, 147–157 (2004).
16. Perry, M., Straker, L., O’Sullivan, P., Smith, A. & Hands, B. Fitness, motor competence, and body composition are weakly associated
with adolescent back pain. J. Orthop. Sports Phys. Ther. 39, 439–449 (2009).
17. Hamberg-van Reenen, H. H., Ariëns, G. A. M., Blatter, B. M., van Mechelen, W. & Bongers, P. M. A systematic review of the rela-
tion between physical capacity and future low back and neck/shoulder pain. Pain 130, 93–107 (2007).
18. Von Elm, E. et al. The strengthening the reporting of observational studies in epidemiology (STROBE) statement: guidelines for
reporting observational studies. https://www.ncbi.nlm.nih.gov/pmc/articles/PMC2020495/ (2007).
19. Andersen, L. B., Andersen, T. E., Andersen, E. & Anderssen, S. A. An intermittent running test to estimate maximal oxygen uptake:
the Andersen test. J. Sports Med. Phys. Fitness 48, 434–437 (2008).
20. Ahler, T., Bendiksen, M., Krustrup, P. & Wedderkopp, N. Aerobic fitness testing in 6- to 9-year-old children: reliability and validity
of a modified Yo-Yo IR1 test and the Andersen test. Eur. J. Appl. Physiol. 112, 871–876 (2012).
21. Wirth, B., Knecht, C. & Humphreys, K. Spine Day 2012: spinal pain in Swiss school children- epidemiology and risk factors. BMC
Pediatr. 13, 159 (2013).
22. Tanaka, T., Suwa, S., Yokoya, S. & Hibi, I. Analysis of linear growth during puberty. Acta Paediatr. Scand. Suppl. 347, 25–29 (1988).
23. Burton, A. K. Low back pain in children and adolescents: to treat or not? Bulletin (Hospital for Joint Diseases (New York, NY)),
55(3):127–129 (1996)
24. Joergensen, A. C., Hestbaek, L., Andersen, P. K. & Nybo Andersen, A.-M. Epidemiology of spinal pain in children: a study within
the Danish National Birth Cohort. Eur. J. Pediatr. 178, 695–706 (2019).
25. Jeffries, L. J., Milanese, S. F. & Grimmer-Somers, K. A. Epidemiology of adolescent spinal pain: a systematic overview of the research
literature. Spine 32, 2630–2637 (2007).
26. Franz, C., Wedderkopp, N., Jespersen, E., Rexen, C. T. & Leboeuf-Yde, C. Back pain in children surveyed with weekly text messages:
a 2.5 year prospective school cohort study. Chiropr. Man. Ther. 22, 35 (2014).
27. Beynon, A. M., Hebert, J. J., Lebouef-Yde, C. & Walker, B. F. Potential risk factors and triggers for back pain in children and young
adults. A scoping review, part II: unclear or mixed types of back pain. Chiropr. Man. Ther. 27, 61 (2019).
28. Sjolie, A. N. Persistence and change in nonspecific low back pain among adolescents: a 3-year prospective study. Spine 29, 2452–
2457 (2004).
29. Smith, A., Beales, D., O’Sullivan, P., Bear, N. & Straker, L. Low back pain with impact at 17 years of age is predicted by early ado-
lescent risk factors from multiple domains: analysis of the western Australian pregnancy cohort (Raine) study. J. Orthop. Sports
Phys. Ther. 47, 752–762 (2017).
30. Evans, K., Refshauge, K. M. & Adams, R. Trunk muscle endurance tests: Reliability, and gender differences in athletes. J. Sci. Med.
Sport 10, 447–455 (2007).
31. Manuel d’instructions. Groupe de recherche sur les saines habitudes de vie et l’obésité. Evaluation canadienne du savoir-faire
physique. https://docplayer.fr/85262771-Manuel-d-instructions-groupe-de-recherche-sur-les-saines-habitudes-de-vie-et-l-obesi
te-2014.html (2014).
32. Aartun, E., Hartvigsen, J., Boyle, E. & Hestbaek, L. No associations between objectively measured physical activity and spinal pain
in 11–15-year-old Danes. Eur. J. Pain Lond. Engl. 20, 447–457 (2016).
33. van den Heuvel, M. M., Jansen, P. W., Bindels, P. J. E., Bierma-Zeinstra, S. M. A. & van Middelkoop, M. Musculoskeletal pain in
6-year-old children: the Generation R Study. Pain 161, 1278–1285 (2020).
34. Kamper, S. J., Dissing, K. B. & Hestbaek, L. Whose pain is it anyway? Comparability of pain reports from children and their parents.
Chiropr. Man. Ther. 24, 24 (2016).
35. Birnie, K. A., Hundert, A. S., Lalloo, C., Nguyen, C. & Stinson, J. N. Recommendations for selection of self-report pain intensity
measures in children and adolescents: a systematic review and quality assessment of measurement properties. Pain 160, 5–18
(2019).
36. Bellis, M. A. et al. Life course health consequences and associated annual costs of adverse childhood experiences across Europe
and North America: a systematic review and meta-analysis. Lancet Public Health 4, e517–e528 (2019).
37. Buscemi, V., Chang, W.-J., Liston, M. B., McAuley, J. H. & Schabrun, S. M. The role of perceived stress and life stressors in the
development of chronic musculoskeletal pain disorders: a systematic review. J. Pain 20, 1127–1139 (2019).
38. Bussières, A. et al. Adverse childhood experience and adult persistent pain and disability: protocol for a systematic review and
meta-analysis. Syst. Rev. 9, 215 (2020).
Acknowledgements
We thank Clara White, Stéphanie Langlois-Laroche, Samuel Langlois, Marc-Antoine Laquerre and Olivier Lanlo
for their invaluable contributions to the study; and Julie Lamoureux (Florida, USA) for her contribution to the
statistical analyses. We thank the children and their parents for their efforts in participating in this study. Finally,
we want to acknowledge the schools’ directory and staff for their collaboration to set this project.
Author contributions
C.H.J., A.B., A.L. contributed to the study conception and design, acquisition of data, and analysis and inter-
pretation of data, and wrote and edited the article. J.L. and C.T. contributed to study conception and design,
acquisition of data, and participated in revising the article. All authors give final approval for publication of the
article. All authors reviewed the manuscript.
Funding
This study was funded by l’Université du Québec à Trois-Rivières (UQTR) : Institutional funding for clinical
research (FIR). This research did not receive any specific grant from funding agencies in the public, commercial,
or not-for-profit sectors.
Scientific Reports | (2022) 12:603 | https://doi.org/10.1038/s41598-021-04060-7 10
Vol:.(1234567890)www.nature.com/scientificreports/
Competing interests
The authors declare no competing interests.
Additional information
Correspondence and requests for materials should be addressed to C.H.-J.
Reprints and permissions information is available at www.nature.com/reprints.
Publisher’s note Springer Nature remains neutral with regard to jurisdictional claims in published maps and
institutional affiliations.
Open Access This article is licensed under a Creative Commons Attribution 4.0 International
License, which permits use, sharing, adaptation, distribution and reproduction in any medium or
format, as long as you give appropriate credit to the original author(s) and the source, provide a link to the
Creative Commons licence, and indicate if changes were made. The images or other third party material in this
article are included in the article’s Creative Commons licence, unless indicated otherwise in a credit line to the
material. If material is not included in the article’s Creative Commons licence and your intended use is not
permitted by statutory regulation or exceeds the permitted use, you will need to obtain permission directly from
the copyright holder. To view a copy of this licence, visit http://creativecommons.org/licenses/by/4.0/.
© The Author(s) 2022
Scientific Reports | (2022) 12:603 | https://doi.org/10.1038/s41598-021-04060-7 11
Vol.:(0123456789)You can also read