PART C AND 619 TARGET SETTING GUIDE - JULY 14, 2021 AUTHORS: ANNE LUCAS, ECTA/DASY SHARON WALSH, ECTA/DASY ROBIN NELSON, DASY TONY RUGGIERO, DASY ...
←
→
Page content transcription
If your browser does not render page correctly, please read the page content below

Part C and 619 Target Setting Guide
July 14, 2021

Authors:
Anne Lucas, ECTA/DaSy
Sharon Walsh, ECTA/DaSy
Robin Nelson, DaSy
Tony Ruggiero, DaSy
Naomi Younggren, ECTA
The contents of this report were developed under grants from the U.S. Department of Education,
#H373Z190002 and #H326P170001. However, those contents do not necessarily represent the policy of
the U.S. Department of Education, and you should not assume endorsement by the Federal Government.
Project Officers: Meredith Miceli, Amy Bae, and Julia Martin Eile.

July 2021

Suggested citation:
Lucas, A., Walsh, S., Nelson, R., Ruggiero, T., & Younggren, N. (2021). Part C and 619 target setting
guide. SRI International.
Contents
Introduction .................................................................................................... 1
   Purpose ....................................................................................................................... 1
   Audience ..................................................................................................................... 1
   Background ................................................................................................................. 1
   Scope .......................................................................................................................... 1

Federal Requirements and OSEP Guidance on Target Setting......................... 2
   Individuals with Disabilities Education Act (IDEA) Statute ........................................... 2
   SPP/APR Instructions Requirements for Stakeholder Participation ............................ 2
   OSEP Guidance Regarding Targets and Baselines .................................................... 3

General Considerations for Baselines and Targets .......................................... 3
   Baselines..................................................................................................................... 3
   Targets ........................................................................................................................ 4
   Data Quality Issues Impacting Target Setting ............................................................. 4
       Necessary Information for Target Setting ............................................................... 4
       System Changes Important for Target Setting ....................................................... 4

Steps for Setting Targets ................................................................................. 4

Approaches for Target Setting......................................................................... 7
   Percent or Percentage Point Improvement ................................................................. 7
   Start with the End Goal ............................................................................................... 8
   Trend Analysis and Forecasting .................................................................................. 8
   Statistical Modeling/Analysis ....................................................................................... 9
   Additional Considerations............................................................................................ 9

Examples of Data Visualization ..................................................................... 10
   Historical Data for Indicator C3 or B7 ........................................................................ 10
   Bar Graph with Contextual Information ..................................................................... 11
   Percent Birth-to-Three Served by County ................................................................. 11
   Family Outcome Results vs. Targets, Bar or Line Graph .......................................... 12

Part C and 619 Target Setting Guide                         July 2021                                                              iii
Percent Birth-to-Three Served and Population Data, by County ............................... 13
Using Filters or Slicers to Focus on Specific Information .......................................... 14
Summary of Target-Setting Approaches ................................................................... 15
Indicator Specific Guidance ........................................................................... 16
Indicator C2–Settings ........................................................................................... 16
Indicators C3 and B7–Early Childhood and Preschool Outcomes........................ 18
Indicator C4–Family Outcomes ............................................................................ 22
Indicator C5–Child Find Birth to One .................................................................... 26
Indicator C6–Child Find Birth to Three ................................................................. 30
Indicators C9 and C10–Dispute Resolution .......................................................... 33
Indicators C11 and B17–State Systemic Improvement Plan ................................ 34
Indicator B6–Preschool LRE ................................................................................ 35
Part C and 619 Target Setting Guide July 2021 ivIntroduction
Purpose
This DaSy and ECTA guide provides general and indicator-specific guidance, considerations,
and resources to assist state systems in working with stakeholders to set targets for the State
Performance Plan (SPP)/Annual Performance Report (APR) indicators and the State Systemic
Improvement Plan (SSIP) State-Identified Measurable Result (SIMR) for the FFY 2020-2025
submission to OSEP on February 1, 2022 and in subsequent years.
Audience
This guide is written for state Part C and 619 leadership teams, but it will also be informative for
stakeholders involved in the target-setting process.
Background
Target setting is the process states use, with broad stakeholder input, to determine measurable
and rigorous benchmarks for results-based indicators. The process should ensure that the
rationale and methods for setting targets are analytically sound and clearly explained for optimal
stakeholder input and involvement. Targets are the expected levels of performance or progress
for each indicator. Targets are defined as percentage values and are based on analysis of past
performance and other state contexts.
Targets accomplish the following important functions:
• Establish expectations for performance throughout the state
• Assist in assessing where the state’s performance is strong, where performance is an
issue, and where to focus improvement
• Provide motivation for improving performance and celebrating success
• Serve as guides for monitoring progress and determining if progress is on schedule and
sustained over time
Scope
The target-setting information included in this guide is limited to the following indicators that
require targets:
C2: Settings
C3 and B7: Early Childhood and Preschool Outcomes
C4: Family Outcomes
C5: Child Find Birth to 1
C6: Child Find Birth to 3
C9 and C10: Dispute Resolution
C11 and B17: State Systemic Improvement Plan
B6: Preschool LRE
Part C and 619 Target Setting Guide July 2021 1Indicator-specific information on target setting for each of these indicators is provided under
Indicator Specific Guidance in this guide.
Compliance indicators (i.e., C1-Timely Services, C7-45 Day Timelines, C8-Part C Early
Childhood Transition, B12-Early Childhood Transition) are not addressed in this document as
the targets for these indicators are always 100%. More information about these compliance
indicators can be found in the following resources:
Part C SPP/APR Measurement Table
Part B SPP/APR Measurement Table
This Target Setting Guide includes the following sections:
• Federal Requirements and OSEP Guidance on Target Setting
• General Considerations for Baselines and Targets
• Steps for Target Setting
• Approaches for Target Setting
• Examples of Data Visualization
• Indicator Specific Guidance
Federal Requirements and OSEP Guidance on
Target Setting
Individuals with Disabilities Education Act (IDEA) Statute
“In general, as a part of the State performance plan described under paragraph (1), each State
shall establish measurable and rigorous targets for the indicators established under the priority
areas described in subsection (a)(3)." (20 U.S.C. 1416(a)(3)(A))
SPP/APR Instructions Requirements for Stakeholder Participation
The Part C State Performance Plan and Annual
Performance Report (Part C SPP/APR) General Stakeholders Defined:
Instructions and the Part B State Performance Plan and “Individuals or groups who have
Annual Performance Report (Part B SPP/APR) specifies, invested time, money, energy,
and/or interest into something.
for each year that covers the years of the SPP (FFY 2020
Stakeholder groups should
through FFY 2025), that targets for each SPP/APR
include representation of persons
indicator must be established with broad stakeholder
who are affected by or invested
input. in any proposed
The instructions specify the solicitation of broad change/innovation, such as
stakeholder input on the targets and that any subsequent parents, personnel,
revisions must include the following elements: administrators, or others who can
provide relevant information,
• “The number of parent members and a description personal experience, or expertise
of how the parent members of the Interagency to the proposed work.” (ECTA
Coordinating Council/State Advisory Panel, parent Systems Framework)
center staff, parents from local and statewide
advocacy and advisory committees, and individual
Part C and 619 Target Setting Guide July 2021 2parents were engaged in target setting, analyzing data, developing improvement
strategies, and evaluating progress;
• Description of the activities conducted to increase the capacity of diverse groups of
parents to support the development of implementation of activities designed to improve
outcomes for children with disabilities and their families;
• The mechanisms and timelines for soliciting public input for target setting, analyzing
data, developing improvement strategies, and evaluating progress;
• The mechanisms and timelines for making the results of the target setting, data analysis,
development of the improvement strategies, and evaluation available to the public.”
OSEP Guidance Regarding Targets and Baselines
The OSEP SPP/APR Universal Technical Assistance for FFY 2020-2025 document includes
additional guidance from OSEP regarding baselines and targets:
“Baselines. States are permitted to revise baseline data and, when doing so, are required to
provide an explanation for the revision. OSEP expects that baseline data would be revised
when there is a change in methodology or data source for the indicator that impacts
comparability of the data.”
“Targets. States are required to set targets that show improvement over the baseline data for
the FFY 2020–2025 SPP/APR. If, based on prior year’s performance, a State decides to
establish FFY 2020–2025 targets that are lower than the targets that were established from FFY
2016–2019, OSEP encourages the State to provide information regarding this decision in its
narrative. Generally, targets are not approvable if they do not show improvement over baseline;
however, there have been specific instances where OSEP has allowed States to set targets that
do not reflect improvement over baseline.” (Page 2 of OSEP SPP/APR Universal Technical
Assistance for FFY 2020-2025) However, states are encouraged to contact their OSEP state
lead. (See Indicator Specific Guidance for C-2: Natural Environments and B-6: Pre-school
Environments for OSEP-permitted exceptions included in this guide).
General Considerations for Baselines and Targets
Baselines
Beyond Federal requirements and OSEP guidance regarding baselines, several general
considerations may be useful for stakeholders when reviewing or resetting baselines. A baseline
serves as a starting point and should be used to establish targets based on the amount of
growth that is expected each year. When a state compares baseline data to data collected at
later points in time, it informs the state if it is making progress.
Reasons to reset the baseline may include changes to the following:
• State data collection tools, methods, or data source
• The indicator measurement required by OSEP
• The population served, such as state eligibility criteria changes
• Substantial improvements in a state’s data quality
Part C and 619 Target Setting Guide July 2021 3Targets
Beyond Federal requirements and OSEP guidance regarding target setting, several general
considerations may be useful for stakeholders when setting targets. This includes the impact of
data quality on setting targets, necessary information to review, notable changes to
acknowledge, and other information that could be useful to consider.
Data Quality I ssues I m pacting Target Setting
• Determine if there are issues and ensure data for the indicator are high-quality. Consider
factors such as data completeness, accuracy, timeliness, and relevance.
• Identify if activities implemented to facilitate the collection of high-quality data have been
effective (e.g., training to address reporting requirements, checking and validating data
entry, and ensuring that the right people are collecting the right data)
Necessary Information for Target Setting
• Collect the following information:
– Prior APRs to identify baseline data, the year it was set, targets previously
established and the results.
– Trends in performance over the last 3 to 5 years, minimally.
– Trends in performance relative to targets.
– Baseline data, including any changes that might have been made.
– Analyses or reasons for meeting or not meeting previous targets.
– Information on how targets were previously calculated and determined with
stakeholders.
System Changes Important for Target Setting
• Consider if changes have been made, such as in data collections methods, analysis,
and reporting.
• Take into account overall state initiatives that might impact state performance and
targets on APR indicators (e.g., look at scope and implementation status of these
initiative(s) and expected impacts).
• Consider fiscal/economic climate of the state and its impact on performance and
targets.
• Take note of the impact of any natural disasters, such as weather and health
emergencies, including pandemics such as COVID-19 and the impact on performance
and targets.
Steps for Setting Targets
The steps for target setting outline a general process for states in preparing, setting, and
communicating targets. The general process applies to all indicators requiring target setting.
Indicator-specific information for target setting can be found under Indicator Specific Guidance
in this guide. The general process information in this guide is designed to work with indicator-
Part C and 619 Target Setting Guide July 2021 4specific guidance to support states in working with stakeholders to establish targets. It may take
multiple sessions to complete target-setting activities, and at times, a pause maybe needed to
find additional data to complete the process.
Step 1. Identify and prepare stakeholders
Ensure stakeholder • Potential stakeholders to consider include parent members of the
diversity Interagency Coordinating Council, parent center staff, parents from local
and statewide advocacy and advisory committees, individual parents,
state and local/regional administrators, practitioners, higher education
representatives, community partners, and other state and local agency
personnel.
• Stakeholders should intentionally represent varied expertise,
perspectives, and the demographics of the population served (e.g.,
race/ethnicity, geographic location, social-economic status(SES)).
• Stakeholders with expertise and interest in reviewing and analyzing data
should be included, without making it a requirement for participation.
Clarify stakeholder • Define the tasks to be accomplished.
roles and • Project the time commitment.
responsibilities
• Outline group member responsibilities.
• Clarify how stakeholder recommendations contribute to state decisions
for setting measurable and rigorous targets.
Prepare • Determine the individual needs of stakeholders to facilitate their optimum
stakeholders involvement.
• Share orientation materials and related resources based on stakeholder
needs.
• Provide support for members without expertise in data analysis to build
their capacity for active participation and contribution. See the DaSy
Stakeholder Knowledge Toolkit: Building Knowledge About Data:
https://dasycenter.org/stakeholder-knowledge-toolkit/
• Plan the process for engaging stakeholders at the target-setting
meeting(s) by sending relevant information prior to the meeting,
considering how to partner stakeholders to increase engagement, etc.
For more information about involving stakeholders in data meetings, see
IDC’s Stakeholders in Data Meetings:
https://ideadata.org/sites/default/files/media/documents/2020-06/2-DMT-
Including_Stakeholders_in_Data_Meetings_TNedits_LAL_0.pdf
• For more information about stakeholder engagement see Leading by
Convening: https://ncsi.wested.org/resources/leading-by-convening/
Step 2. Compile data and resources and conduct analyses
Include indicator- • Pertinent program data (e.g., population increase/decrease, remote
specific data service delivery initiation, when evaluations were paused, policy changes
that impact data, changes in measurement or data collection procedures,
financial data).
• Current data (e.g., baseline, performance, targets).
• Trend data (e.g., performance data, targets) for last 3-5 years and noting
trends relative to baseline.
• Disaggregated data (e.g., trend data by gender, age, race, ethnicity,
disability category, SES, local programs/local education agency (LEA)
indicator performance data).
• Analysis summaries and conclusions of the data.
Part C and 619 Target Setting Guide July 2021 5• Analyses or reasons for meeting or not meeting previous targets.
Collect necessary • Tools or process used in prior analysis to establish and calculate targets.
resources • National data for comparison.
Analyze data • Conduct objective analyses to contribute to the target setting discussion.
In the Indicator Specific Guidance section, each indicator includes
suggestions for indicator specific analyses under Section VII.
• Include necessary illustrations for ease of understanding the data and the
effective and efficient display of data. (See Data Visualization Toolkit:
https://dasycenter.org/data-visualization-toolkit-2/ )
Step 3. Facilitate discussions to develop target recommendations
Questions to • What are the factors that may influence the target setting process (e.g.,
consider changes in budget, initiatives, recent national or state emergencies,
recent measurement changes)?
– How might these factors influence performance in the future years?
– What are the implications these factors have on target setting?
• How does the state’s performance compare to the national picture for the
indicators?
– What, if any, are the implications for target setting?
• Has the state met its previous targets for each of the indicators?
– If so, is the same level of change appropriate for setting the new
targets?
– If not, what factor(s) have served as barriers to prior efforts?
Collect and analyze • Conduct as needed to address questions that emerge during discussions
additional data about target setting.
Step 4. Make decisions about targets
Responsibility • States have the ultimate responsibility to set measurable and rigorous
targets with stakeholder engagement.
Questions to • Are the targets being considered/decided
consider – Rigorous (do they demonstrate significant improvement from the
baseline)?
– Achievable?
– Based on quality data (do the data reflect the population)?
– Understandable?
– Determined with broad stakeholder input?
Step 5. Communicate targets
Final considerations • Report final targets to the stakeholders involved in the process.
• Ensure targets are readily accessible (e.g., publicly available through a
variety of means) and understandable to diverse stakeholders.
• Ensure the justification for setting or changing targets are clearly
described in language understandable to stakeholders.
• Report the targets in the SPP/APR and describe the process used for
setting or changing targets with stakeholders (e.g., which stakeholders
were involved, what type of data was reviewed/used to set targets, how
stakeholders weighed in on decision-making).
Part C and 619 Target Setting Guide July 2021 6Approaches for Target Setting
States may use a variety of target setting approaches 1 and should clearly and completely
explain their rationale and methods. The following information provides an overview and
examples of methods states may want to consider.
P ercent or P ercentage Point I m provem ent
Percent or percentage point improvements are common methods for setting targets. Following
are several different ways of determining and applying these changes over time to target-setting
methods.
Average year-over-year growth/change. Using historical data, calculate the average
growth/change from year to year. This change can be calculated as a percent
change/improvement or a percentage point improvement. For example, if the average growth is
0.8 percentage points, add that amount to the current data for each year (figure 1).
Figure 1. Example of Improvements by Percentage Points (using child outcomes
data)
Actual Targets
2015 2016 2017 2018 2019 2020 2021 2022 2023 2024 2025
SS1 soc-emo 70.0 70.8 71.0 71.8 72.8 74.0 74.8 75.6 76.4 77.2 78.0
Difference 0.8 0.2 0.8 1.0 1.2
Average actual growth = 0.8.
The example below uses the average percent change from year to year and applies that to each
future year. Percent change is less commonly used than percentage point change and is more
difficult to explain (figure 2).
Figure 2. Example of Improvements by Percent Change (using child outcomes data)
Actual Targets
2015 2016 2017 2018 2019 2020 2021 2022 2023 2024 2025
SS1 soc-emo 70.0 70.8 71.0 71.8 72.8 74.0 74.8 75.7 76.5 77.4 78.2
Percent
change 1.14 0.28 1.13 1.39 1.65
Average percent change = 1.12.
Overall growth/change. Calculate the overall growth from two historical points in time, e.g.,
from year 1 to year 5, using either percent or percentage point improvement. Increase the end
target for five years out by that total growth. For example, if the total growth from 2015 to 2020
is 4 percentage points, add that to the end target five years out. Decide if the targets for each
intervening year should increase incrementally by .80 percentage points (4 divided by 5 years)
1
Hubbard, K., Makram, T., Klein, R., & Huang, D. 2020. Target-Setting Methods in Healthy People 2030.
Healthy People Statistical Notes.
Part C and 619 Target Setting Guide July 2021 7or in other increments, depending on state circumstances, e.g., the status of improvement
initiatives (figure 3).
Figure 3. Example of Overall Growth/Change by Percentage Points (using child
outcomes data)
Actual Targets
2015 2016 2017 2018 2019 2020 2021 2022 2023 2024 2025
SS1 soc-emo 70.0 70.8 71.0 71.8 72.8 74.0 78.0
Overall difference from 2015 to 2020 = 4.0.
Moving (rolling) average. If the historical data are not stable, a moving average can be
calculated and added to each of the future years. The moving average may be based on a
period of two, three, or four years, depending on the number of years of historical data
available. Rolling averages need to total numerators and denominators separately first and then
calculate percentages.
New baseline (or no historical data). If historical data are not available or if a new baseline
has been established, e.g., due to changes in data collection methods, start with the new
baseline (or most recent year of actual data) and increase that by a certain percentage or
number of percentage points each year. For a percent improvement, the baseline is multiplied
by a specific percentage, and the resulting value is added to or subtracted from the baseline.
For a percentage point improvement, the baseline, itself a percentage, is improved by adding or
subtracting a specific value, also known as a percentage point.
Start w ith the End Goal
Decide on the target for the last year of the SPP/APR cycle. One approach to setting the end
goal is to determine a meaningful/statistically different value from baseline or current data. The
Child Outcomes Year-to-Year Meaningful Differences Calculator for States can be used for the
C3/B7 indicators on child outcomes. The meaningful difference calculator uses an accepted
formula to determine whether the difference between two percentages is statistically significant
(or meaningful). Statistical tests of significance can be used to determine meaningful differences
for other indicators. Once the end goal is set, determine the incremental targets for the
intervening years.
Trend Analysis and Forecasting
A trendline, also referred to as a line of best fit, is a straight or curved line on a chart that shows
the general pattern or overall direction of the data. Trend analysis is most often used to show
data movement over time, particularly to estimate data in future years. You can decide on a
target based on the trendline projection. An important consideration in trend analysis is how far
back to go; that is, when to start the trendline.
Tools like Excel can be used to add a trendline to a chart and extend the trendline to future
years (forecast). There are different options for doing trend analysis and forecasts in Excel,
depending on the type of data you have.
Part C and 619 Target Setting Guide July 2021 8Linear. A linear trendline is used with simple linear data sets; that is, the pattern in the data points resembles a line. A linear trendline usually shows that something is increasing or decreasing at a steady rate. Moving average. A moving average trendline smooths out fluctuations in the data to show a pattern or trend more clearly. A moving average trendline uses a specific number of data points, averages them, and uses the average value as a point in the trendline. You can determine the number of data points to use in the moving average, e.g., two, three, or four. Logarithmic. A logarithmic trendline is a best-fit curved line that is most useful when the rate of change in the data increases or decreases quickly and then levels out. Linear data typically require fewer data points for projections than other options. Excel can also create confidence intervals and display the R-squared value of a trendline, which is a number that indicates how well your trendline fits your data. The closer the R-squared value is to 1, the better the fit of the trendline. Go to Trend Analysis or Forecasts for more information on using these Excel functions. Statistical M odeling/ Analysis Statistical analysis can be used to help predict future results and thus, targets, using additional data such as population data, regional data, or outliers. For example, a state could stratify its data by the size of the local program/district and weight those data accordingly, or it could look at the change in the results of local programs/districts that have implemented improvement initiatives versus those that have not, and set targets based on scale-up plans. Additional Considerations For each of the approaches, consider changes in state circumstances that may impact performance in any given year, such as data quality issues or the scope and status of improvement initiatives. There may be legitimate reasons for maintaining stability for a few years, and targets may remain the same for several years. Similarly, targets in the intervening years may increase incrementally, but not by the same amount each year. However, targets must show improvement from the baseline in the end. States may want to consider and use more than one method and bring the results of those methods to stakeholders for review and discussion. An effective way to engage stakeholders in the target-setting process is to present these multiple options for targets, explain the rationale for each, and solicit feedback. Presenting these options visually, e.g., all on one graph, allows stakeholders to see the impact of each. An example is presented in Figure 8 in the Examples of Data Visualization section. Part C and 619 Target Setting Guide July 2021 9
Examples of Data Visualization
                                                           This section provides examples of data
   Reminders:                                              visualizations that states may consider
   States have the ultimate responsibility to set          creating to share with stakeholders
   measurable and rigorous targets with stakeholder        during the target setting process. Most of
   engagement.                                             the examples are intended to help
                                                           stakeholders better understand various
   Broad stakeholder input is required throughout the      aspects of the data. The last figure is
   process of target setting.
                                                           intended for displaying a summary of the
   Targets for intervening years may stay the same         results of different target setting
   or reflect decreased performance as long as the         approaches. Each of these charts was
   FFY 2025 target is higher than the baseline.            created using Excel. DaSy's Data
   Targets and baselines can be changed, if                Visualization Toolkit provides more
   necessary, with stakeholder input, with sufficient      resources on the creation and use of
   rationale for the changes, and with OSEP approval.      data visualization products.

Historical Data for I ndicator C3 or B7
Figure 4 is a simple bar graph of historical data for the summary statements for each of the
three child outcomes. The funnel-shaped filter can be used to focus on a subset of data such as
outcomes or years. A shape or text can be inserted to indicate the baseline year.

Figure 4. Sample Bar Graph of Historical Data

         Summary Statement Results by Child Outcome:
                       2013 - 2018
 90%

 80%

 70%
                                                                       2013
 60%
                                                                       2014
 50%
                                                                       2015         Baseline
 40%
                                                                       2016
 30%
                                                                       2017
 20%
                                                                       2018
 10%

  0%
          A-SS1      A-SS2     B-SS1   B-SS2       C-SS1   C-SS2

 Child Outcome A: Social-emotional relationships
 Child Outcome B: Knowledge and skills
 Child Outcome C: Takes actions to meet need

Part C and 619 Target Setting Guide            July 2021                                           10
Bar Graph w ith Contextual I nform ation
The graph in Figure 5 displays historical data in a slightly different way, with data for the three
family outcome indicators grouped by year. The graph also adds important contextual
information, i.e., survey response rates for each year.
Figure 5. Sample Bar Graph with Contextual Information
Family Outcome Results and Response Rates:
2013 - 2018
100%
90%
80%
70%
60%
50%
40%
30%
20%
10%
0%
2013 2014 2015 2016 2017 2018
FO A FO B FO C Response Rate
Family outcome A: Know rights
Family outcome B: Communicate child’s needs
Family outcome C: Help child develop and learn
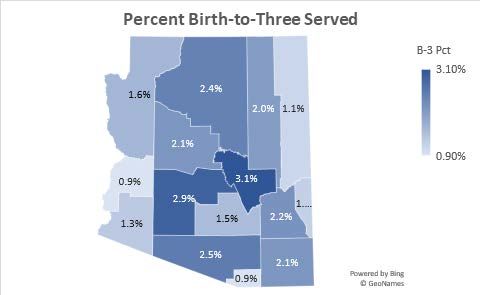
P ercent Birth-to-Three Served by County
The map in Figure 6 displays the percent of children ages birth to three served in Part C, by
county. Though the map does not show data over time, it helps stakeholders look beyond the
statewide data at the variation across counties (or local programs/districts). These county-level
data are fictitious.
Part C and 619 Target Setting Guide July 2021 11Figure 6. Sample Map of Percent Birth-to-Three Served by County
Fam ily Outcom e R esults vs. Targets, Bar or Line Graph
The following two examples (Figures 7 and 8) display the same data. The first uses a bar chart
and the second uses a line graph. They both display the historical data for one family indicator,
knowledge of rights (A), relative to the target for the same year.
Figure 7. Sample Bar Graph of Family Outcome Results vs. Targets
Family Outcome A Results vs. Targets:
2013 - 2018
100% 95% 94% 91%
90% 90% 91% 90% 90% 90% 90%
86%
80%
65%
60%
40%
20%
0%
2013 2014 2015 2016 2017 2018
FO A Results FO A Target
Part C and 619 Target Setting Guide July 2021 12Figure 8. Sample Line Graph of Family Outcome Results vs. Targets
Family Outcome A Results vs. Targets: 2013 -
2018
100%
90%
80%
70%
60%
50%
40%
2013 2014 2015 2016 2017 2018
FO A Results FO A Target
P ercent Birth-to-Three Served and Population Data, by
County
Figure 9 is an example of a combo chart that displays the percent of the birth-to-three
population served using the blue columns and the primary axis on the left, and the total birth-to-
three population displayed using the orange line and the secondary axis on the right.
Disaggregating the data by county (or local program/district) can reveal the extent of variation in
the indicator across those entities, and the addition of the population data adds critical
contextual information. Counties (or local programs or districts) with a much greater number of
children are more likely to influence the statewide results.
Part C and 619 Target Setting Guide July 2021 13Figure 9. Sample Combo Chart of Percent Birth-to-Three Served and Population
Data, by County
Percent Birth-to-Three Served Birth to 3 and B-3 Population, by
County: 2019
3.5 200,000
Birth-to-Three Population
180,000
3
160,000
2.5
Percent Served
140,000
2 120,000
100,000
1.5 80,000
1 60,000
40,000
0.5 20,000
0 0
AZ AZ AZ AZ AZ AZ AZ AZ AZ AZ AZ AZ AZ AZ AZ
Apache Cochise Coconino Gila Graham Greenlee La Paz Maricopa Mohave Navajo Pima Pinal Santa Cruz Yavapai Yuma
Axis Title
Percent Served B-3 B-3 Pop
Using Filters or Slicers to Focus on Specific I nform ation
Figure 10 illustrates the use of filters (in a chart) or slicers (in a PivotChart) to focus on specific
information, such as subsets of data. Users of this PivotChart would be able to use slicers to
look specifically at the child outcomes progress categories for one or more counties and/or
racial/ethnic groups. (The county-level data are fictitious).
Figure 10. Sample of Using Filters or Slicers to Focus on Specific Information
Part C and 619 Target Setting Guide July 2021 14Sum m ary of Target-Setting Approaches
Figure 11 displays the historical data for an indicator and the future values (targets) for each of
the different target-settings methods used.
Figure 11. Sample of Summary of Target-Setting Approaches
Historical Data and Future Values by Target Setting Method:
Indicator XX
100
90
80
70
60
Percent
Historical
50 Data
40 Method 1
30
Method 2
20
10 Method 3
0
Method 4
2015 2016 2017 2018 2019 2020 2021 2022 2023 2024 2025
FFY
Part C and 619 Target Setting Guide July 2021 15I ndicator Specific Guidance
Indicator C2–Settings
Indicator-specific guidance is provided separately for results indicators where target setting is
required, including C2-Settings. There are eight sections that support target setting for this
indicator. This indicator specific guidance is intended to be used as a companion to the general
guidance.
Topic Guidance
I. Indicator Description Percent of infants and toddlers with IFSPs who primarily receive early
intervention services in home or community-based settings.
(20 U.S.C. 1416(a)(3)(A) and 1442)
Per the OSEP SPP/APR Universal Technical Assistance for FFY
2020-2025 guidance, the FFY 2025 target for this indicator does not
need to show improvement over baseline if the FFY 2025 target is at
least 95%.
II. Federal Indicator No changes effective with the release of the FFY 2020-25 Part C
Changes Measurement Table.
III. State Indicator Has the state made any changes to the data collections methods
Specific Changes and/or data source?
To the extent possible, determine the impact of these changes on the
results of this indicator.
IV. State Initiatives • What state initiatives are in place to increase the percentage of
Related to this children who primarily receive early intervention services in the
Indicator home or a community-based setting?
• What is the scope and expected impact?
• How long will it take to see the expected impact?
V. Data to Consider The state will want the following data available:
• Indicator 2 performance data relative to targets for the last three to
five years
• Indicator 2 baseline data
VI. Indicator Specific Data The data reported in this indicator should be consistent with the state’s
Quality Issues 618 settings data. If not, the state would have had to explain why in a
data note submitted to OSEP.
VII. Indicator Specific History
Analyses • What were our targets and how were they set?
• If changes were made to targets, what was the basis for the
change?
• What were the trends in performance relative to targets?
• Were there changes made to the baseline in the last five years?
What was the rationale for the change?
How do current data compare to data over the past 3 to 5 years?
• Were there data relatively stable over time, or was there a lot of
variation?
• If variation, what factors could have contributed to the variation?
Part C and 619 Target Setting Guide July 2021 16Topic Guidance
• Consider the impact of differences at the local program level, e.g.,
the impact of one or several large programs.
• Consider other factors such as race/ethnicity, SES, age of the
child, and disability/eligibility category.
VIII. Indicator Specific EMAPS IDEA Part C Child Count and Settings User Guide at
Resources https://www2.ed.gov/about/inits/ed/edfacts/index.html
Part C SPP/APR Indicator Analyses at
https://ectacenter.org/partc/partcapr.asp#analyses
Part C and 619 Target Setting Guide July 2021 17Indicators C3 and B7–Early Childhood and Preschool Outcomes
Indicator-specific guidance is provided separately for results indicators where target setting is
required, including C3 and B7-Early Childhood and Preschool Outcomes. There are eight
sections that support target setting for this indicator. This indicator specific guidance is intended
to be used as a companion to the general guidance.
Topic Guidance
I. Indicator Description Percent of infants and toddlers/preschoolers with IFSPs/IEPs who
demonstrate improved
A. Positive social-emotional skills (including social relationships)
B. Acquisition and use of knowledge and skills (including early
language/ communication)
C. Use of appropriate behaviors to meet their needs.
(20 U.S.C. 1416(a)(3)(A) and 1442)
Targets are required for Summary Statement 1 and Summary
Statement 2 for each of the three outcomes, yielding a total of six
targets. Unless sampling, targets are based on all children with
IFSPs/IEPs who exited the Part C/619 program within the reporting
year and received services for at least six months.
For Part C: If the State’s Part C eligibility criteria include infants and
toddlers who are at risk of having substantial developmental delays,
targets should be based on all children excluding those at-risk.
II. Federal Indicator No changes effective with the release of the FFY 2020-25 Part C
Changes Measurement Table
III. State Indicator- • Has the state made any changes to the data collection methods or
Specific Changes data source?
• Has the state made any changes to
– The measurement approach, e.g., changing from the use of one
tool and publisher algorithms to the Child Outcomes Summary
(COS) process?
– Assessment tools?
– Implementation of the COS process or other data collection
methods, including adjustments made during the COVID-19
pandemic?
– Calculations due to changes in publisher algorithm
conversions?
IV. State Initiatives • What state initiatives (e.g., SSIP, targeted training, or other
Related to this improvement activities) are in place that may impact the outcome
Indicator results? (Data quality initiatives are discussed in line VI.)
– How and when are these initiatives predicted to impact the
results?
– Consider the implementation status of the activities and plans
for scaling up in determining when the impact would be
expected.
– Consider whether the improvement activities are being
implemented statewide or in a limited subset of
programs/districts. If focused on a subset, consider the
proportion of children in that subset and how that subset will
impact the overall state summary statements.
Part C and 619 Target Setting Guide July 2021 18Topic Guidance
• Are the improvement activities intended to impact a specific child
outcome? If so, consider how much more progress is expected for
that outcome over the other outcomes.
• It can take several years to have entry and exit data on a full cohort
of children after an improvement activity is implemented and to see
the full impact on one or more of the child outcomes.
V. Data to Consider The state will want to have the following data available for at least the
last five years:
• Performance data relative to targets for Summary Statements 1
and 2 for each of the three outcomes
• Progress category data for each of the three outcomes
• The number/percent of children receiving services for at least six
months
• Completeness of data
• Baseline data for Summary Statements 1 and 2 for each of the
three outcomes.
VI. Indicator-Specific Has the state identified any data quality issues?
Data Quality Issues • Completeness of the data
– If completeness of the data is a concern, the state first needs to
consider how many more children they expect to report child
outcomes data for a given year.
– The state needs to consider if the children not currently being
reported on in the child outcomes data are different from the
group of children for whom child outcomes data are currently
reported. If so, how might they be different and what type of
progress might be expected from those children (e.g., are most
of the children without outcomes data medically fragile or have
established conditions)? Are there differences in completeness
based on geographic region or race/ethnicity?
– The state can use the Summary Statement Calculator to project
the impact on the state’s summary statement values by entering
their current year’s data and increase children in the progress
categories based on their expectations. For instance, if a
particular program/agency that serves children with an
established condition is reporting very few children, the state
might expect more children to be in progress categories b, c, or
d rather than e. The state can simulate various hypothesized
combinations to project the impact on the summary
statement(s) and use that to guide their target setting.
• Outliers in progress category data
– Sometimes data quality issues can occur because of
overrating/overestimating children’s functioning, resulting in a
higher than expected percentage of children in progress
category e; conversely, data quality issues can occur because
of underrating/underestimating functioning, resulting in a higher
than expected percentage of children in progress category a.
Improvements in data quality would result in fewer children in
progress category e in the first case, and fewer children in
progress category a in the second.
Part C and 619 Target Setting Guide July 2021 19Topic Guidance
For either of these issues, the state would want to analyze the
data to determine the magnitude or scope of the issue, e.g., is it
occurring statewide or just in some local programs/districts and
is it a major or minor issue? The state would also have to
consider what the children’s actual progress has been (i.e., if
the percentage of children in progress category a appears too
high, is their functioning greatly underestimated, meaning one
would see more children in progress categories c or d, or is it
minor and result in more children in progress category b?)
In either of these two scenarios (under- or overrating), the state
can use the Summary Statement Calculator to project the
impact on the state’s summary statement values. The summary
statement calculator allows the state to move a portion of the
children from one progress category to another in various
combinations to determine the impact on each summary
statement.
– Consider the scope and timing of any strategies to improve data
quality.
How have the results trended over time (upward, downward,
stable, or fluctuating)?
Has new training been added or has the data collection
method changed? If so, look at the trends since that change.
Statewide improvement efforts could take several years to
implement and realize results. It is not unreasonable for the
targets to be stable (flat?) for the first few years before
increasing.
– Data quality issues may not be present across all three
outcomes. They may occur with one or two outcomes but not all
three.
VII. Indicator-Specific • Examine trends in the data.
Analyses – How have the summary statement percentages compared to
the targets over time? Were targets met? If not, what were
some possible reasons?
– Were there changes to the targets? If so, what were the
changes? When did they occur and why?
– How have your progress categories percentages changed over
time? Were these trends expected?
– Has data completeness remained stable over time or has it
varied?
• How do your trends compare to the national average and to similar
states? Are there characteristics of your state that explain your
position?
• How much do results vary across local programs/districts?
– Compare the summary statement data by local program/district
to identify variation and outliers. Consider the low-performing
programs/districts and determine how the data would change if
those programs/districts moved closer to the mean of the state.
Use the Summary Statement Calculator to determine
reasonable targets.
• What other factors, such as program improvement efforts) or child
characteristics, (disability/eligibility, socioeconomic status, or
Part C and 619 Target Setting Guide July 2021 20Topic Guidance
race/ethnicity,) could be impacting results? Do any of these factors
help explain the differences by program/district?
– If the state has experienced changes in the types of children
served, consider disaggregating by those characteristics.
• How much of an increase from the baseline will be needed for a
meaningful increase?
– The state can enter the baseline year data into the Meaningful
Differences Calculator for States to determine how much of an
increase in the summary statement percentages is needed for a
meaningful, statistically significant increase. If the number of
children in the targeted year is expected to increase or
decrease by 100 or more, that adjustment should be made to
the N size for the year(s) of the future summary statement
values.
– The state should consider whether it is reasonable to expect a
meaningful increase each year or just toward the end of the 5-
year SPP/APR period. See the section on Target Setting
Methods for additional methods, including how to set
incremental targets.
VIII. Indicator-Specific State Child Outcomes Data Profile (disseminated annually to states
Resources by ECTA/DaSy).
Provides current year and historical data for summary statements,
progress categories, and completeness. Displays unexpected patterns
in progress category data and comparisons to national averages.
Summary Statement Calculator. Converts progress category data
to summary statements for each of the three outcomes.
Child Outcomes Year-to-Year Meaningful Differences Calculator for
States (2017). Can be used to look at the statistical significance of
change in a state’s child outcomes summary statements from year-to-
year.
Part C and 619 Target Setting Guide July 2021 21Indicator C4–Family Outcomes
Indicator-specific guidance is provided separately for results indicators where target setting is
required, including C4-Family Outcomes. There are eight sections that support target setting for
this indicator. This indicator specific guidance is intended to be used as a companion to the
general guidance.
Topic Guidance
I. Indicator Description Percent of families participating in Part C who report that early
intervention services have helped the family:
A. Know their rights
B. Effectively communicate their children's needs
C. Help their children develop and learn
(20 U.S.C. 1416(a)(3)(A) and 1442)
Targets are required for each of the three family outcomes, yielding a
total of three targets, one for each outcome. Targets are based on the
percent (# of respondent families participating in Part C who report
that early intervention services have helped them (achieve family
outcome A, B, or C) divided by the (# of respondent families
participating in Part C) times 100.
II. Federal Indicator Beginning with the FFY 2022 SPP/APR, due February 1, 2024, states
Changes must include race and ethnicity in its analysis to report on
representativeness. In addition, the State’s analysis must also include
at least one of the following demographics: socioeconomic status,
parents or guardians whose primary language is other than English
and who have limited English proficiency, maternal education,
geographic location, and/or another demographic category approved
through the stakeholder input process.
Current requirements include state analysis of the extent to which the
demographics of families responding are representative of the
program demographics, such as race and ethnicity, age of the infant or
toddler, and geographic location. If the responding families are not
representative of the program demographics, the state must describe
the strategies used to ensure that future data are representative of
those served.
III. State Indicator What if any changes have been or will be made in the data collection
Specific Changes process? Consider any changes in:
• Survey tool (e.g., survey wording, structure, length)
• Survey population (e.g., families exiting, families with an annual
IFSP, families in program for # months, all families with an IFSP
regardless of time in program)
• Use of sampling or changes to sampling approach
– Survey dissemination (e.g., in person, mail, phone/text, web-
based [email, online website], multi-modal)
– Survey dissemination timing (at exit, # months/weeks before
exit, at IFSP meeting, at transition meeting)
– Survey reminders
– Survey incentives
– Survey return options (e.g., in person, mail, phone/text, web-
based [email, online website], multi modal)
Part C and 619 Target Setting Guide July 2021 22Topic Guidance
• Implemented or planned changes in the calculation of the data
– Analysis techniques
– Thresholds for determining outcome as met (e.g., revision to cut
points on a 6-point scale with cut point a 4 or above to indicate
met)
IV. State Initiatives What if any system changes have occurred or are planned to occur
Related to This that affect family outcomes? Consider system framework components.
Indicator • Governance, finance, personnel/workforce, data system,
accountability, quality improvement, and quality standards
• Is a new or increased emphasis on EBP being implemented?
• Is the initiative statewide or limited to particular programs?
• Are initiatives taking place with fidelity?
• When would the results of the EBP have an impact on family
outcomes?
• Which of the three family outcomes do the new/increased
emphasis on EBP impact? How?
V. Data to Consider The state will want to have the following data available:
• Survey return rates and changes over time
• Performance data for the last three to five years relative to targets
for parents knowing their rights, effectively communicating their
children’s needs, and helping their children develop and learn
• Baseline data
VI. Indicator Specific Data Completeness of the data
Quality Issues • What is the return rate?
• Are the data representative of the population served?
• What populations are missing?
• Are the item level data complete?
Accuracy of the data
• Are there outliers (e.g., significantly higher or lower outcomes,
significantly higher or lower return rates)?
VII. Indicator Specific What do the current data reveal?
Analyses • Meeting the current targets?
• Comparison of current data to the historical trend line (over 3 – 5
years)?
• Comparison of the current and trendline data to baseline(s) (plural
in the event of changes)?
• How do current and trendline data compare to the target(s)?
• Increases or slippage (changes in the data)? Were the
increases/slippage short or long-term?
• What factors contributed to the changes?
• Are the contributing factors sustained?
Consider questions such as:
• Does the data look different from national data? National data can
be a useful way to put state data in the context of the national
picture while acknowledging variations in state approaches. Some
Part C and 619 Target Setting Guide July 2021 23Topic Guidance
caution is advised when comparing state-level family data to
national data; the national data represent varying approaches and
scoring methods that can have big impacts on state percentages.
• Does our data look different from other states using a similar
survey approach?
• Is the performance different across the outcomes?
• Are the data stable over time? Is it trending upward or downward?
• Are outcomes similar across our programs? Are some doing better
than others?
Disaggregate data to identify trends, questions, or possible anomalies.
Examine targets relative to representativeness factors. How do
outcomes vary by the following factors?
• Race
• Ethnicity
• Socioeconomic status
• Parents or guardians whose primary language is other than English
and who have limited English proficiency
• Maternal education
• Geographic location
• Time in program
• Gender
• Age of child
• Disability/Eligibility category
• Other
VIII. Indicator Specific Family Outcomes Year-to-Year Meaningful Differences Calculator for
Resources States (2016)
Look at the statistical significance of change in your state’s family
outcomes data from year-to-year and compare local performance to
the state’s performance. This calculator computes the 90% confidence
interval around values. Confidence intervals can be used to
understand the precision of values; however, values with very large
confidence intervals (more than ±5%) should be interpreted with
caution.
Family Indicator Local Program Graphing Template (2016)
Create graphs comparing your family indicator data by local program.
National-State Family Outcomes Data (Indicator C4) Graphing
Template (2018)
Compare your state’s C4 family outcomes data to the national data in
the three sub-indicator areas. Make comparisons to subgroups of
states that use the same survey and scoring approach for the FOS
with recommended scoring, the FOS-Revised with recommended
scoring, and the NCSEAM with Rasch scoring. States that use other
scoring or surveys can graph their data using a comparison to national
data. National data in the calculator are for FFY 2016 and were
submitted by states in February 2018.
Part C and 619 Target Setting Guide July 2021 24Topic Guidance
Part C Indicator 4: Family Outcomes Data (FFY 2018)
This online presentation shares the FFY 2018 results from the
Indicator C4 Family Outcomes data, including state approaches to the
survey, data quality, performance trends and resources.
Response Rate and Representativeness Calculator (2015)
Compute response rates for your state’s family survey data and
determine if the surveys you received represent the target population.
The calculator uses a statistical formula to determine if two
percentages (% of surveys received vs. % of families in the target
population) should be considered different from each other. Enter the
values by subgroup, and the calculator will compute the statistical
significance of the difference between the two percentages and
highlight significant differences. Instructions about how to enter data
into the calculator appear at the top of each tab.
SSIP Family Outcomes Broad Data Analysis Template (2014)
Provides guidance for looking at how programs in the state are helping
families relative to national data, across years, within the state, and by
comparisons across programs within the state. This template assists
states in conducting an initial analysis of their family outcomes data.
This document uses APR family indicator data to illustrate analyses,
but states may also want to perform similar analyses on other family-
level outcomes or results data.
State Approaches to Family Outcomes Measurement
This link identifies the survey tools used by states, including the Early
Childhood Outcomes (ECO) Family Outcomes Survey-Original, ECO
Family Outcomes Survey-Revised, National Center for Special
Education Accountability Monitoring (NCSEAM) Survey, and other
state-developed surveys.
Part C and 619 Target Setting Guide July 2021 25You can also read