February 2020, Revised September 2021 The authors would like to acknowledge the valuable advice and suggestions provided by seminar audiences at ...
←
→
Page content transcription
If your browser does not render page correctly, please read the page content below

NBER WORKING PAPER SERIES

                         MEDIA COMPETITION AND NEWS DIETS

                                      Charles Angelucci
                                         Julia Cagé
                                      Michael Sinkinson

                                      Working Paper 26782
                              http://www.nber.org/papers/w26782

                    NATIONAL BUREAU OF ECONOMIC RESEARCH
                              1050 Massachusetts Avenue
                                 Cambridge, MA 02138
                         February 2020, Revised September 2021

The authors would like to acknowledge the valuable advice and suggestions provided by seminar
audiences at the Berlin Applied Micro Seminar, Columbia University, the FCC, Imperial College,
Harvard/MIT joint IO Workshop, INSEAD, London Business School, London School of
Economics, the University of Mannheim, Microsoft, the NYC Media Workshop, Stanford
University, the Toulouse School of Economics, the Universitat de Barcelona, and Wharton. We
are also grateful to conference participants at the 19th CEPR-JIE Applied IO Conference, the
HEC Montréal-CIRANO-RIIB Conference on Industrial Organization, the Petralia
Workshop 2017, the 15th Annual Media Economics Workshop, the IAST Workshop on
“Information, Communication, and Knowledge in Historical Perspective”, the 4th Rome Junior
Conference on Applied Microeconomics, and the Social & Political Economics Conference
at John Hopkins. This paper particularly benefited from discussions with Clément de
Chaisemartin, Ruben Enikolopov, Lisa George, Doh-Shin Jeon, Sarah Laval, Simone
Meraglia, Andrea Prat, Jonah Rockoff, and Ekaterina Zhuravskaya. We thank Luca Bassem
Abdul Hay, Matteo Di Bernardo, Paul Berthe, Shelley Han, Jameson Lee, Ondre Padgett,
Timothy Rickert, Arjuna Sakae Anday, Rachel Tosney, and more particularly Nicolas
Longuet Marx and Jett Pettus for excellent research assistance, and Yannick Guyonvarch for his
precious help with the didmultipleGT analysis. Julia Cagé thanks the French National
Research Agency (ANR) for funding (reference: ANR-17-CE26-0004-01), and the Sciences Po’s
Scientific advisory board (SAB). All errors remain our own. The views expressed herein are
those of the authors and do not necessarily reflect the views of the National Bureau of Economic
Research.

NBER working papers are circulated for discussion and comment purposes. They have not been
peer-reviewed or been subject to the review by the NBER Board of Directors that accompanies
official NBER publications.

© 2020 by Charles Angelucci, Julia Cagé, and Michael Sinkinson. All rights reserved. Short
sections of text, not to exceed two paragraphs, may be quoted without explicit permission
provided that full credit, including © notice, is given to the source.
Media Competition and News Diets
Charles Angelucci, Julia Cagé, and Michael Sinkinson
NBER Working Paper No. 26782
February 2020, Revised September 2021
JEL No. D4,L11,L15,M37,N72

                                          ABSTRACT

Technological innovations in content delivery, such as the advent of broadcast television or of the
Internet, threaten local newspapers’ ability to bundle their original local content with third-party
content such as wire national news. We examine how the entry of television – with its initial
focus on national news – affected local newspapers as well as consumer news diets in the United
States. We develop a model of local media and show that entry of national television news could
reduce the provision of local news. We construct a novel dataset of U.S. newspapers’ economic
performance and content choices from 1944 to 1964 and exploit quasi-random variation in the
rollout of television to show that this new technology was a negative shock in both the readership
and advertising markets for newspapers. Newspapers responded by providing less content,
particularly local news. We tie this change towards increasingly nationalized news diets to a
decrease in split-ticket voting across Congressional and Presidential elections.

Charles Angelucci                                Michael Sinkinson
Applied Economics                                Yale School of Management
Sloan School of Management                       165 Whitney Ave, Suite 3473
100 Main Street                                  New Haven, CT 06511
Cambridge, Ma 02142                              and NBER
cangeluc@mit.edu                                 michael.sinkinson@yale.edu

Julia Cagé
Sciences Po Paris
28 Rue des Saints-Pères
75007 Paris
France
julia.cage@sciencespo.fr

A data appendix is available at http://www.nber.org/data-appendix/w26782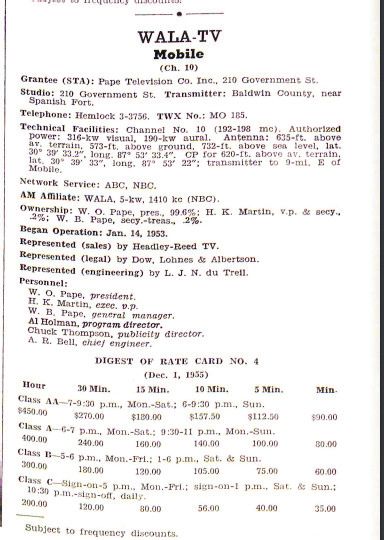
Media Competition and News Diets

                       Charles Angelucci1 , Julia Cagé2 , and Michael Sinkinson3

                                     1
                                         Massachusetts Institute of Technology
                                            2
                                                Sciences Po Paris and CEPR
                                                3
                                                    Yale University and NBER

                                                       September 4, 2021

                                                             Abstract

        Technological innovations in content delivery, such as the advent of broadcast television
        or of the Internet, threaten local newspapers’ ability to bundle their original local con-
        tent with third-party content such as wire national news. We examine how the entry
        of television – with its initial focus on national news – affected local newspapers as well
        as consumer news diets in the United States. We develop a model of local media and
        show that entry of national television news could reduce the provision of local news. We
        construct a novel dataset of U.S. newspapers’ economic performance and content choices
        from 1944 to 1964 and exploit quasi-random variation in the rollout of television to show
        that this new technology was a negative shock in both the readership and advertising
        markets for newspapers. Newspapers responded by providing less content, particularly
        local news. We tie this change towards increasingly nationalized news diets to a decrease
        in split-ticket voting across Congressional and Presidential elections.
        Keywords: Media, Local News, Television, Newspapers, Advertising, Bundling, Split-
        Ticket Voting
        JEL No: D4, D7, L11, L15, M37, N72

     The authors would like to acknowledge the valuable advice and suggestions provided by seminar audiences at the Berlin Applied
Micro Seminar, Columbia University, the FCC, Imperial College, Harvard/MIT joint IO Workshop, INSEAD, London Business School,
London School of Economics, the University of Mannheim, Microsoft, the NYC Media Workshop, Stanford University, the Toulouse School
of Economics, the Universitat de Barcelona, and Wharton. We are also grateful to conference participants at the 19th CEPR-JIE Applied
IO Conference, the HEC Montréal-CIRANO-RIIB Conference on Industrial Organization, the Petralia Workshop 2017, the 15th Annual
Media Economics Workshop, the IAST Workshop on “Information, Communication, and Knowledge in Historical Perspective”, the 4th
Rome Junior Conference on Applied Microeconomics, and the Social & Political Economics Conference at John Hopkins. This paper
particularly benefited from discussions with Clément de Chaisemartin, Ruben Enikolopov, Lisa George, Doh-Shin Jeon, Sarah Laval,
Simone Meraglia, Andrea Prat, Jonah Rockoff, and Ekaterina Zhuravskaya. We thank Luca Bassem Abdul Hay, Matteo Di Bernardo, Paul
Berthe, Shelley Han, Jameson Lee, Ondre Padgett, Timothy Rickert, Arjuna Sakae Anday, Rachel Tosney, and more particularly Nicolas
Longuet Marx and Jett Pettus for excellent research assistance, and Yannick Guyonvarch for his precious help with the didmultipleG T
analysis. Julia Cagé thanks the French National Research Agency (ANR) for funding (reference: ANR-17-CE26-0004-01), and the Sciences
Po’s Scientific advisory board (SAB). All errors remain our own. An online Appendix with additional empirical material is available here.
1    Introduction
A local newspaper’s traditional economic model was to bundle its original local news content
with different types of third-party content, such as wire national news, weather, and sports,
into a single product to sell to consumers, and, in turn, to sell consumers’s attention to
advertisers. Over the past several decades, technological innovations such as television and the
Internet have challenged local newspapers’ once unique ability to monetize third-party content.
In particular, there has been a fall in distribution costs and a proliferation of advertising-
financed media outlets catering to specific types of content traditionally included in local
media bundles: sports channels, classifieds websites, national cable news channels, etc. These
new media outlets have affected both how information is produced (Cagé et al., 2020) and
consumed (Boczkowski et al., 2017; Athey et al., 2018; Kennedy and Prat, 2019), and have
weakened the traditional economic model of local print media. Local newspapers are becoming
smaller, lighter publications with fewer readers and advertisers, when they do not simply go
out of business (see e.g. Abernathy, 2020). The resulting decline in the production and
consumption of local news could have far-reaching political and social consequences, which
we are only beginning to fully appreciate.
    In this paper, we investigate how local newspapers adjust their production of local news
when the market for national news becomes more competitive. We study whether the resulting
changes in the amount of local versus national news individuals are exposed to affect voting
behavior, particularly voters’ propensity to engage in straight-ticket voting across elections.
To study these issues, we use historical data to examine how the entry of television affected
local newspapers in the United States from 1944 to 1964. We exploit the fact that technological
constraints at the time meant that television stations offered mostly national news and general
entertainment programming, whereas virtually all newspapers bundled original local news
with syndicated national news.
    To formalize this idea that a more competitive national news market may affect a local
newspaper’s ability to produce local news, we develop a simple model of newspaper content
choice and pricing. In our model, an incumbent media outlet chooses how much local and
national news to include in its bundle in order to maximize profits across both the readership
and advertising sides of the market. We show that entry in the market for national news
makes bundling less profitable by limiting the incumbent’s ability to extract consumer surplus.
This diminished ability to leverage bundling, in turn, decreases the incumbent’s incentives to
provide both local and national news. Although our model is special in several ways, it offers
a cautionary tale regarding the production of local news in a more competitive environment.
    The main empirical challenge we face in examining the effect of television stems from the
non-exogenous nature of the roll-out of television: television entered larger and wealthier cities
first. Our empirical strategy exploits exogenous variations in the timing of the introduction of

                                                1
television in mid-sized markets in the United States. In particular, in the spirit of Gentzkow
(2006) and Gentzkow and Shapiro (2008), we use the timing of the Federal Communications
Commission (FCC) “freeze” that occurred between 1948 and 1952, primarily due to engineer-
ing difficulties. The freeze occurred as many mid-size markets were receiving licenses, and
therefore we observe a natural experiment in the entry date of television in a large set of
television markets on opposite sides of the freeze. A typical television market covered several
newspaper markets, offering a large set of treatment and control print news markets. These
features allow us to isolate and measure the impact of television on local newspapers.
    The empirical analysis required a significant data collection effort. We digitized annual
circulation, cover price, advertising rates, and advertising quantity data for the universe of
U.S. daily newspapers for 1944-1964.1 We combine this with data we digitized regarding
the first broadcast dates of all television stations in the U.S.. For each station, we observe
the tower’s location, height, channel, and broadcasting power. We use this data to construct
reception contours to precisely determine which newspaper markets were exposed to television
at a given point in time. For a subset of newspapers exposed to the freeze whose content have
been digitized, we further gather data on the content of the newspaper itself. We focus on
a sample of 102 newspapers that had full issues available from an online archive. We code
the content of these newspapers for the third Tuesday and Saturday of March and the third
Thursday and Saturday of September for each year from 1946 to 1955. We manually measure
the quantity of news (categorized by type) versus advertising, photos, and editorials, noting
any content sourced from a wire service. We additionally use machine learning techniques to
identify the amount of article text on each page of each of these issues, giving us an objective
measure of the amount of content contained within each issue.
    We find that the entry of television led to a 3.1% decrease in circulation and a 3.3% decrease
in subscription price. These effects are mostly concentrated among evening newspapers, which
were the majority of newspapers at the time and which faced fiercer competition from TV. This
suggests consumer substitution away from newspapers following the introduction of the new
technology. Moreover, the entry of television represented the entry of a new competitor in the
advertising side of the market: according to our estimates, it led to a 2% decrease in newspaper
advertising rates and to a 3.9% decrease in evening newspapers’ national advertising quantity.
We do not find an effect on local advertising quantities; this is most likely due to the absence
of local advertising on television at the time.2 We confirm these results with a variety of
matching estimators and robustness checks.
    Next we investigate the extent to which the entry of television affected newspaper content,
   1
     The data come from the Editor & Publisher International Yearbook. Advertising quantity data, or “lin-
eage”, come from a separate but related data source, and cover a majority, but not all, publications. While
there is less coverage, the data are conveniently broken out by type of advertising, including local, national,
classified, etc.
   2
     We do not find an effect on classified advertising either.

                                                      2
and in particular, the provision of local news. We find that following the entry of television,
the total number of stories published decreased by 6.6%. The decrease in the number of
stories is driven mainly by a 10.1% drop in original local news stories. By contrast, the drop
in the number of (wire) national news is small and not statistically significant. Consistent
with this, we find limited evidence of lower reliance on subscriptions to news services.
    Taken together, the introduction of television with its primarily national focus in news,
the fall in local newspapers’ readership, and the lower production of local news by newspapers
point to a strong shift towards more national news diets. The resulting change in voters’ news
diets, in turn, offers a unique setting to test whether increasingly nationalized news diets lead
to greater “nationalization” of local politics (Hopkins, 2018). We examine ticket splitting in
Congressional and Presidential elections by collecting county-level election data for the period
1932-1964 and computing for each county the share of its territory covered by television. We
document that the entry of television and the crowding out of local information led to less
split-ticket voting, in particular for House elections which, arguably, were more dependent on
newspapers’ coverage.
    Our contribution is threefold. First, we build an entirely novel and comprehensive dataset
on local newspapers and television stations. In particular, we collect detailed information on
prices and quantities prevailing on both sides of the market from historical records available
only in paper format. Our dataset covers 1, 963 newspapers, 1, 537 news markets, and 32, 296
newspaper-years. Moreover, to the extent of our knowledge, our paper is the first to provide
detailed information on the evolution of the actual content of newspapers and, in particular,
their provision of local news.3 Second, we provide direct evidence of the effect of television’s
entry on the market for newspapers: we document a direct substitution effect towards tele-
vision on both sides of the market. Third, we show that the entry of (national) news from
television had compositional effects on the average news diets of consumers. On the one hand,
it affected the quantity of news consumed – given the substitution away from newspapers.
On the other hand, for those consumers still reading the same newspapers, it affected the
news they were given to read on a daily basis. We take this, combined with our findings on
ticket splitting, as evidence that shocks to ad-supported media can have significant real effects
outside of the market for news.
    Our findings contribute to the ongoing debate regarding the provision of local news in
the modern media landscape. Although one needs to be careful in drawing too much of a
parallel between different technological innovations, the entry of television and the advent of
the internet have in common that they allowed low-cost national distribution of content. By
   3
     There exists a growing empirical literature studying newspaper content, but its focus is on political bias
rather than the nature or quantity of news produced (Groseclose and Milyo, 2005; Gentzkow and Shapiro,
2010; Puglisi and Snyder, 2015; Gentzkow et al., 2019). Cagé et al. (2020) investigate the quantity of news
produced online, but only for one year (2013).

                                                      3
and large, these innovations did not lead to entry in the market for local news: to this day,
local newspapers effectively remain the exclusive providers of city-level journalism. Instead,
both innovations diminished local newspapers’ ability to monetize third-party content such
as national news or entertainment.4 Much like the entry of television meant that newspaper
readers could get their national news elsewhere, with the internet classified ads have moved
to specialized online outlets (e.g., craigstlist.com or monster.com), soft news about local
communities are provided free of charge on social media, and the largest national news outlets
have become ever more dominant. Although more evidence is needed before making drastic
policy suggestions, our results suggest a pessimistic view on the economics of providing local
news.

Literature review         An important strand of literature has highlighted how changes in the
market for news affect political outcomes (see e.g., Snyder and Strömberg, 2010; Gentzkow
et al., 2011; Drago et al., 2014; Cagé, 2020). Analyzing the effect of the introduction of the
Internet in, respectively, Germany and the United Kingdom, Falck et al. (2014) and Gavazza
et al. (2019) show that the Internet decreased turnout, due to a substitution away from media
with higher news content. Moreover, the provision of local news is key to both political
participation and government accountability at the local level (see e.g., Strömberg, 2004b;
Ferraz and Finan, 2008; Snyder and Strömberg, 2010; Mastrorocco and Ornaghi, 2020). The
expansion of national media into local news markets may affect the consumption of local
news and, therefore, political outcomes (Martin and McCrain, 2019). Gentzkow (2006) shows
that the introduction of television led to lower Congressional election turnout, and provides
aggregate evidence suggestive of a crowding-out of local political information.
       Gentzkow (2006) is the first paper to exploit the FCC freeze as an exogenous source of
variation of the entry of television (see also Gentzkow and Shapiro, 2008). Our paper is
complementary to his: we explicitly investigate the effect of the introduction of television on
newspapers’ circulation and content choices. We depart in terms of identification with respect
to this previous work as we have richer data: there are many newspaper markets per television
market and we have annual data on outcomes of interest. Therefore, we are able to focus on
the markets that saw entry of television precisely before and after the freeze, i.e., that were
most clearly exogenously treated by the freeze. Further, our findings suggest that the decrease
in turnout found by Gentzkow (2006) may be due not only to a substitution of readers away
from local newspapers, but also to a reduction in the amount of local news offered to the
consumers who carry on reading newspapers. Building on these findings, we document that
   4
     Naturally, both the advent of television and that of the Internet also constituted strong negative shocks
to the advertising side of the daily newspaper market (see e.g. Athey and Gans, 2010; Athey et al., 2018). By
contrast, Chandra and Kaiser (2014) document that in the case of magazines, the Internet has had a positive
effect on the value of targeted advertising.

                                                      4
voters’ greater exposure to national versus local news following the introduction of television
increased their propensity to engage in single-ticket voting in congressional elections (see
additional references in Section 6).
       Newspapers in our sample overwhelmingly engage in bundling, by selling national wire
news alongside local news. Bundling allows companies to exploit complementarities in con-
sumption and cost savings in production. Bundling also allows monopolists to extract higher
consumer surplus (e.g., Stigler, 1968; Adams and Yellen, 1976; Schmalensee, 1982; McAfee
et al., 1984; Bakos and Brynjolfsson, 1999; Chen and Riordan, 2013) and deter entry (e.g.,
Whinston, 1990; Nalebuff, 2004).5 Innovations in content delivery, such as television or the
Internet, have led to a proliferation of general-interest media outlets, thereby diminishing
the once unique ability enjoyed by local newspapers in monetizing third-party content. Our
theoretical model centers on this idea of the newspaper as a bundle: we contribute to the
literature by embedding bundling in a two-sided model with endogenous quality.
       In addition to challenging newspapers’ ability to bundle content, television (and the In-
ternet today) was also a direct and significant shock to advertising revenues. Accordingly,
the model we build incorporates advertising and is thus related to the theoretical literature
on two-sided markets (e.g., Caillaud and Jullien, 2001, 2003; Rochet and Tirole, 2003, 2006;
Armstrong, 2006; Weyl, 2010),6 as well as its empirical strand (e.g., Rysman, 2004; Jin and
Rysman, 2015; Kaiser and Wright, 2006; Kaiser and Song, 2009; Song, 2015). Related to our
study are Seamans and Zhu (2014), Angelucci and Cagé (2019), and Djourelova et al. (2021).
Both Seamans and Zhu (2014) and Djourelova et al. (2021) analyze the impact of the entry of
online classified-ads platform Craigslist on local U.S. newspapers, with the latter document-
ing a downsizing of editorial staffs and a decline in political news with consequences for local
politics. Angelucci and Cagé (2019) exploited the end of the prohibition against television ad-
vertising in France to show that national newspapers responded to lower advertising revenues
by decreasing their newsrooms and lowering their subscription and advertising prices.7 By
contrast, this paper looks at the consequences of the introduction of television, which consti-
tuted a direct shock not only to the advertising side of the daily newspaper market but also
to the reader side. We exploit the fact that television at the time had mostly a national news
focus to investigate how newspapers modified their provision of local versus national news,
and to tie resulting changes in news diets to split-ticket voting in presidential and congres-
sional elections. Unlike Angelucci and Cagé (2019), who, because of their focus on national
newspapers, do not look at local news, we measure local content by analyzing newspaper
   5
     For recent empirical work on bundling in media markets see Chu et al. (2011), Crawford and Yurukoglu
(2012), and Ho et al. (2012). For more recent theoretical work see also Hurkens et al. (2019).
   6
     A strand of this literature has modeled media markets specifically (e.g., Gabszewicz et al., 2001, 2004;
Gal-Or and Dukes, 2003; Strömberg, 2004a; Anderson and Coate, 2005; Armstrong and Wright, 2007; Peitz
and Valletti, 2008; Crampes et al., 2009; Esther Gal-Or et al., 2012).
   7
     Relatedly, Shiller et al. (2017) show that the use of ad blocking leads to a decrease in the quality of websites.

                                                          5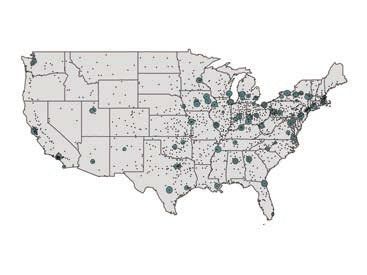
articles. Our paper is also related to Bhuller et al. (2020) who analyze the consequences of
broadband internet on the Norwegian print newspaper market. They show that the internet
caused a drop in the circulation of national tabloid and non-tabloid newspapers, and that
these reacted by reducing their staff and content offering. Local newspapers’ circulation, by
contrast, was unaffected, arguably because of their repositioning towards greater journalistic
content. In our setting, virtually all newspapers were local and the most salient observable
dimension of heterogeneity was the distinction between morning versus evening publications.
We show that the introduction of television (with mostly afternoon and evening content) was
a negative shock to evening newspapers but that morning newspapers were largely unaffected.
    Finally, our analysis is related to the literatures that study the relationships between
market structure and content variety (e.g., Berry and Waldfogel, 2001; Seim, 2006; Sweeting,
2010, 2013; Jeziorski, 2014; Berry et al., 2016), as well as the relationship between market
structure and content quality (e.g., Gentzkow et al., 2006; Berry and Waldfogel, 2010; Petrova,
2011).8 In the daily newspaper market, George (2007) finds that greater market concentration
leads to more content variety. The closest papers to ours are George and Waldfogel (2006)
and Fan (2013).9 Among other newspaper characteristics, Fan (2013) looks at the provision
of total content (the “news hole”) and the local news ratio in the context of a simulated
merger of local newspapers. She finds that ownership consolidation leads to a lower newshole
and a lower local news ratio. We differ in that we examine how the entry of television,
with its mostly national focus, affected local newspapers and their choices of sub-types of
content. George and Waldfogel (2006) analyze how the expansion of The New York Times
into local markets affected local newspapers’ readerships and newsroom compositions. Unlike
George and Waldfogel (2006) and Fan (2013), who mostly rely on newspaper reporters’ topic
assignments and job titles to proxy content, we measure content variety by directly analyzing
the stories newspapers choose to print. Further, our findings on local news contrast with theirs;
by all accounts, the entry of television was a stronger shock for local newspapers than the
expansion of The New York Times. In particular, it decreased local newspapers’ readerships
and, ultimately, ability to provide local news. We also differ in that we explicitly investigate
whether the observed changes in consumers’ news diets affect local voting behavior.

    The rest of the paper is organized as follows. In Section 2, we discuss the historical context
of the introduction of the television in the United States, introduce the new dataset we build
for this study, and provide descriptive statistics. Section 3 develops a model of the newspaper
industry. In Section 4, we estimate the impact of the entry of television on both sides of
   8
     Further, de Corniere and Sarvary (2018) build a model to look at the impact of social media on newspapers’
choice of quality. See also Jeon and Nasr (2016) on news aggregators and newspaper quality.
   9
     Also related to our paper are Gentzkow et al. (2014), who estimate a model of newspaper entry and
editorial choices in which newspapers compete to attract readers and advertisers, and George and Waldfogel
(2003), who analyze the effects of preference externalities on news diets.

                                                      6
the newspaper market, and in Section 5, we perform a content analysis and investigate how
newspapers adjusted their editorial choices after the entry of television. Section 6 investigates
the relationship between the change in the news diets and the nationalization of local politics.
In Section 7, we perform a number of robustness checks. Finally, Section 8 concludes and
discusses an epilogue case study of the current status of 10 of the papers in our analysis.

2     Background and Data

2.1    Newspapers

Our focus is on the 1944-1964 time period. During this period, newspapers were partisan
(Gentzkow et al., 2015) and relied heavily on advertising (Hamilton, 2004; Schudson, 1981;
Starr, 1982).10 Newspapers were common even in very small towns (Gentzkow et al., 2011;
McChesney and Nichols, 2010) and the majority of daily newspapers in this era produced
evening editions only (see online Appendix Figures B.2 and B.3). Most small towns – repre-
senting the vast majority of daily newspapers – had a single evening newspaper as their source
of news. Larger towns had competing evening newspapers, or even morning newspapers.
    Newspapers were widely circulated and constituted the primary source of news to most
individuals before the introduction of television. While the vast majority of American house-
holds had radios at the time of the entry of television, radio broadcasting content was mainly
devoted to general entertainment and newspapers covered a much wider range of news topics
than radio news programs (Lazarsfeld, 1940).11,12

2.2    The Introduction of Television and the FCC “Freeze”

Television was first licensed for commercial broadcasting on July 1, 1941 and then quickly
expanded in the 1950s.13 Online Appendix Figure B.4 plots the evolution of the number of
   10
      In 1956, advertising revenues represented 70% of newspapers’ total revenues. U.S. newspapers are still
primarily ad-supported today, albeit to a lower extent (Cagé, 2016). Online Appendix Figure B.1 plots the
long-run evolution of the advertising share in newspaper total revenues.
   11
      Lazarsfeld (1940) reports the broadcasting time of all the 700-odd stations in the United States in a typical
week during April 1938: 52.5% of this time was devoted to music while only 9.8% was devoted to “news and
sports.” News broadcasts were large in the size of their listening audience, however.
   12
      The 1952 American National Election Study provides information on media use: 79% of participants
reported reading about the 1952 campaign in newspapers (21% did not), and 70% of them reported hear-
ing about the campaign on radio. In the 1956 American National Election Study, the share of people
who reported reading about the campaign in newspapers was 68% and the share who reported listening
about the campaign on the radio was 45%. The 1952 American National Election Study is available at
https://electionstudies.org/data-center/1952-time-series-study/. The 1956 American National Election Study
is available at https://electionstudies.org/data-center/1956-time-series-study/.
   13
      Television was first successfully demonstrated in 1927; however, television penetration stayed very low
until the end of the 1940’s. Hence the development of television in the U.S. can be closely associated to that
of commercial broadcasting. The first TV commercial aired was a very short spot for a watch and jewelry
company, Bulova. Political advertising appeared a decade later on television, in 1952, with “Eisenhower
Answers America”, the first political spot ad campaign broadcast on television (Wood, 1990).

                                                        7
stations broadcasting from 1946 to 1961, as well as the associated total broadcasting revenues.
During these initial years, television stations broadcast mostly national programming – due
to the then excessively high cost of producing original local content – and relied heavily on
network content (Hess, 1991).14 The news television stations provided had a strong national
focus. Moreover, most local and network programming was live as videotape recording had not
yet been invented (Head and Sterling, 1994).15 Some local stations developed their own news
shows at the time but it was the exception rather than the rule. As highlighted by de Leon
(2015), “most local stations offered little more than brief summaries of wire-service headlines,
and the expense of film technology led most to emphasize live entertainment programs instead
of news.”
While the FCC licensed a few commercial broadcasters in 1941, the start of World War
II led to a halt of commercial broadcasting. In 1945, the FCC decided to resume television
licensing and by July 1946, it had issued twenty-four new licenses (Barnouw, 1990). The post-
war roll-out of television was interrupted in the late 1940s by the so-called FCC “Freeze” that
took place between September 30, 1948 and April 14, 1952 due to engineering problems. More
precisely, on September 30, 1948, the FCC announced a freeze on the granting of new television
licenses. Stations previously authorized were allowed to begin or continue operations – over
100 licenses had already been granted at the time – however, no new licenses were granted,
even though over 700 applications had been received. The FCC implemented this drastic
measure because it was unable to resolve several important interference, allocation, and other
technical issues, which it anticipated would only grow more significant if it continued to grant
licenses at the current speed. Moreover, while the freeze was originally planned to last only
six months, it ended up lasting nearly four years.16 We provide additional technical history
in the Online Appendix Section A.
From 1948 to 1952, 108 television stations were on the air and the number of television
sets grew from a quarter million to 17 million (Head and Sterling, 1994). Only 24 cities had
two or more stations, and many had only one. Most smaller and even some major cities –
like Denver, Colorado and Austin, Texas – had none at all. Our empirical strategy exploits
this interruption to TV expansion. We exploit the timing of the freeze, which occurred as
many mid-size markets were receiving licenses. As highlighted above, this freeze has already
been used by Gentzkow (2006) who documents the exogeneity of this shock. In particular,
following Gentzkow (2006), we take advantage of three different historical facts. First, the
14
The Prime Time Access Rule which required local television stations to broadcast a certain amount of
non-network programs – in particular local news and documentaries – was instituted by the FCC in 1970 to
limit the importance of network programming (see e.g. Prior, 2007).
15
On local live entertainment programs, see Koenig (2018).
16
Much of this information comes from several sources that are detailed in the online Appendix,
including an excellent overview at the Museum of TV, “Freeze of 1948” webpage, available at
http://www.museum.tv/eotv/freezeof1.htm.
8freeze provides us with exogenous geographical variations in the introduction of television.
Second, television adoption, once introduced, was extremely quick. This is of particular
importance because it allows us to study its impact directly around the shock. Finally, the
fact that a given television station broadcasts over a large area is helpful as the entry of a
single television broadcaster typically affected multiple, separate newspaper markets. The
reason for this is that at the time, newspaper distribution costs were strongly increasing in
distance, while wireless waves propagate at no cost.
As we will show, the entry of television was a strong negative shock to both sides of the
newspaper industry. Television quickly became an important source of national news. By the
early 1960s, surveys indicated that the public thought of television as the most trustworthy
and also their main source of news (Head and Sterling, 1994). On the advertising side, the top
television advertisers were also among the top newspaper advertisers. The 1955 Television
Factbook provides information on the 100 top network television advertisers (for the first six
months of 1954). The main company to advertise, Procter & Gamble Co., spent more than 11
million dollars on network television, but also over 1 million dollars on newspaper advertising.
For newspapers, Procter & Gamble was one of the main advertisers, together with General
Motors Corp., Colgate-Palmolive Co., General Foods Corp. and Lever Bros. Co., all of which
were among the top 10 television advertisers. As a consequence, while the total volume of
advertising was expanding quickly in the United States in the 1950s, we observe an increase
in the share of this volume captured by television (nearly 15% in 1961) and a drop in the
share of newspapers (online Appendix Figure B.5).17
We will also document that the introduction of television led local newspapers to produce
less local news. We exploit the resulting increased national focus in the information consumed
by individuals to test whether it made local (congressional) elections’ outcomes more corre-
lated with presidential elections’ outcomes. As we discuss in Section 6, split-ticket voting was
relatively common and, if anything, growing during our time of interest. Even though they
were affiliated with the Democratic or Republican parties, local politicians enjoyed their own
“brand” and the extent to which national matters influenced local politics was low by today’s
standards (e.g., Jacobson, 2016; Hopkins, 2018). Nevertheless, if television shifted voters’
attention to national matters, we expect their voting choices in local elections to become
increasingly determined by candidates’ party affiliations.
2.3 Data Sources and Descriptive Statistics
We use information from a number of different data sources to build our new dataset on the
newspaper and television markets. Our dataset covers 1, 963 newspapers, 1, 537 news markets
17
Note however that overall, in absolute terms, the advertising volume in newspapers continued to grow
during this period.
9and 32, 296 newspaper-years for the period 1944-1964, as well as all television stations in the
United States and their precise coverage. For our content analysis, we use scanned archives
from newspapers.com and newspaperarchive.com for 102 local newspapers from the time pe-
riod 1946-1955. Finally, we use county-level data on House, Senatorial, and Presidential
Elections for the period 1932-1964.
Newspaper data We collect information from two different sources. All data were hand-
coded by undergraduate students at the University of Pennsylvania, Columbia University,
and Sciences Po Paris. First, we collect annual newspaper-level information on circulation,
subscription prices, advertising prices, and wire news service subscriptions from the Editor &
Publisher International Yearbook.18 Figure 1 shows an example page from such a yearbook;
for the Decatur Daily, we see a weekday circulation of 12, 325, and an advertising price of
0.09 per line.19
The weekday price was $0.05, and $0.10 on Sunday ($0.05 would be approximately $0.42 in
2016 dollars), and the newspaper subscribed to the Associated Press (AP). Note also that each
newspaper is associated with its main city of circulation as listed in the Editor & Publisher
International Yearbooks. We code a newspaper’s associated city as its market.20
Second, we digitize and merge information on annual newspaper-level advertising quantity
(lineage) from the Editor & Publisher Annual Lineage Supplement. The information is avail-
able for a majority, but not for all, daily newspapers, and is broken out by national versus
local advertisers for a very large part of our sample. We will henceforth refer to “national
advertising” as advertising purchased by national advertisers, while “local advertising” refers
to local advertisers. This is of particular importance because we plausibly expect the entry of
television to have offered an alternative to national advertisers more than to local advertisers
in print media, as television programming was national at the time and television advertising
took the form of sponsored programming. To the extent of our knowledge, this paper is the
first to exploit the detailed historical information on the quantity of advertising published in
different categories in U.S. newspapers. Figure 2 shows an example of a page of the Lineage
Supplement; the Decatur Daily sold 5,014,828 lines of advertising in 1955, with the major-
ity going to local advertisers (3,660,628), and the balance to national advertisers (537,012),
classifieds (758,156), and legal (59,332).
18
We use the 1945 to 1965 yearbooks, which cover the years 1944 to 1964.
19
An “agate line” is a standard unit of measurement for print advertising. It is defined as one column of
a paper wide, by one agate, or 1/14 of an inch. So, to place an ad in the Decatur Daily that spanned three
columns and was 5 inches tall would cost an advertiser (3 ∗ 5 ∗ 14 ∗ 0.09)= 18.90 in 1955.
20
In the relatively few cases in which multiple cities are grouped together, we code the largest listed city as
the newspaper’s market. In rare cases, newspapers circulated in multiple cities and, sometimes, in multiple
counties. Unfortunately, no systematic data exist documenting newspapers’ exact geographic markets.
10Notes: The figure reproduces a page of the Editor & Publisher International Yearbook .
Figure 1: Newspaper Raw Data: Illustration
Notes: The figure reproduces a page of Editor & Publisher’s Annual Lineage Supplement.
Figure 2: Advertising Raw Data: Illustration
11Content data We identified all evening newspapers for which full-issue content had been
scanned by newspapers.com and newspaperarchive.com between 1946 and 1955. We restricted
our search to the subset of newspapers exposed to the freeze (i.e., newspapers in newspaper
markets treated by television licenses that began operation after 1947 and before 1953 – see
Section 4).21 There are 102 such newspapers (online Appendix Table C.1 presents summary
statistics for these newspapers). We manually code the content of these newspapers for the
third Tuesday and Saturday of March and the third Thursday and Saturday of September for
each year. We restricted our attention to Tuesday/Saturday pairs and Thursday/Saturday
pairs that belonged to the same two weeks to ensure that the dates of our manual content
analysis were a subset of the dates used for our Matlab analysis (see below).
More precisely, for each issue, we first extract the number of pages. Then, we determine the
number of wire articles versus original stories through manual counting of bylines. Similarly,
we count the number of local, national, entertainment, weather, and editorial stories, as well
as the number of photos.22,23 Finally, to validate our manual approach, we determine the
space devoted to news content using Matlab’s image processing machine learning capabilities.
Matlab has built-in image processing functions to detect text regions that correspond to the
text of news articles; moreover, it uses the size of the text to filter out headlines, photos,
or advertising copy. We further specify text of a particular size to identify article content.
Figure 3 shows the content highlighted for all 16 pages of the entire March 10, 1947 issue
of the Altoona Mirror. We compute a total content score for that day’s issue from those
pages. We performed this exercise for all issues published in the third week of March and the
third week of September for those newspapers present on newspapers.com.24 Note that, not
surprisingly, the Matlab score is positively correlated with the number of stories published in
the paper that we collected manually: for the issues for which we have information on the
two variables, we find a correlation of 0.47 statistically significant at the one percent level.
Summary Statistics Table 1 provides descriptive statistics on the newspaper markets for
morning and evening newspapers. On average during our time period, around 80% of the
newspapers are evening newspapers, and 8% morning ones. The remaining newspapers circu-
21
Our focus on evening newspapers is due to the much lower number of morning publications relative to
evening newspapers.
22
To approximate local newspapers’ content following The New York Times’ geographic expansion, George
and Waldfogel (2006) use information on journalists’ assignment to topical beats. We are unable to implement
a similar strategy for our period of interest because journalist directories such as the Burelle’s Media Directory
were not available at the time. However, we measure the relative amount of local news produced by directly
categorizing stories for a sample of newspapers.
23
Throughout, we refer to both national and international stories as ‘national’ stories. Also, a picture is
counted both as a picture and a story if it has a caption. Online Appendix Figure B.6 illustrates our strategy
for The Courier-Express, a local daily newspaper published in Dubois (Pennsylvania), on September 14 1953.
24
For the newspaper issues we obtained from newspaperarchive.com, we limited ourselves to the third Tuesday
of March and the third Thursday of September for each year (i.e., the same dates as those for our manual
analysis).
12Figure 3: Content Analysis Example: Altoona Mirror ’s entire issue
Notes: The Figure shows an example of using Matlab image processing features to determine a content score.
Each page is examined to determine what percent of pixels are used to display news text content and these
are summed across the issue to determine a total score. The example here is an entire issue of Altoona Mirror,
March 10, 1947. There are 16 pages and the content score of 159.78 implies an average of about 10% of pixels
per page were used to display article content.
13Mean St.Dev P25 Median P75 Obs
Morning Newspapers
Subscription price 0.44 0.13 0.36 0.42 0.47 6,245
Daily Circulation 97,887 179,971 15,218 40,690 96,611 6,245
Advertising Rate 2.0 1.8 0.8 1.4 2.3 5,844
National Lineage 1.5 1.3 0.5 1.3 2.2 2,422
Local Lineage 7.9 5.8 3.7 6.5 11.0 2,451
Classified Lineage 2.1 2.0 0.7 1.6 3.0 2,432
Mean St.Dev P25 Median P75 Obs
Evening Newspapers
Subscription price 0.43 0.10 0.36 0.40 0.46 25,586
Daily Circulation 20,140 53,565 4,260 7,021 14,044 25,586
Advertising Rate 0.8 1.0 0.4 0.5 0.8 24,238
National Lineage 0.5 0.4 0.3 0.4 0.6 14,724
Local Lineage 3.8 2.8 2.1 3.1 4.7 14,739
Classified Lineage 0.8 0.9 0.3 0.5 1.0 14,646
Table 1: Summary Statistics for Market Outcomes
Notes: The table provides summary statistics. An observation is a newspaper-year. The time period is 1944-
1964. Subscription price and advertising rates are in constant (2016) dollars. Advertising lineage is in millions
of agate lines.
late editions both in the morning and in the evening. In 82% of the newspaper market-years,
there is only one newspaper circulating (a monopolist). The average circulation of a newspa-
per during our period of interest was around 20, 140 copies a day for evening newspapers, and
97, 887 for morning newspapers.25 The subscription price of evening newspapers was slightly
lower than the price of morning newspapers. We also observe a lower advertising rate but this
is likely mechanically related to having lower circulation. Our empirical analysis will highlight
differential effects on morning versus evening newspapers.
Turning to newspaper content, Table 2 shows summary statistics for the different types
of content that we measure. On average, newspapers are 16.2 pages long. They include
120.3 news stories, of which 28.3 are national wire stories and 61.1 are local original stories.
As noted earlier, we have more observations for the variables created using Matlab’s image
processing analysis because we performed our analysis on significantly more dates.
Television data We obtain the date of the initial broadcast for all commercial and non-
commercial licensed television stations from the Advanced Television Factbook (published by
25
A decent number of newspapers circulated both in the morning and in the evening, we do not treat those
as evening newspapers for the purpose of this analysis. However, doing so does not affect our main results, as
discussed in the robustness checks section.
14Mean St.Dev P25 Median P75 Obs
Total text 120.3 65.8 73.0 107.0 154.0 3,232
National wire 28.3 18.6 16.0 24.0 36.0 3,232
Local original 61.1 39.8 34.0 51.0 78.0 3,232
Local wire 10.1 12.2 3.0 7.0 13.0 3,232
Photos 12.5 11.5 5.0 10.0 17.0 3,232
Editorials 7.6 7.3 3.0 7.0 10.0 3,232
(a) Manual Coding
Mean St.Dev P25 Median P75 Obs
Nb pages 16.2 11.7 8.0 12.0 20.0 6,829
Matlab total score 114.7 118.4 26.1 82.4 153.5 6,829
Matlab mean score 7.6 6.0 2.2 6.9 10.8 6,829
(b) Machine Learning Approach
Table 2: Summary Statistics for Newspaper Content
Notes: The table provides summary statistics. An observation is a newspaper-date. The time period is
1946-1955. There are a total of 102 different newspapers analyzed. All papers are evening newspapers that
circulated in markets affected by the FCC’s “freeze” on licensing. In the upper Table 2a, data are average
counts of a variable across all issues analyzed. “Total text” includes additional content types beyond the ones
listed, such as weather forecasts and entertainment news. Wire and original stories are identified by their
bylines. In the bottom Table 2b, we report the summary statistics for Matlab’s image processing analysis.
15(a) WALA (Mobile, AL) (b) WBRC (Birmingham, AL)
Notes: The figures reproduce two pages of the 1955 edition of the Advanced Television Factbook (published
by Warner Communications).
Figure 4: Television Raw Data: Illustration
Warner Communications). We use five different Factbooks of compiled station information
(1951, 1953, 1956, 1960, and 1966).26 For each station, the Factbook provides information
on the precise location of the broadcasting tower (latitude and longitude), the tower’s height
(feet above ground), the tower’s channel, and the visual broadcast power of the tower (kW).
This data has been collected since the advent of television.27 Figure 4 shows examples of
entries in the 1955 book for WBRC (Birmingham, AL) and WALA (Mobile, AL). The dates
of first broadcasts are listed, which happen to be July 1, 1949 (WBRC) and Jan 14, 1953
(WALA). This is an informative example, as WBRC happened to be licensed prior to the
“freeze”, while WALA was licensed afterward. We account for eventual changes in the anten-
nas’ characteristics that occur during our time period. For each year, we use the information
provided by the most recent Factbook.
With this data, we can construct the “Grade B” and “Grade A” signal contours that define
the area in which a television signal could be received using the FCC’s TV signal propagation
tools. We use the Irregular Terrain Model (ITM) (Hufford et al., 1982), which is a modified
version of the Longley-Rice model (Longley and Rice, 1968) which gives the propagation of
26
Television factbooks can be downloaded at https://worldradiohistory.com/Television Factbook Page.htm.
27
The Factbook stopped reporting precise location in 1956. For stations that begin operation in 1956 or
later, we use the centroid of the city of license for that TV station.
16electromagnetic waves over the Earth’s surface. This model allows us to compute the received
signal strength for each emitter-receiver pair, depending on the topographical conditions the
signal had to go through. We assign a newspaper to be treated by a television station if the
newspaper market’s centroid falls within this Grade’s reception contour. We follow the FCC’s
guidelines in computing the Grade A and B contours based on the station’s channel, since
VHF waves in different bands (channels 2-6 vs 7-13) propagate differently. Grade B contours
are larger than and encompass Grade A contours because they specify a lower quality of signal
reception (and the quality of signal reception decreases with the distance from the antenna).28
In our main analysis, we focus on Grade B contours. Focusing on Grade A contours does not
affect our main results, as discussed in the robustness checks section. Figure 5 illustrates
our approach by focusing on the State of Illinois in 1952 and plotting the contours of several
television stations and the locations of the state’s newspaper markets.
To visualize the impact of the freeze on the roll-out of television, we first count the number
of newspaper markets treated by television over time. Figure 6 shows this for the 1938-1964
period. The impact of the “freeze” is obvious: while television spread rapidly in 1947-1949, it
greatly slowed in 1950 and stopped entirely in 1951, before a slew of new broadcasting in 1952
and 1953. We show the precise evolution around the freeze graphically in Figure 7. Each map
is a snapshot of active television stations as of September 1 of that year. The maps for 1950
and 1951 are nearly identical, and the maps for 1952 and 1953 show a rapid development of
new stations after the lifting of the freeze.
Election data Our analysis focuses on House, Senatorial, and Presidential Elections. We
collect county-level data on all three types of elections for the period 1932-1964.29 The data
– which contain the number of votes for each party and the total number of votes – come
from the “United States Historical Election Returns, 1824-1968” and is available online on
the Inter-University Consortium for Political and Social Research’s website.30 We investigate
whether the changes in news diets brought about by the introduction of television led local
elections’ outcomes to become more correlated with presidential elections’ outcomes.
We look at Senate and House elections that correspond to presidential election years. The
advantage of this approach is that we (arguably) hold constant turnout, voters’ information,
etc., across both the local and the national election. For each election, we compute the
share of votes going to the Democratic Party candidate. We then compute the difference (in
28
The thresholds for Grade B are: -70.78dBm for channels 2-6, 61.78dBm for channels 7-13 and -53.78dBm
for channels 14-69.
29
For a seminal analysis of voting behavior in presidential elections during our time period see Campbell
et al. (1960).
30
Inter-university Consortium for Political and Social Research. United States Historical Election Re-
turns, 1824-1968. Inter-university Consortium for Political and Social Research [distributor], 1999-04-26.
https://doi.org/10.3886/ICPSR00001.v3.
17Figure 5: Newspaper markets covered by television in Illinois in 1952
Notes: Every red marker represents the location of a television antenna (“emitter”) and every blue marker
represents the center of a newspaper market (“receiver’). Both Grade A contours (in yellow) and Grade B
contours (in green) are shown. They are constructed taking into account topographic conditions.
18Figure 6: Evolution of the number of newspaper markets covered by TV
Notes: There are 1,539 newspaper markets in total. The freeze occurred between September 30, 1948 and
April 14, 1952.
absolute value) between the share of votes going to the Democratic candidate in the local
election (House and Senatorial) and the share of votes going to the Democratic candidate in
the Presidential election. We expect this difference to shrink in the counties where news diets
became more ‘nationalized’ following the introduction of television.
Lastly, for the analysis on voting, we build a grid covering the continental United States.
This grid has points at every 0.1 degrees of latitudes and longitudes (approximately 10km
depending on the location). We then compute, using an Irregular Terrain Model, the signal
strength received at each point of this grid. We consider a county as treated depending on
the share of points within the county that receive a signal above the Grade B threshold and
compute results for different thresholds.
Other data Finally, to compute our control variables, we combine several datasets from the
Historical, Demographic, Economic, and Social Data: The United States, 1790-2002 (ICPSR
2896).31 First, the census data for 1930, 1940, 1950, 1960 and 1970 provide us with information
on population per county, median income per county (1950 only), median school year for
those above 25 years per county (1940 and 1950 only), the percentage of church members
per county (1950 only), the percentage of foreigners per county (all years32 ), the percentage
of black population (all years) and the percentage of urban population per county (missing
for 1960 and 1970). For periods pre-1950, we use (1 − % illiterate) × 10 as a proxy for the
31
Haines, Michael R., and Inter-university Consortium for Political and Social Research. Historical, Demo-
graphic, Economic, and Social Data: The United States, 1790-2002. Inter-university Consortium for Political
and Social Research [distributor], 2010-05-21.
32
Note that for 1930, this is only the percentage of white foreigners.
19You can also read