FINAL INNINGS - Avalon Capital ...
←
→
Page content transcription
If your browser does not render page correctly, please read the page content below
NOW’S A
                                                                             GOOD TIME
                                                                            TO GET SOME
                                                                            GOOD ADVICE

 FINAL
INNINGS
2019 went out with a bang, with all risk-on assets doing nicely. While REITS and bonds were the
winners in the third quarter, they did not do so well in the fourth quarter.

                         4TH QUARTER SIXMIX BENCHMARK

The S&P 500, EAFE and Natural Resources were strong in the last quarter as the Fed re-ignited
quantitative easing; fears of a recession receded and a deal with China appeared to be in the
making. Our portfolios made new highs during the quarter and participated nicely in the rally.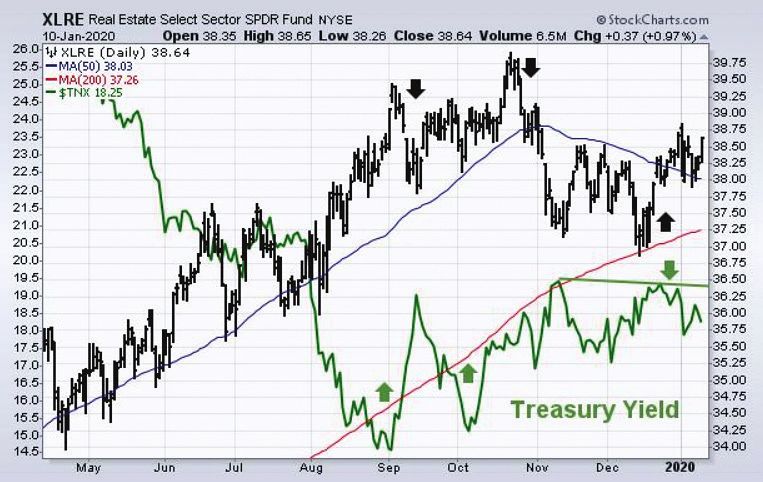
2019 SIXMIX BENCHMARK

All assets were up for 2019. The S&P 500 recovered spectacularly from its December, 2018, 20%
decline. Despite a poor fourth quarter, REITS and bonds did quite well for the year. EAFE and
natural resources finished nicely as well with a strong fourth quarter. Our portfolios made new
highs in 2019 but slightly lagged the benchmark due to the “V” recovery that happened earlier
in the year and the unrelenting advance from October’s lows. Still it was a good showing in
absolute terms.

As 2020 begins, there is some residual strength from the 4th quarter rally, but valuation and
sentiment metrics would argue for a first quarter top. We believe we are in the final innings of
the advance that began a year ago. After a consolidation/correction in the first half of this year,
the ninth inning could occur in the fall going into the election. This would fit the presidential
cycle that typically behaves this way during the presidential election year. Our regression
analysis would also argue for a first quarter top since the reward/risk ratios for assets decreased
markedly last quarter. It is particularly poor for the U.S. equity market. The Fear/Greed
Indicator is at all-time highs which is indicating excessive greed from a sentiment viewpoint.
While not an exact timing tool it does suggest that the market is vulnerable to unexpected bad
news. On the other hand, the domestic and global economies appear to be bottoming, earnings
estimates for the S&P are rising and the Fed will remain accommodative during an election
year. Thus any correction should be mild, unless geopolitical tensions upset the applecart.
The global economy will be bolstered by China. We expect China’s economic strength to
continue in coming months, with less uncertainty surrounding the U.S.-China trade deal, credit
expansion, reserve requirement ratio cuts and accelerating government-led investments. Gold
continues to trade as it should as a counterbalance to the rest of the portfolio during times of
geopolitical and market stress.

While anticipating a first quarter top, we are positive on the markets for 2020. We recommend
equities over bonds. We are overweight U.S. and international stocks, natural resources
(because of gold) and underweight REITS and bonds. In the U.S. we prefer big cap over small
cap, growth over value and technology, healthcare, financials and communication services.

                      GEOPOLITICAL TURMOIL
IRAN — Investors began 2020 with news of the killing of Iranian general Soleimani in a drone
attack ordered by President Trump. The repercussions of the airstrike will reverberate long into
the New Year and well beyond the borders of each country. Currently, the situation has settled
down. We doubt any serious US-Iran negotiations will take shape until 2021 at the earliest —
and any negotiations could fail and lead to another, more serious round of military exchanges.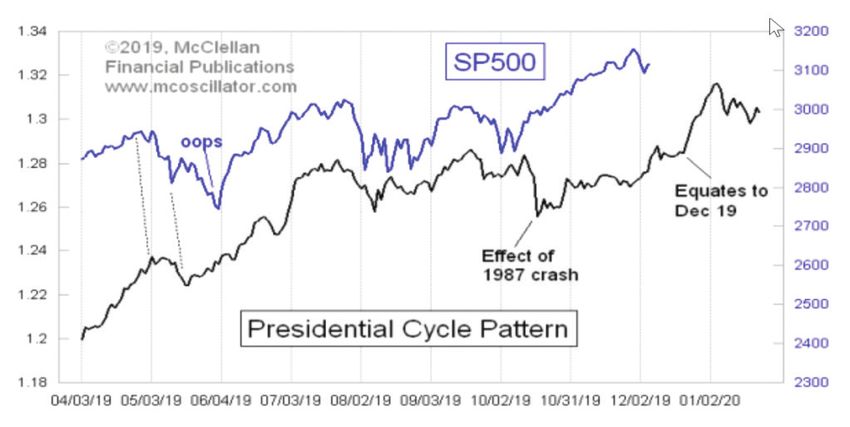
This means that today’s
reprieve may be
tomorrow’s negative
surprise for the markets
and will likely continue to
fuel volatility. Analyzing
financial markets after
20 Middle East crises
events over the last
three decades, CNBC
analysts calculated, that
while, on average, the
crises resulted in a 7%
correction in the S&P immediately after the event, one month later it was up 0.9% and three
months was up 2.8%. Gold was up 1.5% one month after the crises and flat three months later.
It is usually not a time to panic. That is why we advocate diversified portfolios: REITS, bonds
and gold act as a counterbalance to the rest of the portfolio during times of market stress.

DE-GLOBALIZATION —
An international order
built after World War II
is unraveling. We believe
that one of the major
themes for the upcoming
decade is the “apex
of globalization” or
“de-globalization”.

We may be entering a
period of hegemonic
instability that started
with the 2007-2008 financial meltdowns. Odds are high that countries will continue looking
inward as the US adopts a more aggressive and isolated trade policy, China’s trend growth
continues to slow and US-China strategic differences intensify. The notion that global economic
integration amounts to human progress has had a good run. But a new era is underway in which
national interests take primacy over collective concerns, with trading arrangements negotiated
among individual countries. Britain’s voters made it clear that the world’s fifth-largest economy
will proceed with its abandonment of the European Union.

The above chart shows that we are at the conclusion of a period of tranquility. Globalization is
ending because of secular, structural factors, not cyclical ones. These factors are multi-polarity,
populism and protectionism. The three pillars of globalization are the free movement of goods,
capital and people across national borders. We expect to see marginally less of each in the future.
This does not mean that the world economy will stop growing – only that it will grow less than
in the past and should be considered when making investment decisions.
CENTRAL BANK MACHINATIONS
Central banks are aggressively adding to their balance sheets and lowering interest rates. The Fed
is again implementing quantitative easing, although they refuse to call it that.

                         FEDERAL RESERVE BALANCE SHEET

The above chart shows the huge turnaround in the Fed’s balance sheet in the fourth quarter. The
U.S. market had been going nowhere until the Fed started pumping huge amounts of money into
the system. The U.S. market peaked in the first quarter of 2018 in line with the Fed drawdown of
its balance sheet and its raising of interest rates. The market bottomed a year ago when the Fed
reversed to lowering rates instead of raising them. After that initial thrust in the market it went
sideways until the latest salvo by the Fed. We no longer have economic cycles but credit cycles
manufactured by central bankers. The Fed said they would be doing this latest bout of buying
for only six months. We shall see. We think if the economy or market falters, they will continue
with current policy. It is hard to believe that the Fed will be anything but accommodative in an
election year.

                          INVESTMENT REVIEW
                                  Opportunities Decreasing
Given the dramatic asset changes in the last quarter, we need to take a look at assets relative
to their long-term averages. We do this by regressing prices across a range of price trends since
2000 and creating a matrix. At the end of September, defensive assets (bonds and REITS) moved
down in attractiveness while more aggressive areas (energy, small cap U.S., emerging markets and
EAFE) moved up the list. Emerging markets led fourth quarter results followed by small cap U.S.,
EAFE and energy. The S&P 500 also did well even though it was down the attractiveness list. So
the move to more aggressive investments was warranted at the end of September. So what does
the matrix look like today?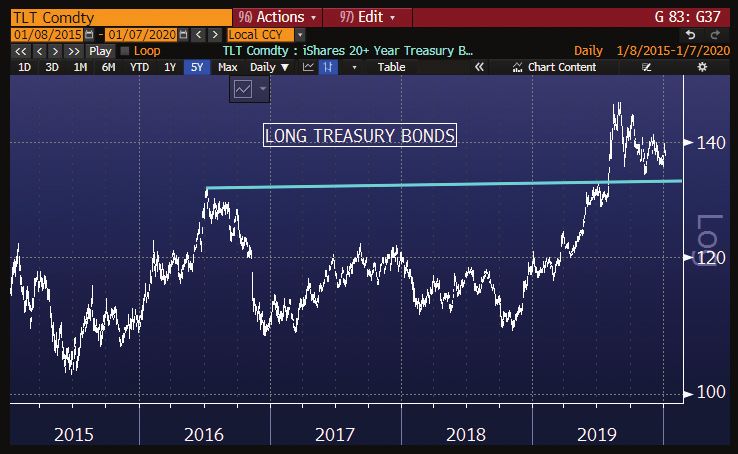
1/02/2020 MATRIX

Not surprisingly, the reward/risk ratio has decreased for all aggressive assets. The upside has
decreased dramatically while the downside risk has increased. The U.S. market has the poorest
ratios. This does not mean the market needs to take a nose dive but that it may be due for some
consolidation beginning sometime in the first quarter. The only attractive U.S. market is small cap
stocks and REITS and bonds have moved up since they were down in the fourth quarter. Energy,
emerging markets, EAFE and gold are still relatively attractive. While not compelling it may now
be appropriate to think about moving some money to defensive areas such as bonds and REITS
sometime during the first quarter.

BONDS — We are underweight bonds, having been overweight into late summer.

                                 LONG TREASURY BONDS
Bond prices broke
out to new highs
in August and have
since retreated
back to their
breakout level as
funds flowed from
safe-haven assets
back into risk-
on investments.
They were down
almost 5% for the
4th quarter, at the
bottom of returns
for that period, and down almost 10% from recent highs. If the equity market tops in the first
quarter and consolidates or declines into the summer months, treasury bonds should see an inflow
of funds and could get back to their August highs. Bonds offer a counterbalance against any volatile
stock market shocks, thereby reducing the overall risk of the portfolio. We could move back into
bonds during the first quarter if so warranted.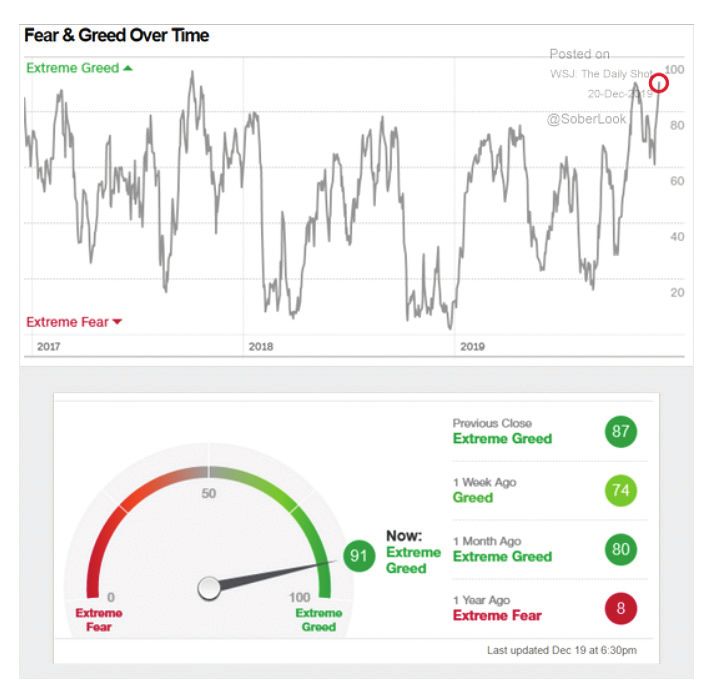
REITS — We are underweight REITs. They were the second best asset class in the third quarter
and the worst in the fourth quarter (down 1.4%) as money moved to riskier assets.

                               REITS AND TREASURY YIELDS
                                                                             REITs pulled back
                                                                             after bond yields rose
                                                                             during September
                                                                             and October. They
                                                                             started to recover in
                                                                             December as yields
                                                                             started to weaken. If
                                                                             interest rates continue
                                                                             to decline, this
                                                                             should help the REIT
                                                                             portfolio. Return on
                                                                             Assets is stable for this
                                                                             asset so current price
movements are swayed by interest rate changes and investors switching into or out of a perceived
safe-haven asset. Interest rates do not pose a fundamental threat with all central banks keeping
interest rates low. If the overall equity market starts to weaken we will add to our REIT positions.

NATURAL RESOURCES — We are overweight natural resources because of our exposure to
gold and gold stocks. We are underweight commodities and energy.

                                               GOLD

Gold jumped to its highest level in almost seven years with tensions between the U.S. and Iran
escalating. The advance extends a rally that began last year, when uncertainty about global
trade policy, fears about an economic slowdown, and lower interest rates propelled gold to
its best annual performance since 2010. While we see the strong January move as a kneejerk
reaction to Middle East issues, the longer-term gold outlook remains positive.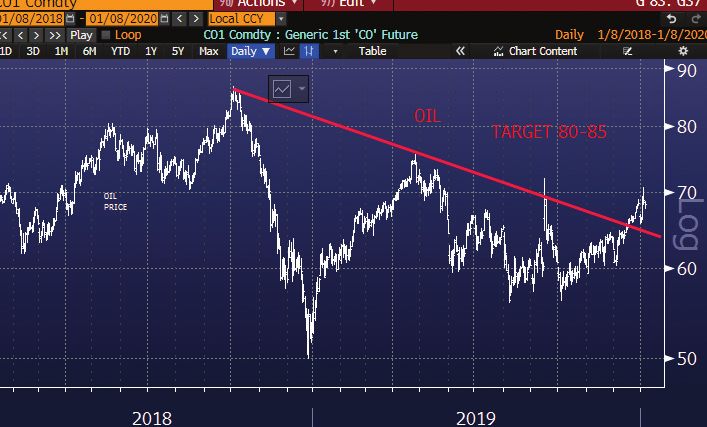
Central bankers are likely to keep printing money, and mine supply will decline because of
reduced exploration. A weaker dollar is also beneficial to the price of gold. We believe that
gold and gold stocks have started a new bull market and gold has potential near-term target of
$1740-$1890.

                                                  OIL

While the price of oil spiked to prices seen last April, oil stocks continue to underperform the
price of oil as well as equities in general. Our regression analysis shows energy stocks to have
the best reward/risk ratio of all asset classes. Nevertheless, until stock prices start acting better
relative to oil and other assets, we will continue to underweight this sector.

                                 APPLE VERSUS OIL STOCKS
On a very long-term
basis, energy stocks look
very compelling from a
contrarian viewpoint. Apple
stock, for example, is now
worth more than all of the
energy stocks in the S&P
500. Hard to believe that in
the 70’s the oil patch was
over 30% of the S&P 500
and is now less than 5%.
Oil stocks could be a big
surprise in 2020 so we need
to keep our eye on them for
a possible buying opportunity.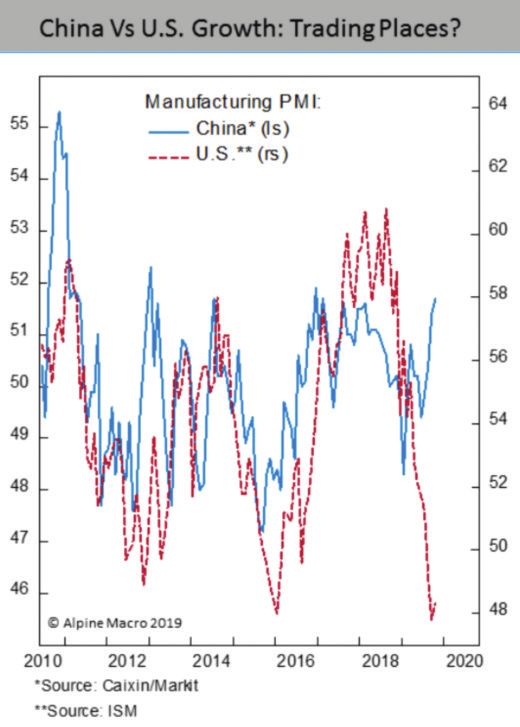
INTERNATIONAL STOCKS —
We are overweight international stocks.
We prefer emerging markets on a long term
basis as they have relatively underperformed
developed markets since 1994 despite having
superior economic and earnings growth rates.
This area is certainly currently unloved by
investors. China is the key to emerging market
performance, not only from an economic
viewpoint, but also a stock market viewpoint.
Most emerging market ETFs have a hefty
weighting in China. For example, China is
35% of the Ishares MSCI Emerging Market
ETF (EEM).
China’s economy is bottoming at a growth
rate around 6%. The above chart shows
that manufacturing turned around in the
first quarter of 2019, while it is still declining
in the U.S. Improvement was broad-based
across business surveys, external and domestic demand, and market sentiment. The prospect of
a phase-one trade deal boosted market and business sentiment and will lead to improvement
on the demand and production side. We expect the economy’s strength to continue in coming
months, with less uncertainty surrounding the U.S.-China trade deal, a low year ago base, credit
expansion, reserve requirement ratio cuts and accelerating government-led investments. Also
Chinese consumer spending will stay strong in 2020. This is important because the consumer and
services part of the economy accounts for 75% of Chia’s GDP. Household consumption rose 9.9%
in the third quarter of 2019, up from 7.3% in the first quarter.
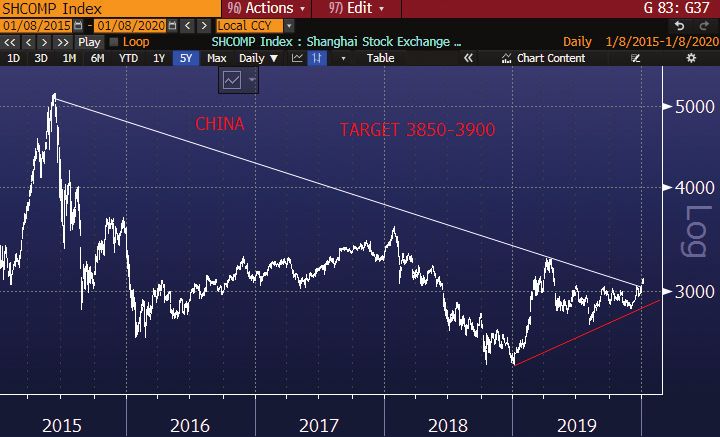
SHANGHAI COMPOSITE INDEX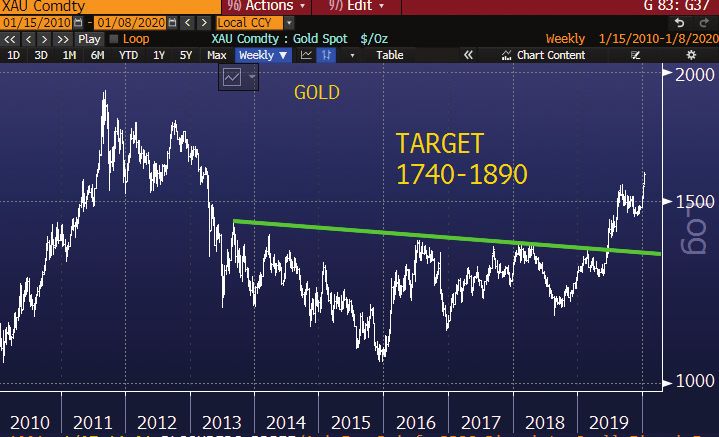
The Shanghai Composite Index may be breaking out of a huge four year base. China’s market is
due for a sharp advance. It has been declining for ten years, 6.9% from December, 2009,
even though the economy has more doubled over that time period. There is room for optimism
this year and beyond, particularly as institutional capital, both Chinese and foreign, plays a bigger
role. Only about 3% of China’s locally listed stocks are owned by foreign investors, compared
with 22% in the U.S., 30% in Japan, and 38% in the U.K. China’s growing presence in influential
global indices is likely to draw in more international investments. Also the market is cheap,
trailing price/earnings and price-to-book ratios sit well below the long-term averages over the
past 15 years. Short-term sentiment toward China and Asia is yet again in the doldrums. With
such a strong U.S. market, U.S. investors have all but abandoned China and Asian markets. And
yet experience indicates that when sentiment is at its weakest, Asian markets make their lows.
Maybe the current environment is also one where Asia’s market may be unduly depressed relative
to its own history and even to the rest of the world. We will keep an eye out for additional
buying opportunities if given the right entry levels.

U.S. STOCKS — We are overweight U.S. stocks. The stock market did quite well in the fourth
quarter with a tailwind from the Fed’s injection of liquidity, reduced fears by investors of a
recession and anticipation of a trade deal with China.

                          4th QUARTER S&P SECTOR RETURNS

Risk-on areas led the parade with technology, healthcare, financials and communication services
in the lead and the safe havens such as utilities and REITS pulling up the rear. For the year, major
averages hit new all-time highs. Since lower risk sectors did better through the third quarter, for
the year, most sectors performed well except for energy stocks. Valuations are certainly stretched
with the recent upsurge in prices and investor sentiment is at bullish extremes so what do we see
for the first quarter and the rest of the presidential cycle year?

We can potentially glean some information from the effect of the presidential cycle on the U.S.
market, even though it is just one influential factor. The Presidential Cycle pattern is an average of
the S&P’s behavior over the 4 years of each presidential term.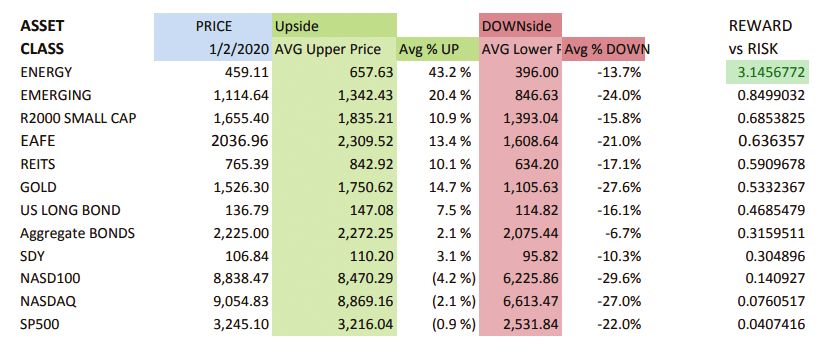
PRESIDENTIAL CYCLE PATTERN
                                                                        On average, elections years
                                                                        are up. Election years
                                                                        hold the risk that we all
                                                                        might have to get used to
                                                                        some new President taking
                                                                        office. The year prior to
                                                                        the election year tends to
                                                                        end on a strong note as it
                                                                        has this year (above chart
                                                                        does not show December’s
strength), which continues into the first quarter. Then the market goes quiet with a consolidation
or retracement of the prior quarter as uncertainty surrounds the election and then starts to move
up into the election. Our work indicates that could be the pattern for this year; an intermediate
correction into the summer with a resumption of the uptrend in the fall. Thus we are in the final
innings from the huge move in 2019 but the ninth inning could be in the third or fourth quarter.

Current investor sentiment is at all-time highs at the same time valuations have bee stretched
to new highs because the market is up 29% over the last year, while earnings have been flat.
Sentiment readings, along with our regression analysis, would indicate that the market is due for a
rest in the first quarter, which also fits with the presidential cycle.

                              FEAR AND GREED INDICATOR
Investors are driven by two emotions, fear
and greed. Too much fear can sink stocks
well below where they should be. When
investors get greedy, they can bid up stock
prices way too far. The index is comprised
of 7 indicators and looks at how far they
have varied from the average relative to
how far they normally veer. The scale is
0-100. The higher the reading, the greedier
stock buyers are becoming with 50 being
a neutral reading. This indicator is now
showing extreme greed at 91 versus a
reading of 11 last December, when it was
showing extreme fear. This would indicate
that the market is susceptible to unexpected
bad news but it is not a timing tool that says “get out now”. However, the first quarter may be a
time to shift some money to safer assets such as bonds and REITS.

Excessive greed and high valuations are certainly a reason to be concerned. Yet, what really
matter for stocks this year is profits. Corporate earnings were flat last year. (The chart below was
made before recent adjustments to the 2019 estimate.) This year, the stock market will need to be
pushed higher from rising earnings. Fortunately, there are some favorable signs suggesting that
earnings growth may soon turn up.
S&P EARNINGS ESTIMATE FOR 2020
Analysts’ earnings estimates have turned
higher in the New Year. The EPS estimate for
2020 is 6.6% above the final estimated gain
in earnings for 2019. This is not necessarily
robust but is higher than it was last year,
implying most analysts expect that the
earnings slowdown experienced in 2019 is
over. If profits continue to languish, the stock
market will struggle. On the other hand,
profits do not need to be flourishing this year
for the stock market to do well. Nevertheless,
earnings need to show life soon or “end of
cycle anxieties” will resurface.
SUMMARY
2019 went out with a bang, with all risk-on assets having a field day. Our portfolios made new highs
during the quarter and participated nicely in the rally. All assets were up in 2019 and our portfolios
made new 2019 highs, but slightly lagged the benchmark due to the “V” recovery that happened
earlier in the year and the unrelenting advance from October’s lows. Still it was a good showing
in absolute terms. As 2020 begins, there is some residual strength from the 4th quarter rally, but
valuations and sentiment metrics would suggest a first quarter top. We believe we are in the final
innings of the advance that began a year ago. After a consolidation/correction in the first half of the
year, the ninth inning could occur in the fall going into the election. The Fear/Greed indicator is
at all-time highs which indicates excessive greed from a sentiment viewpoint and potential market
vulnerability. On the other hand, the domestic and global economies appear to be bottoming,
earnings estimates for the S&P are rising and Fed will remain accommodative during an election year.
While anticipating a first quarter top, we are positive on the markets for 2020. We recommend equities
over bonds. We are overweight U.S. and international stocks, natural resources (because of gold) and
underweight REITS and bonds. In the U.S. we prefer big cap over small cap, growth over value and
technology, healthcare, financials and communication services.
Clara Basile David Rahn Bill Oberman
The opinions expressed are those of Avalon Capital Management as of
January 15, 2020, and are subject to change. There is no guarantee that the
forecasts made will come to pass. This material does not constitute investment
advice and is not intended as an endorsement of any specific investment.
Investment involves risk of loss, especially in volatile markets. Past
performance is no guarantee of future results. Investing in foreign markets
involves currency and political risks. Data contained here is obtained from
what are considered reliable resources; however, its accuracy, completeness
or reliability cannot be guaranteed. Indexes are unmanaged, do not incur Clara Basile, Bill Oberman, Dave Rahn
fees or expenses, and cannot be invested in directly. Investment strategies
such as diversification do not assure a profit and do not protect against Investment management and counseling
losses in a declining market. Other than the research noted by footnotes, for individuals and families
the research underlying this piece represents Avalon Capital Management’s
proprietary research activities. Most indices we mention are well known and avaloncapital.com
full descriptions can be found at wikipedia.org (650) 306-1500You can also read