Fiscal Analysis of a Potential Rouse Property Development
←
→
Page content transcription
If your browser does not render page correctly, please read the page content below
Fiscal Analysis of a Potential Rouse Property
Development
Summary
In March, 2020, ArlNow.com reported the
potential sale of an undeveloped, nine acre
site in Dominion Hills known as the Febrey-
Lothrop House or the Rouse Property, one of
the largest privately owned properties in
Arlington county. This property was identified
in the Public Spaces Master Plan as a key
potential acquisition in the plan to expand
Arlington county’s public spaces. Since then, a
columnist for the Falls-Church News Press reported private interest in the property, and Arlington community
members have advocated for the county to move more aggressively to acquire this property. Based on our
model of Arlington’s development, this paper presents Arlington Analytics’ estimates of the countywide fiscal
consequences of instead leaving the land open to private development.
• Based on nearby comparable sales, we estimate that the land will sell for more than $25 million.
• Based on current zoning, a private developer will likely build about 49 new detached single-family houses.
We assume about 16-17 houses per year will be built and occupied over three years starting in 2023.
• These new homes will generate about $7 million in new revenue through 2030, about $4.4 million of
which comes from real estate taxes.
• The development will require about $16 to $20 million in new county and school spending through 2030,
most of which will be dedicated to schools to educate an estimated 73 newly enrolled students.
• New spending is likely to exceed anticipated revenues by about $9 to $13 million through 2030. Although
this number will continue to grow beyond 2030, the rate of increase will slow as debt is retired and as
student enrollment from the properties declines.
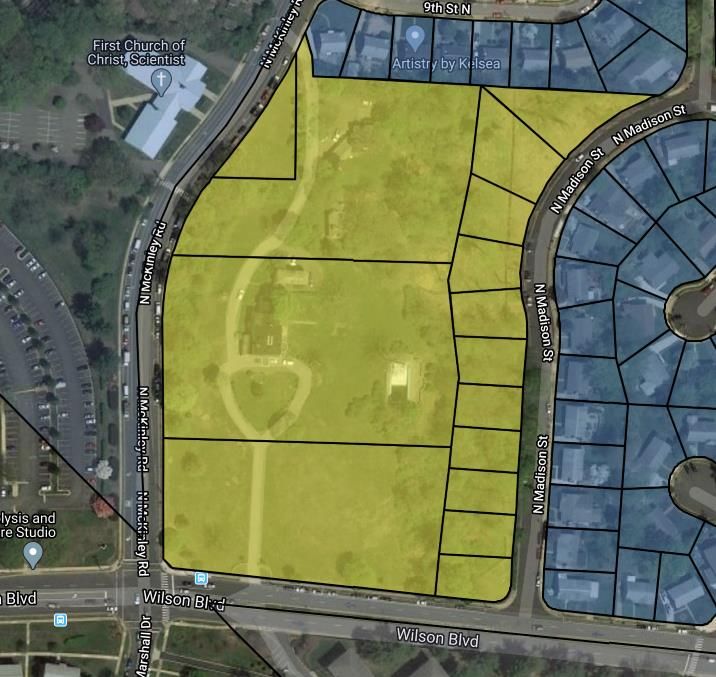
Background on 6407 Wilson Boulevard
The residence at 6407 Wilson Boulevard has a rich history which was profiled in a short article published in 2015
by Arlington magazine. Today, this property is one of the largest privately owned properties in Arlington county.
According to the Public Spaces Master Plan (page 165), the property is a generational or unique opportunity,
which is one of “large privately-held properties that have a significant amount of green space and/or an existing
recreation facility. The intent for potentially acquiring these properties is to expand the County’s public park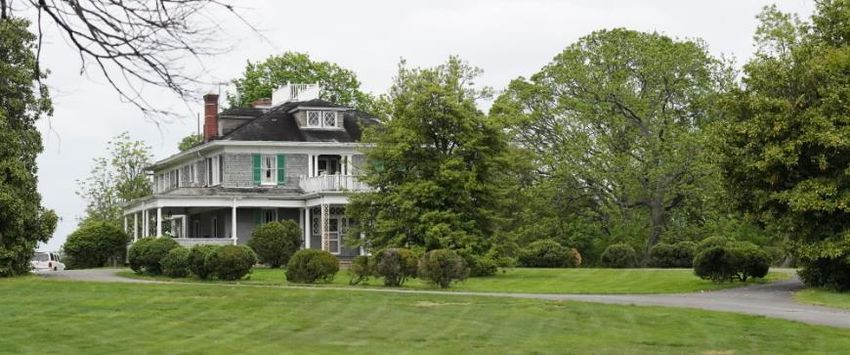
system and to protect these spaces from redevelopment.” The property is also listed in the Madison Manor
Neighborhood Conservation Plan and the Dominion Hills Neighborhood Conservation Plan.

The property consists of 15 parcels: 12-007-001, 12-007-042, 12-007-043, 12-007-044, and 12-007-031 through
12-007-041. These properties are part of the Dominion Hills Civic Association, and all of the parcels are zoned R-
6. The first four parcels (001, 042, 043, and 044) cover about 320,000 square feet of land. The last 11 parcels
(031 through 041) cover just under 94,000 square feet of land. All 15 of these parcels together add up to about
9.5 acres. These properties are currently assessed for about $15 million and generate about $151,000 per year
in real estate tax revenue.

Land Value and Purchase Price
Over the last two years, there have been very few teardowns in the neighborhood, which creates challenges for
estimating the market value of the land. The closest new construction for sale is at 940 Quesada St. In April
2019, the parcel was sold for about $750,000 for 0.26 acres (11,000 square feet). In April 2020, the five-
bedroom, four-bathroom new construction was listed at $1.4 million. Similarly, the 0.19 acre (8,460 square feet)
property at 920 Quesada St was sold in 2015 for $625,000. These prices indicate that the land in this area is
worth about $3 million per acre.

The 001, 042, 043, and 044 lots are large, and if subdivided, would need additional transportation infrastructure
to maximize development on the property. This slightly reduces the overall value of the property, as it is not all
immediately practical for development. Taking away 15 percent of those seven acres leaves us with an area of
about 8.4 acres suitable for development. Based on the above comparable sales, we estimate the value of the
land at slightly more than $25 million.

New Development
The properties are zoned R-6, which sets a minimum lot size of 6,000 square feet. In keeping with the typical lot
size of the neighborhood and assuming that that the typical lot size needs to support construction of large
detached single family houses, we assume for our analysis that the average lot size for the subdivided 001, 042,
043, and 044 parcels would be closer to 7,000 square feet. This presumed lot size would allow for the
construction of about 38 additional houses on these four parcels. We assume that one new house would be
constructed on each of the unmodified 11 parcels along N. Madison St. This leads to a total of about 49
additional detached single-family homes built on these 9.5 acres of property.

Private developers are going to look to maximize their returns. To that end, we expect that a developer will
exclusively construct houses with five or more bedrooms, which have made up about 85 percent of all houses
built in Arlington the last five years. In our analysis of the last five years of county-wide new construction, we
find that the average new construction assesses at a value greater than 90 percent of existing similarly-sized
houses. Therefore, we estimate that these new houses are likely to assess at about $1.1 million in 2023, and the
typical sale price will be a bit higher. We assume the properties will be built and occupied evenly in 2023, 2024,
and 2025.1

New Revenues
Most of the county’s revenues from residential properties comes from real estate taxes, however, new
construction also brings substantial additional revenues. We use a comprehensive model of Arlington to
estimate the effects of development on of all the county’s revenue streams including Arlington Public School’s
(APS) service charges, meal taxes, sales taxes, personal property taxes, utility taxes, state aid, and more.

Table 1: Revenues from New Development (Thousands USD)

    Fiscal Year                 2022      2023      2024      2025      2026      2027      2028      2029     2030      2022-
                                                                                                                         2030
    Real Estate                     87      265       458       566       581       595       610       624   636        4,422
    Personal Property                0       16        33        51        51        52        53        53    54          363
    APS                              0       44        90       141       145       148       151       155   158        1,032
    Meal, sales, etc.                0       49        99       155       157       160       162       165   168        1,115
    Total                           87      374       680       913       934       955       976       997 1,016        6,932

In Table 1, we highlight the main sources of revenues from new construction. Real estate tax revenue begins
accruing in fiscal year 2022 as the first houses are completed in the beginning of 2023. Real estate taxes reach
about $566 thousand for 2025, rising in subsequent years as assessments are projected to increase with the
same tax rate of $1.013 per $100 of assessed value. Real estate taxes through 2030 are expected to exceed $4.4
million for all 49 houses.

These new houses will generate other types of revenue in addition to real estate taxes. Assuming two cars per
household, we estimate that the personal property tax will generate more than $50 thousand per year once all

1We assume that the new construction is assessed at its new value in the beginning of the year, however, the unit is not fully occupied
until the middle of the calendar year. For a house built in 2023, real estate taxes will be levied in fiscal year 2022H2, however, other
forms of revenues and spending will not be realized until fiscal year 2023.
houses are built.2 Moreover, the residents for the new houses will contribute revenue from sales tax, meal
taxes, excise taxes, and other charges. We expect those taxes to generate a little more than $150 thousand per
year by 2025, and about $1.1 million through 2030.3
APS revenue is likely to increase by as much as $140 thousand in 2025, most of which comes from charges
(school lunches and extended day fees) and state funding tied to school enrollment. Through 2030, we expect
about $1 million in additional funds for the school system to come from this new construction.
Overall, not including revenues from the sale of the land itself, these new developments would generate nearly
$7 million in new revenues through 2030.
New Spending
New residents and new students increase the demands on the county’s public services and APS resources. Using
estimates of the new residents and students, we use our model to estimate the effects on county and school
spending.
Table 2: Spending from New Development (Thousands USD)
Fiscal Year 2022 2023 2024 2025 2026 2027 2028 2029 2030 2022-
2030
APS Operating 0 539 1,111 1,751 1,798 1,843 1,884 1,922 1,960 12,808
School Construction 0 164 332 513 517 519 520 520 520 3,605
County Operating 0 153 314 493 505 517 530 543 556 3,611
Total 0 856 1,757 2,757 2,820 2,880 2,934 2,985 3,037 20,026
In Table 2, we enumerate the increases in spending accompanying the new construction. The largest component
of spending comes from an increase in anticipated school enrollment. As noted in an 2016 APS consultant’s
report, new detached single-family homes generate greater student enrollment than older properties of a
similar size. Our statistical estimates are consistent with the consultant’s findings.4 We estimate that new
student enrollment may peak at 73 new students as new families move into the development, although this
number will likely decline over time as the houses get older.
These students will cost the county about $1.8 million dollars per year starting in 2025, once all of the students
are enrolled. Through 2030, the total cost is about $13 million. To the extent that these new students require
new facilities, we estimate that their share of new school construction will cost about $500 thousand per year
for the next 20 years.5
2 We use the average county-wide value of taxed vehicles to the analysis; higher-value construction may attract more expensive vehicles,
which would increase the personal property tax levy.
3 This estimate may overstate the amount of revenue from sales and meals taxes. These properties are located very close to the county’s
western boundary; some sales and meal taxes may be lost to neighboring jurisdictions.
4 Our estimates are higher than the estimates constructed in the consultant’s report based on different statistical methodology, more
recent data, more recent trends showing additional students staying with APS for middle and high school, and inclusion of probable
renovations. We will update our estimates of the student generation factors with additional data from the Fall 2020 Elementary School
Boundary Process as it is finalized.
5 Using recent prior construction and assuming that school construction is completely financed with debt repaid in equal installments of
interest and principle over 20 years, we estimate that the average cost per seat is about $7,100 per year.Additional spending is spread out over the courts, public safety, libraries, environmental and human services, additional debt service, parks, and a few other small categories. We estimate that spending to support all of the new residents will need to increase by about $500 thousand per year across all of these categories, or about $3.6 million through 2030. Overall, we expect that spending through 2030 will be between $16 and $20 million depending on whether school construction costs are included, which is substantially above the $7 million in anticipated county revenue. Spending in subsequent years will decline substantially as the debt for new school construction is retired and school enrollment declines as the houses get older. Conclusions Based on new spending and revenue associated with the development of 49 detached single-family homes, we estimate that the county will need to find an additional $9 to $13 million through 2030 to cover anticipated budget shortfalls associated with the development, depending on whether new school construction costs are included in the analysis. The total shortfall will continue to grow past 2030; though the rate of increase will slow as debt is retired, as student enrollment declines, and as the houses get older. Alternate uses of the land—for example, building a less dense development or getting approval for an alternate development—would significantly change the county’s anticipated revenues and spending. In general, a less dense development of detached single-family homes will decrease the budget shortfall. Alternate types of development—namely commercial or office buildings—in general will also likely lead a decrease in the budget shortfall. Higher density residential development may increase or decrease the shortfall, depending on the type and density of the housing. Notes and Acknowledgments Written by Jon Huntley, PhD. Contributions by Kody Carmody. Special thanks to Duke Banks for helpful comments. All errors are the author’s own. Corresponding author’s e-mail: jon.huntley@gmail.com. Last updated, May 2020. For additional tools, data, and analysis, please visit our site at https://www.arlington-analytics.com/.
You can also read