For the six months ended 31 December 2020 - Discovery
←
→
Page content transcription
If your browser does not render page correctly, please read the page content below

for the six months ended 31 December 2020

                                                1
                                            1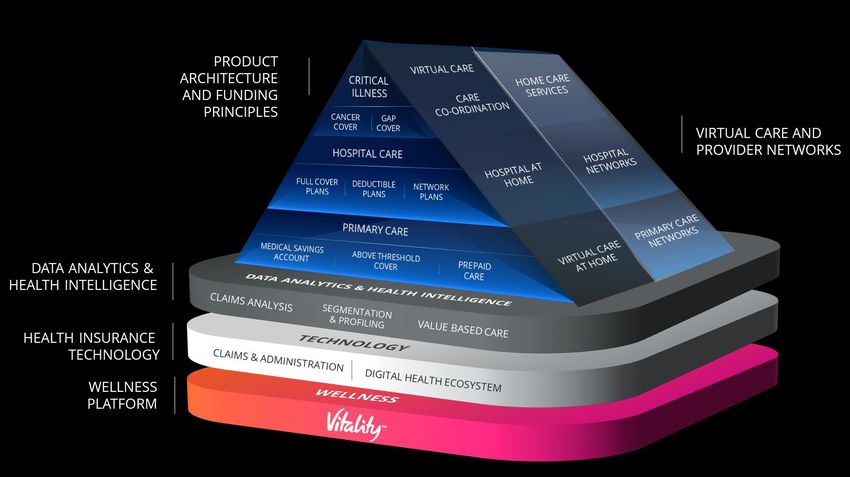
PARTNER
                                            SA COMPOSITE MODEL              UK COMPOSITE MODEL
                                                                                                       COMPOSITE MODEL

                                                                              Health

                                                                                              Invest
                                                                                       Life
Normalised operating      Core new business API                       COVID-19 provisions               Headline earnings   Normalised headline
       profit                                                                                                                   earnings

   to R4 507m                      to R9 916m                            unchanged                        to R1 842m           to R2 284m
                       +8% including DH take-on of new closed
                       schemes and gross revenue for Vitality Group

         Robust operating performance with prudent COVID-19 provision
         Operating model performing well and driving growth, with strength in capital and liquidity
         A pivot to growth following trends emerging through COVID-19
         The businesses well positioned in the four strategic strands
                                                                                                                                                  2
Discovery data to date

                                                                                                                                                                                     Deaths across
                    70,000                                                                         20,000
                                                                                                                                                                                     DH, DL and VL
                                                                                                   18,000
                    60,000
                                                                                                   16,000                                                                            Tests
                    50,000
                                                                                                                                                                                     conducted
                                                                                                   14,000

                                                                                                   12,000
                    40,000                                                                                                                                                           Confirmed
        New cases

                                                                                       New cases
                                                                                                   10,000                                                                            positive cases
                    30,000
                                                                                                    8,000
                                                                                                                                                                                     Members
                    20,000                                                                          6,000
                                                                                                                                                                                     admitted
                                                                                                    4,000
                    10,000
                                                                                                    2,000
                                                                                                                                                                                     Staff deaths
                        -                                                                              -
                             10-Nov-19

                             26-Apr-20
                              07-Jun-20

                             22-Nov-20

                                                                                                            10-Nov-19

                                                                                                            26-Apr-20
                                                                                                             07-Jun-20

                                                                                                            22-Nov-20
                             22-Dec-19
                             02-Feb-20
                             15-Mar-20

                              03-Jan-21
                             30-Aug-20

                             14-Feb-21

                                                                                                            18-Aug-19
                                                                                                            29-Sep-19

                                                                                                            22-Dec-19
                                                                                                            02-Feb-20
                                                                                                            15-Mar-20

                                                                                                             03-Jan-21
                             18-Aug-19
                             29-Sep-19

                                                                                                            30-Aug-20

                                                                                                            14-Feb-21
                              11-Oct-20

                                                                                                             11-Oct-20
                               07-Jul-19

                               19-Jul-20

                                                                                                              07-Jul-19

                                                                                                              19-Jul-20
                                                                                                                                                                                     Claims paid*

*DH: All COVID care on the DHMS scheme for COVID-19 positive members, DL: Individual and Group Risk gross claims, VL: gross claims, VH: Health COVID-19 cash benefit                                  3
Our strategic response to the pandemic
                                                              GP initiated COVID-19 COVID-19                                  SA vaccine
 DISCOVERY     Wellbeing                Vitality   Oximeter     virtual    information Business                   COVID Alert programme    Connected
    talks      at Home                 at Home      benefit    consults        hub     Support                      SA app      support      Care

                                                                                                   COVID-19
                                                                                                  concessions
                                                                                                   till Dec 20

       Keep every staff member safe                     Ensure business continuity                               Support the healthcare system
       Maintain connectivity                        Ensure products are fit-for-purpose                          Strengthen the healthcare system
       Live out our values                            Keep people healthy and active                             Play an outsized role

                                Protect                          Protect and                            Support
                               our people                     support our clients                      our country

                                            Maintain financial strength and resilience

                                      Ensure operating profit strong with appropriate and conservative reserve for COVID-19
                                      Minimise the impact on liquidity and solvency
                                      Protect the capital plan

                                                                                                                                                       4
UK’s second wave was a lot more severe on a national level than for
VitalityLife, but tapering off

                                  Second wave tapering off                                      COVID-19 variant more severe                      VitalityLife had higher mortality in
                                                                                                                                                         the first wave, in FY20
                    COVID-19 infections and deaths                                        UK distribution of strains                              VL COVID-19 related deaths

                         70,000                              1,400                                                                                     4     FY 20   H1 21      H2 21

                         60,000                              1,200

                                                                                                                                                       3
                         50,000                              1,000                                      20A
New infections per day

                         40,000                              800     New deaths per day   19A
                                                                                                              20B                                      2
                         30,000                              600

                         20,000                              400                                                                                       1

                                                                                                        20D                20E
                         10,000                              200
                                                                                                                                   20I/501Y.V1         0
                             -                               -
                                                                                          Jan 20 Mar      May       Jul   Sep    Nov   Jan 21
                                   26-Apr-20
                                  24-May-20
                                   21-Jun-20

                                  08-Nov-20
                                   05-Jan-20
                                   02-Feb-20
                                  01-Mar-20
                                  29-Mar-20

                                  16-Aug-20
                                   13-Sep-20

                                  06-Dec-20
                                   03-Jan-21
                                   31-Jan-21
                                   11-Oct-20
                                    19-Jul-20

                                                                                          National wave 2 vs wave 1:
                                                                                                       More patients in                More      Deaths:
                                      Infections   Deaths
                                                                                                       hospital                        deaths

                                                                                                                                                                                         5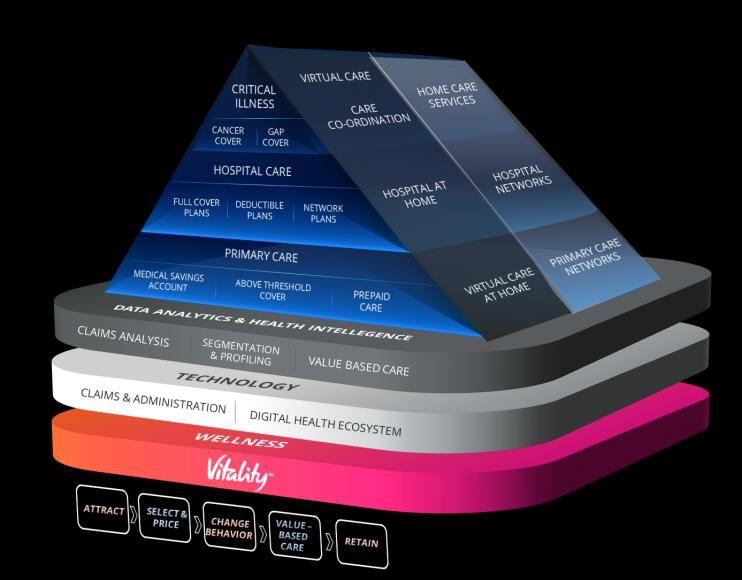
SA’s second wave also more severe but rapidly decreasing
SA’s second wave more serious than first, and started in                                                                                Comparison between waves using Discovery data
holiday season
                                                                                                                                        Higher socio-economic classes hit harder
South Africa daily new infection trends

                                  25,000                                                                600
                                                                                                                                        Deaths DL and DH
                                                                          1.5x
                                                                      peak wave 1                                                       Higher exposure
                                                                                                        500
                                  20,000
 Average new infections per day

                                                                                                                                        Discovery Life claims paid* (Rm)

                                                                                                               Average deaths per day
                                                                                                        400
                                  15,000
                                                                                                                                        Higher morbidity
                                                                                                        300

                                  10,000
                                                                                                                                        Admission rates
                                                                                                        200
                                                                                                                                        Fewer out-of-hospital claims
                                   5,000
                                                                                                        100
                                                                                                                                        Acute medication utilisation

                                      -                                                                 0
                                                                                                                                        Shorter average length of stay
                                                                                                                                        OH admissions discharged with oxygen
                                      Daily new infections   Avg daily new infections   Avg daily new deaths
                                                                                                                                        *Individual and Group Risk gross claims

                                                                                                                                                                                        6
Behaviour and a new variant contributed to a second wave
     Mobility increased early December             Spike in young infections post-matric                                                             COVID-19 variant 40-50% more
       as SA entered holiday season               celebratory events and spread to other                                                                    transmissible
                                                                members
         Google mobility trends report            Positive tests per million                                                     South Africa distribution of strains,
                                                                                                                                 superimposed infection and death rates
   40                                      Dec
                                                 1,400                                   higher risk of
                                                                                     infection compared                                         35                                                       10
   20
                                                 1,200                               to those who didn’t
                                                                                         have a flight                                          30
    0                                                                                                                                                 20A

                                                                                                           New infections per 100,000 per day
                                                 1,000

                                                                                                                                                                                                         New deaths per million per day
                                                                                                                                                25
   -20
                                                  800
                                                                                                                                                20
   -40                                                                                                                                                                                                   5
                                                  600                                                                                                       20B
                                                                                                                                                15
   -60
                                                  400
                                                                                                                                                10
                                                                                                                                                                                           20H/501Y.V2
   -80
                                                  200
                                                                                                                                                 5    20D
  -100                                               -                                                                                           0                                                       0
                                                         20201101
                                                         20201106
                                                         20201111
                                                         20201116
                                                         20201121
                                                         20201126
                                                         20201201
                                                         20201206
                                                         20201211
                                                         20201216
                                                         20201221
                                                         20201226
                                                         20201231
                                                         20210105
                                                         20210110
                                                         20210115
                                                         20210120
                                                         20210125
                                                         20210130
                                                         20210204
                                                         20210209
                                                                                                                                                     Jan 20 Mar       May      Jul   Sep    Nov    Jan 21

                                                         16-20 age band        Rest of membership
                                                                                                                                                                  Infections           Deaths
https://www.google.com/covid19/mobility/

                                                                                                                                                                                                                                          7
Understanding immunity

     Expect majority of excess deaths to be due to COVID-19                               Expect 51-57% population infected
     RSA (natural) excess deaths and reported confirmed COVID-19 deaths

                                                                                           Deaths = [ Population infected ] x [ Infection Fatality Rate ]
     20 000
                                                                                           ∴ Population infected = [ Deaths / Infection Fatality Rate ]
     15 000
                                                                                                                                        IFR
     10 000
                                                                                                                            0.28%     0.33%      0.39%
      5 000                                                                                  Excess deaths
                                                                                                                  85%        70%       59%        51%
            0                                                                                       directly
                                                                                               attributable       90%        74%       62%        54%
     -5 000                                                                                   to COVID-19
                                   1 Apr 20

                                                     1 Jul 20
              1 Jan 20

                                                                    1 Oct 20

                                                                               1 Jan 21
                                                                                                                  95%        78%       66%        57%

                                                                                                           Consistent with SANBS study on the prevalence of
                                                  Week beginning                                           COVID antibodies – c52% donors tested positive
                         Excess deaths          Reported confirmed COVID-19 deaths

                                                                                                                                                              8
https://www.samrc.ac.za/reports/report-weekly-deaths-south-africa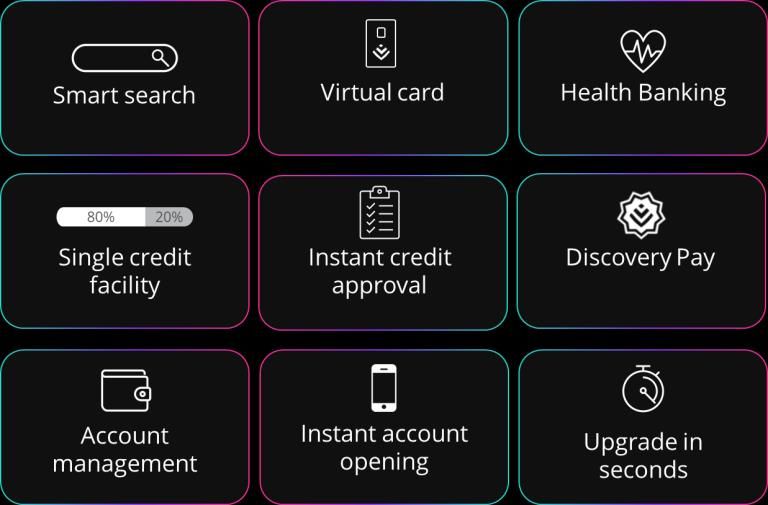
Understanding reinfection rates

Concerns about reinfection rates                                                                                                                Discovery Health data suggests very low
                                                                                                                                                reinfection risk, even with second variant
Reinfections = [ Confirmed positives in wave 1 ] x
                                       [ Reinfection rate for those who have recovered ] x
                                                                                                                                                 Confirmed positives
                                       [ Probability of testing positive in the second wave ]                                                    in wave 1, recovered more than
                                                                                                                                                 90 days prior to wave 2
            The blood samples from half the                                                                  Neutralising antibodies are
            people we tested showed that all                                                                 about a third less by 6 months      Vulnerable to reinfection
            neutralising activity was lost. This                                                             after hospitalisation               in wave 2 (assume one third)
            suggests that they may no longer
                                                                                                                                                 Risk of positive test in wave 2 in
            be protected from reinfection
                                                                                                                                                 DSY Health 2.7%
                                                National Health
                                             Laboratory Service                                                          Professor Clive Gray

                                                                                                                                                 Actual reinfections
                      In the placebo group of the trial for Novavax’s vaccine, people with prior
                      coronavirus infections appeared just as likely to get sick as people without
                      them, meaning they weren’t fully protected against the B.1.351 variant that
                      has swiftly become dominant in South Africa
                                                                                                                                                Discovery Health data suggest 28% are
                                                                                                                        Washington Post         vulnerable to reinfection

Source: The evolving science behind long COVID
https://mg.co.za/news/2021-01-19-can-you-get-reinfected-with-covid-19-sa-has-4-000-potential-reinfections/
https://www.washingtonpost.com/health/2021/02/05/virus-variant-reinfection-south-africa/
                                                                                                                                                                                             9
Factors that influence COVID-19 waves

 COVID Wave = (1-Immunity) x P(contact) x Risk index
                        Herd immunity       Behaviour           Resilience index
                        Reinfection rates   COVID-19 variants
                        Vaccines            Community
                                            prevalence

                                                                                   10
The likelihood of a third wave
Projected deaths vs
Incremental deaths under the medium scenario Total
second wave deaths
expected
Scenarios assume IFR = 0.39% and 1/3 reinfection
Feb-Jun Jul-Dec deaths
2,000
1,800
1,600
Second wave
run-off 0.2x 0x 16.6k
1,400
1,200
1,000
Super spreader at
800
600
Easter, with
reinfections
0.4x 0.6x 92.5k
400
200 Super spreader at
Easter, with
-
reinfections, but 0.3x 0.2x 44.4k
20200201
20200221
20200312
20200401
20200421
20200511
20200531
20200620
20200710
20200730
20200819
20200908
20200928
20201018
20201107
20201127
20201217
20210106
20210126
20210215
20210307
20210327
20210416
20210506
20210526
20210615
20210705
20210725
20210814
20210903
20210923
20211013
20211102
20211122
20211212
with vaccine rollout
111
Robust operating
performance with prudent
COVID-19 provisionOperating profit New business
R4.5bn R10.9bn
Rm
Continued operational excellence with significant support to
1 670 +6% 3 167 1 -5% members and society
Excellent operating performance and positive variances delivering
1 922 +3% 1 162 -6% growth on an optimised capital base
SA Composite
High-quality earnings driven by positive flows and market growth
471 -3% 1 316 -3% albeit in difficult market conditions
Strong new business and retention dynamics driving growth
107 +43% 617 +12% with consistently expanding margins and proven efficacy of the
model
SA Composite2 4 170 +5% 6 262 -4%
Excellent performance driven by continued retention and proven
Health insurance 613 +24% 638 +4% relevance of the model
UK Composite
Robust recovery with positive lapse experience and resilience to
Life insurance 327 +206% 561 -13% interest rate volatility
UK Composite2 940 +56% 1 199 -5%
Global relevance gaining significant traction with excellent
238 +116% 625 +21%
Composite
operating performance and considerable effect on our partners
Partner
Continuation of remarkable revenue, new business and profit
112 +65% 1 805 +31% growth
Prudent Bank rollout pivoting towards growth, with other segments
New businesses (999) +0% 1 005 +169% gaining further traction
Excludes SA Vitality
1 Including new closed schemes
2 Excluding New initiatives
13COVID-19 provisions back to R3.4bn in December 2020
Life insurance Health insurance
£69.8m R2 160m
£64.9m Invest
R1 953m
Invest
1 023
lapses
956
claims
30-Jun-20 Claims and lapse Net new and new 31-Dec-20 30-Jun-20 Net movement New business Additional 31-Dec-20
unwind business COVID-19 in claims and COVID-19 claims provision
provisions* lapses provision
*GBP11.7m released from COVID provision used to strengthen long-term lapse assumptions
DL claims reserve at the end of January can cover a 3rd wave
and net movements in UPR ~ equal to the 1st wave, plus the lapse provision
14Currency and interest rates volatile over the period
Rapid strengthening of the rand Sustained elevated long-term interest rates in SA
in USD average in GBP average
vs Dec 19 vs Dec 19 Spot vs Average real rates: 20-year point
26 6%
24 5%
22
4%
20
vs Jun 20 3%
18 closing GBP
2%
16
14 1%
vs Jun 20 0%
12
closing USD
Jan-15
Sep-15
Jan-16
Sep-16
Jan-17
Sep-17
Jan-18
Sep-18
Jan-19
Sep-19
Jan-20
Sep-20
Jan-21
May-15
May-16
May-17
May-18
May-19
May-20
May-21
Dec 01
Dec 17
Dec-31
Jan 16
Feb 01
Feb 17
Aug 11
Aug 27
Sep 12
Sep 28
Jun 08
Jun 24
Jul 10
Jul 26
Mar 04
Mar 20
Oct 14
Oct 30
Apr 05
Apr 21
Nov 15
May 07
May 23
GBP/ZAR USD/ZAR Spot
PIT rate
Spot Rates Average
Avg rate
Spot Rates
Average Dec 20 Average Jun 20 Average Dec 19
15Reported profit for period affected by currency and interest rates
6 months 6 months
Rm ended ended % Recon Dec 20 vs Dec 19 growth
Dec 2020 Dec 2019
Normalised profit from operations before economic
4,507 3,792 19% Currency Interest
assumptions adjustments +19% -10% Interest -1%
Economic assumptions adjustment DL* (493) - rates rates
Economic assumptions adjustment VL* 1 (230)
Normalised profit from operations after economic
assumptions adjustments
4,015 3,562 13% +1%
Finance charges excl. 1DP finance lease -649 -581
Forex and remeasurement of currency derivatives -569 33
Deferral fees related to Prudential Book transfer -96 0
Investment income and fair value remeasurements 149 196
Other -231 -235
Profit before tax 2,619 2,975 -12%
Tax (744) (897) +9%
Profit attributable to preference shareholders (34) (41) -19%
Profit attributable to equity holders 1,841 2,037 -10%
Other 1 10
Headline earnings 1,842 2,047 -10% -9%
Economic assumptions adjustment (DL and VL)* 354 186 -3%
Remeasurement of currency derivatives 149 8 Normalised Finance Forex and Economic Tax and other Headline Normalisation Normalised
Other -61 71 operating charges currency assumptions earnings adjustment headline
profit derivatives (normalised) earnings
Normalised headline earnings 2,284 2,312 -1% remeasurements
16
*Net of discretionary margins and net of gains/(losses) on derivatives to offset such changes in economic assumptions2
Operating model performing well
and driving growth, with strength in
capital and liquidityGroup operating model
Group profit growth
Growth Engine Cash Management
Cash Cash
ESTABLISHED generated used
Normalised
Tax
~5 years OperatingOperating profit
R4.5bn
Strong growth from Emerging and slowing
Rm
investment in New
1 670 +6%
500 +81%
1 922 +3%
ESTABLISHED BUSINESSES
+50%
250 +71%
471 -3%
0
Health insurance 613 +24%
-250
Life insurance 327 +206% H1 2017 H1 2018 H1 2019 H1 2020 H1 2021
Established 5 003 +10%
107 +43% 1,200 +81% -0%
EMERGING BUSINESS
238 +116% 800
+113%
112 +65% 400
+65%
Emerging 457 +81% 0
H1 2017 H1 2018 H1 2019 H1 2020 H1 2021
NEW
New (999) +0%
19
Established excludes SA Vitality, including SA Vitality Established is R5 049mNew business
R10.9bn
Emerging and New contributed to strong
Rm
total new business API
3 167 1 -5%
4,000
1 162 -6% +24%
ESTABLISHED BUSINESSES
3,000
+20%
1 316 -3% +55%
2,000
+30% 32%
Health insurance 638 +4% 1,000 5 yr CAGR
-
Life insurance 561 -13% H1 2017 H1 2018 H1 2019 H1 2020 H1 2021
Established 6 844 -5%
1,200
617 +12% +169%
EMERGING BUSINESS
625 +21% 800
+173%
1 805 +31% 400
171%
Emerging 3 047 +24% 2 yr CAGR
-
H1 2017 H1 2018 H1 2019 H1 2020 H1 2021
NEW
New 1 005 +169%
Established excludes SA Vitality, including SA Vitality Established is R6 868m
1 Including new closed schemes 20Despite small earnings contribution from Emerging and New, they
contribute significantly to revenue and membership growth
“Revenue” Total new business API
“Revenue” share Total new business
45,000 12,000 API share
40,000
10,000 13% 16%
H1 2018
35,000
30,000 8,000
87% 84%
25,000
6,000
20,000
1% 9%
H1 2021
15,000 4,000
26%
10,000 28%
2,000 63%
73%
5,000
- -
H1 H1 H1 H1 H1 H1 H1 H1 H1
2018 2019 2020 2021 2017 2018 2019 2020 2021
"Gross inflows + Bank revenue + 25% PAH GWP" 21Emerging businesses are scaling and creating value
Strong growth from Emerging
Operating profit
Rm
457
Operating profit Operating profit Operating profit
253
169
99
-114
H1 H1 H1 H1 H1 H1 H1 H1 H1 H1 H1 H1 H1 H1 H1
2017 2018 2019 2020 2021 2017 2018 2019 2020 2021 2017 2018 2019 2020 2021 H1 2017 H1 2018 H1 2019 H1 2020 H1 2021
13.5%
ROE
ROE ROE ROE
22
ROEs for the six months to December 2020, annualisedNew businesses continue to see considerable traction
% in New decreasing Bank VitalityInvest Umbrella Funds DBI Vitality1
26%
22% New business New business APE New business
15%
5% 7% R6.1bn +95% +123%
ZAR +247% +77% New market
Retail deposits to £151.2m to R592m to R124m
H1 H1 H1 H1 H1
launches over
2017 2018 2019 2020 2021
Cumulative new business Cumulative new business Cumulative new business
next 18 months
SPAIN ITALY
Majority in Bank
CZECH
22%
H1 POLAND REPUBLIC
53%
GBP millions
16%
2020 9%
ISRAEL MEXICO
16%
H1 8%
2021 15% 61%
VIETNAM BRAZIL
J A S OND J F MAM J J A S OND J J S N J M M J S N J M M J S N J S N J MM J S N J MM J S N J AOD F A J AOD F A J AOD
Bank VG VI Other 2019 2020 2021 2018 2019 2020 2018 2019 2020 2018 2019 2020
23Cash management supports the growth methodology
Cash Cash
generated Funding used
Cash generated from in-force
R0.9bn Tax and finance
Reinsurers costs
Net cash
generated from
Debt
R1.5bn
in-force business
Cash used net of funding New business
R5.8bn R3.9bn
New businesses
Net cash flow R0.9bn
Net cash flow1
R0.4bn
1 Movement in shareholder free cash 24Group is well capitalised and highly liquid
Highly liquid across Sufficient liquidity
Strongly capitalised FLR is within target the Group2 at the centre
Liquid excess assets above regulatory
capital requirements
FLR R millions SA Liquidity3 , R millions
Dec 19 Dec 20
Rm
Cover Cover
29% 28% 14,000 2,000
1,800
1.7x 1.8x 27% 12,000
1,600
25% 10,000 1,400
1.7x 1.8x
23% 8,000 1,200
1,000
1.4x 2.0x 21% 6,000
800
19% 600
1.7x 2.0x 4,000
400
17%
2,000
1 2.2x 1.3x 200
15%
- -
DHMS solvency 36.8% FY18 FY19 FY20 H121 FY18 FY19 FY20 H121
(unaudited)
1 Capital Adequacy Ratio
2 Considers SA Liquidity and liquid excess assets for Discovery Life, Discovery Insure, VitalityHealth, VitalityLife and Discovery Bank
3 SA cash + undrawn committed facilities
25Group Embedded Value
Annualised ROEV, 11.7%
excluding forex and
economic changes
Positive non-economic Operational EV Economic impact Initiatives and other
experience variances R75 992m
Life
R73 424m
R72 467m
Health and VH VL Total
Invest R70 834m
Lapses* -36 375 67 193 599
Renewal
102 13 80 25 220
expenses
Mortality and
- 62 92 12 166
morbidity
Other 261 113 89 -142 321
Total 327 563 328 88 1 306
*Lapses, surrenders and policy alts
Opening EV Value of new Unwind of Non-economic Non-economic Operational Economic Forex EV before Group Other Change in Closing EV
business RDR experience methodology EV experience below the line initiatives capital and
variances & assumption & assumption items dividends
changes changes
263
A pivot to growth following
trends emerging through
COVID-19Shared-Value dynamics manifest across all industries
LONG-TERM
LIFE HEALTH MOTOR BANK
SAVINGS
PRODUCTS
TRANSACTIO CREDIT VISA SAVINGS
N
DYNAMIC DYNAMIC DISCO
DISCOUNTS INTEREST VERY
RATES MILES
MONEY
INCENTIVE LAYER VITALITY MONEY POINTS VITALITY MONEY STATUS
DEBT SPEND ACTIVE
BEHAVIORAL LAYER MANAGER MANAGER REWARDS
DEFAULTS
DATA LAYER
Dynamic interest rates
PRICING LAYER Dynamic discounts
TECHNOLOGY AND
ANALYTICS LAYER
Claims Spend
SA UK Market A SA UK
Blue Bronze Silver Gold Blue Bronze Silver Gold
Lapses Arrears
SA UK
Blue Bronze Silver Gold
Blue Bronze Silver Gold
28The three trends have been accelerated by COVID-19
Focus on wellness Health first
and resilience Empowered customers
Mortality The rise of digital
Morbidity Ways of work Importance of Healthcare ecosystems
Driving
Investing
Ecommerce
healthcare Preventative services
Telemedicine
Banking Contactless
ESG Growth of digital Distribution models
Moral money
Climate change
platforms Servicing models
Social movements
Purpose and Green agenda
ESG
29Importance of physical activity on health and risk
Changing measurements to Causal impact of changing Impact on hospitalisation Impact on mortality
more sophisticated health physical activity levels
measures
Extending beyond activity to Bayes Network model Adjusted and standardised healthcare Mortality by disease type by physical
Cardio Respiratory Fitness (CRF) claims by days of qualifying physical activity
18% lower risk of being a high-cost activity
Mortality relativities by CRF levels claimer
1500
Decrease Increase
in PA days in PA days
1400
per year per year
1300
1200
18% 1100
1000
No Vitality Unengaged Engaged
0 50 100 150 200 250 300 350 No Vitality Blue Bronze to Diamond
Unknown Poor CRF Average Good CRF [-367,-5) [-5,5) [5,75) [75,366)
CRF CRF Ischaemic heart disease
Physical activity days per year Cerebrovascular heart disease
Hypertensive heart disease
Infectious and parasitic diseases
Injuries
Unintentional Injuries
Respiratory diseases
Diabetes mellitus
Digestive diseases
Neurological conditions
Respiratory infections
30Understanding resilience
Impact of health and lifestyle on COVID-19 related risk COVID-19 mortality by Vitality status
COVID-19 mortality risk by level of physical activity engagement Life COVID-19 mortality Only clients with at Only clients over
rate by Vitality status least one comorbidity age 60
9.0
5.8
4.8
2.6 3.0
1.7 1.5 1.7
1.0 1.3
0.7 0.6
Low Med High Low Med High Low Med High Low Med High
40-49, 40-49, 60+ 60+
no chronic hypertension no chronic hypertension -81% -74%
conditions and diabetes conditions and diabetes -71%
Engagement in Vitality can offset the elevated COVID-19 risk
1 associated with aging
2 Engagement in Vitality can offset the elevated COVID-19 risk
associated with lifestyle chronic conditions Vitality engagement reduces mortality risk regardless of age or
comorbidities
31Building and curating a wellbeing ecosystem
Collaborative model assisting customers to manage their health by combining data, incentives, personalisation
and providers
CONSUMERS
Institution
Personal pathways
CONSUMER BEHAVIOURAL CHANGE & ENGAGEMENT
GATEWAY CONNECT GATEWAY GUIDE GATEWAY EXCHANGE
MEDITATION SLEEP NUTRITION WEIGHT Access to curated
Calm Breathe Headspace Pzizz Sleep cycle MyFitnessPal Lark LoseIt Shapa Withings
programmes
GATEWAY
DEVICE STRATEGIC REWARD
Supported by device,
strategic and reward
ATTRACT UW AND
PRICE
CHANGE
BEHAVIOUR
RETAIN PARTNERS partners
TECHNOLOGY AND ANALYTICS LAYER Building capability to
Institution translate behaviour to
the different lines of
business
LINES OF BUSINESS
32Discovery Health’s platform
33Comprehensive Digital Health Ecosystem – all in production, fully
integrated into products and the administration/claims platform
ASSETS
KNOW YOUR WELLNESS AND CARE AND
HEALTH PREVENTION TREATMENT HEALTHID DOCTOR CONNECT
INTEGRATED ELECTRONIC VIRTUAL CONSULT
PERSONAL AR2020 + VIRTUAL CARE HEALTH RECORD AND PLATFORM WITH DEVICE
HEALTH RECORD GATEWAY CONSULTS WITH COORDINATION INTERACTION PLATFORM INTEGRATION
DEVICES DOCTOR
HEALTH VITALITY 65+ HOMECARE
INFORMATION SECOND OPINION SERVICES
LIBRARY NUTRITION
DIAGNOSE WELLNESS AND CARE AND
ASSESSMENT AND PERSONALISED
PREVENTION TREATMENT
AI SYMPTOM COACHING DISEASE
CHECKER MANAGEMENT
FULL PATIENT PRESCRIBE VIRTUAL
FITNESS
RECORD PERSONAL DISEASE CONSULTATIONS
SCREENING ASSESSMENT AND MEDICINE
INCLUDING MANAGEMENT
COACHING ADHERENCE
MEDICATION, PATHWAYS VALUE BASED
PATHOLOGY AND CARE PROGRAMS
RADIOLOGY VITALITY ACTIVE
REWARDS FOR
DOCTORS
WELLNESS INTEGRATED
DEVICE HEALTH AND
INTEGRATION WELLNESS APP ASSETS
PRODUCT SUITE PATIENT VALUE BASED
ONSITE VIRTUAL
ASSETS
MANAGEMENT CARE PROGRAMS
WELLNESS CONSULT PLATFORMS
SERVICES PLATFORM INTEGRATED MANAGEMENT
PATIENT CLAIMS AND COACHING PLATFORM CARE PROGRAMS
CARE CO- ADMINISTRATION
HOMECARE DISEASE PREDICTION COACHES AND
ORDINATED PLATFORM
SERVICES
SERVICES FUNDER MODELS CARE MANAGERS
34Growth of digital platforms
35Addressing social issues through the Shared-Value model
INSURED
Better health, incentives and a
“It’s an
lower cost of insurance
opportunity“
“Let’s
Addressing societal
define needs and
CORE PURPOSE a purpose“ challenges through
the business itself,
“Let’s solve Answering with a business
the
Make people problem”
“why do we
exist?” as a
company
model
healthier “It is a
Achieving ESG
standards and
problem” Global Reporting
INSURER Initiative
SOCIETY
Fewer deaths Mitigating risk measures
“It is not a
Healthier society Fewer illnesses problem” and harm
Improved productivity Improving trust
Lower claims
and reputation
Reduced healthcare burden Lower lapses Donations to
worthy social
causes
Volunteering
36Discovery’s climate strategy and impact
Discovery’s emission profile Comparison to JSE Large Cap
SHORT TO MEDIUM TERM
Achieve carbon neutrality in our
55 548 SA, UK, and US operations by 2025
(Scope 1 and 2 emissions)
Tons CO2e per year (2019)
Average (26.3m Tons)
Audited by
DSY
B
G
J
K
O
A
C
D
E
F
H
I
L
M
N
P
Q
R
S
T
JSE Large Cap Companies
37Shared-Valued model conceptually applicable for green behaviour change
controllable
behaviours
Electricity Nutrition
Driving Flying
of personal
household
emissions
384 The businesses well positioned in the four strategic strands
The businesses in the four strategic strands

                                                                                     PARTNER COMPOSITE
                   SA COMPOSITE MODEL                  UK COMPOSITE MODEL
                                                                                          MODEL

                                                         Health

                                                                            Invest
                                                                  Life
                   Perfect composite model, #1 in every industry, and laboratory for shared value in financial
                   services. A successful entry into banking
                   The best insurer in the UK, making use of a composite Shared-Value Model
                   Ping An Health delivers on its plan to become the leading health insurer in China with
                   over 50m clients
                   Vitality is the world’s largest and most sophisticated behavioural platform linked to
                   financial services, with disciplined execution
                                                                                                                 40
SA COMPOSITE MODEL
Health
Invest
Life
41Clients Accounts Retail deposits Advances
Post-BIN Post-BIN Post-BIN Post-BIN
migration migration migration migration
300k
J A S O N D J F MAM J J A S O N D J F S ON D J FMAM J J A S ON D J F J A S OND J FMAM J J A S OND J F J A S OND J FMAM J J A S OND J F
2019 2020 2021 2019 2020 2021 2019 2020 2021 2019 2020 2021
As at 24 February 2021 42New clients and accounts continue to grow steadily with efforts focused
on new-to-Bank clients following the migration
New accounts and average daily new-to-Bank Full suite and differentiated proposition results in diversified
sales income streams
Accounts Average daily sales Product mix
>556k
>350 Savings only
DTA (PAYT)
DTA (Bundled fee)
Credit card
Suite
BIN migrated
Revenue components
41%Deposits have grown strongly, in line with the strategy to build a retail
deposits-led bank
Retail deposits Deposits are sticky and diverse International comparison
Retail deposits tenure
Discovery Bank deposit growth is best in class
44%
after 14 months of operation
97% growth > 3 months
post-migration
< 3 months 56%
Deposits per customer (R ‘000)
Concentration risk 5% 19.8
Top 10 deposits as a % of total
Other as a % of total
95%
7.4
6.3
By Vitality Money status
51%
34% 1.2
9%
1% 4% 1% Discovery Tyme Bank Monzo Revolut
J A S OND J FMAM J J A S OND J F
Bank
2019 2020 2021 Blue Bronze Silver Gold Diamond None
44Advances remained flat reflecting the decrease in consumer spending
and prudent lending approach
Advances Credit quality Market share
800
of clients have their largest credit card
balances with Discovery Bank
700
Post-BIN Discovery Bank balance rank
migration 600
500
Exceptionally low 60%
risk
400 Low risk 50%
300 Medium risk 40%
% of population
High risk 30%
200
20%
Very high risk
100
10%
0 0%
J A S O N D J F M A M J J A S O N D J F Client credit score 1 2 3 4 5+
2019 2020 2021
DSY balance rank
45Increasing client engagement and Shared-Value fundamentals emerging
as expected
VM status agnostic to income levels,
Increasing engagement correlations aligned to pricing basis Shared-Value fundamentals
Percentage of consumers in arrears
by Vitality Money status
Blue Bronze Silver Gold Diamond
Increase in rewards 4.4%
Vitality Money take-up
engagement since Jul-20 Vitality Money status lower arrears
rate 0.9% 0.3% 0.0%
0.2%
Savings
31% 45% 16% 5% 4% Blue Bronze Silver Gold Diamond
only
Base Miles Fuel
Gold Deposits by Vitality Money status
HealthyLiving Iphone 43% 33% 15% 5% 3%
131,881
Active rewards Miles
Account type
Platinum higher deposit
20,200 27,352
27% 36% 22% 9% 6% levels 7,443 8,345
Blue Bronze Silver Gold Diamond
Black
20% 34% 25% 13% 9%
Spend by Vitality Money status
Three months average
Purple 58,892
10% 25% 24% 14% 27%
greater spend 12,557 19,572 21,147
8,093
Jul-20 Aug-20 Sep-20 Oct-20 Nov-20 Dec-20 Blue Bronze Silver Gold Diamond
46Value drivers are trending in the right direction and the Bank is well-
positioned for growth
Value drivers Strategic focus areas
Expanding distribution
Large and highly productive channels and leads sources
tied adviser base
Thought leadership and
brand awareness
Client growth
Pre-scoring Vitality members
for credit
Targeting of engaged
Vitality clients
Deposits Real-time upselling
Numerous features and
propositions in the pipeline
Advances
Zoom co-browsing
Enhanced onboarding
Product mix Streamlined credit
application process
Accelerated issue resolution
47Operating profit Lapses Membership New business*
Rm Rm
to R1 670m improvement lives under administration to R3 167m
Non-scheme products
5.57% Closed schemes
5.19% DHMS
1993
1995
1997
1999
2001
2003
2005
2007
2009
2011
2013
2015
2017
2019
H1 H1 H1 H1 H1 Dec-19 Dec-20 H1 H1 H1 H1 H1
2017 2018 2019 2020 2021 2017 2018 2019 2020 2021
*New business excl. new closed schemes: -17% to R2 788m
48Medical scheme growth impacted by the contraction in employment
DHMS growth Closed scheme growth Retail product growth
DHMS new business API by business type LIBERTY
: new employer groups MEDICAL
Type II: new employees on existing groups SCHEME
closed schemes
lives
lives
year-on-year
revenue growth
1997
1999
2001
2003
2005
2007
2009
2011
2013
2015
2017
2019
Jul-18
Jul-19
Jan-18
Apr-18
Jan-19
Apr-19
Jan-20
Apr-20
Jul-20
Oct-18
Oct-19
Oct-20
Type I Type II
H1 2020 H1 2021
Net gain of lives in Jan-21 Primary Care Gap cover Healthy Company
49Membership and growth Lapses and stability Security and surplus
Plan movements stability
2020 plan movements
lives credit rating unaudited solvency
Increased by Upgrade
2.2%
1.6%
Downgrade
market share1 as at Sep 2020
96.2%
No
movement
Debit order rejections
7%
6%
5%
4%
3%
Dec-20
Jun-20
Aug-20
Sep-20
Apr-20
Jul-20
Oct-20
Nov-20
May-20
2005
2019
1993
1995
1997
1999
2001
2003
2007
2009
2011
2013
2015
2017
2002 2004 2006 2008 2010 2012 2014 2016 2018 2020
1 Council of Medical Schemes
50Solvency build-up driven by the decline in non-COVID-19 healthcare
utilisation
Impact on utilisation
Surplus build-up
Weekday hospital admissions index Private Psychiatric emerging due to
(rolling 3-day average) Day clinics
hospitals hospitals COVID-19
38.7%
22.7%
Claim cost change by service month
14.6%
8.9% 6.9%
3.0% 4.2%
R27.5bn
2020 Jan…
2021 Jan…
2020 Jan…
2021 Jan…
2020 Jan…
2021 Jan…
-6.5%
Mar
May
Jul
Sep
Nov
Mar
May
Sep
Jul
Nov
Mar
May
Jul
Sep
Nov
-10.1%
-30.5%
-44.9% -48.0%
-79.6%
R19.2bn
Weekday OH claims index Radiologists GPs Paediatricians
(rolling 3-day average)
8.1% 8.2%
7.9%
1.9% 3.4% 3.7%
Claim cost change by service month
2020 Jan…
2021 Jan…
2020 Jan…
2021 Jan…
2020 Jan…
2021 Jan…
Mar
Mar
May
May
Sep
Jul
Sep
Jul
Nov
Nov
Mar
May
Jul
Sep
Nov -10.2%
-13.1%
-21.8% -19.3%
-22.6%
-30.9% -30.8%
-32.2%
-40.2%
-39.5%
-49.0%
2010 2011 2012 2013 2014 2015 2016 2017 2018 2019 2020
DHMS solvency results projected with IBNR, unaudited
51Exceptionally strong operating
New business Normalised operating profit
variances
to R1 162m to R1 922m Positive non-economic variances
H1 2020 H1 2021
563
224
Other
Total
Mortality and morbidity
Premium and fee income
Lapses and surrenders
Policy alterations
Other
Premium and fee income
Total
Mortality and morbidity
Lapses and surrenders
Policy alterations
H1 2017 H1 2018 H1 2019 H1 2020 H1 2021 H1 2017 H1 2018 H1 2019 H1 2020 H1 2021
Impact of c.R1.8bn capital release at June 20
Impact of c.R166m in Group Life claims not
covered by COVID-19 provision
Includes Discovery Invest
52Positive operational experience variances, driven by exceptionally strong
persistency
Strong lapse experience and improvement in Resilient value of new business and increase in embedded value
non COVID-19 claims experience
Margin improved vs. June 20
Lapse experience AvE Claims experience AvE VNB (Rm) Life: Annualised VNB margin (%) Embedded value: Life and
(excl identified COVID-19 claims) Life: Invest
EV variance
100%
105.9%
408
9.5% R33.8bn
90.2%
8.2%
291
99.6%
5.9%
81.0%
R31.8bn
Count EV H1 2020 H1 2021 H1 2020 H1 2021 H1 2020 FY 2020 H1 2021 Jun-20 Dec-20
H1 2020 H1 2021 Driven by:
• Tight expense controls
• Improved business mix
• Economic assumption changes
53Robust position evident in strong cashflow, capital coverage and liquidity
Strong cash emergence over the Maintained strong capital position High levels of liquidity coverage
period
Life and Invest
R millions
Assets available to
R4.1bn R4.1bn meet liquidity
182% 182%
needs
7 605 cR560m of COVID-19
claims paid within the
R2.8bn
period, largely offset by 172%
FinRe recovery
125%
SCR
2 050 target
653 231
Premiums and Fees
Net Claims
Strain
Operational costs
Cashflow before FinRe
Cashflows from existing
Net FinRe
Life&Invest Net cashflow
NBstrain
Dec-19 Jun-20 Dec-20 Dec-19 Jun-20 Dec-20 Adjusted for
claims up to
mid-February
NB and servicing
54COVID-19 claims experience peaked in January 2021, and has run down
materially as at mid-February
Significant provision utilisation during Total provisions in excess R1bn remain even Amplified relevance of shared-value
the January peak, has abated during after allowing for Jan and Feb claims life insurance through the pandemic
February
Death claims
R1 741m (actual vs expected)
594
R1 064m Clients have
83
Increase in claims R1 044m R1 070m recognised the
Highest since inception
provision utilisation R987m value of keeping
over 4 weeks their cover in place
R807m
Jun-19
Jun-20
Feb-19
Oct-19
Feb-20
Oct-20
R652m 31-Dec-20 January Claims 1st-18th Total Provision at
R532m February claims mid-February
Total Claims Paid
R418m Death claims in the 1st and 2nd waves
R393m Lapse rate
on 386 lives
Counter to higher
on 127 lives claims through this
period has been
7-Jan-21
4-Feb-21
31-Dec-20
11-Feb
18-Feb
14-Jan-21
21-Jan-21
28-Jan-21
Lowest since inception significantly lower
lapse experience
Weekly progression
Jun-19
Jun-20
Oct-19
Oct-20
Feb-19
Feb-20
14-Apr
28-Apr
18-Aug
12-May
26-May
9-Jun
7-Jul
4-Aug
31-Mar
15-Sep
29-Sep
16-Feb
1-Sep
2-Feb
23-Jun
21-Jul
22-Dec
19-Jan
13-Oct
27-Oct
10-Nov
24-Nov
8-Dec
5-Jan
Exposed Life benefits (R'm)
55Normalised operating profit New business Assets under administration
Rm Rm Rbn
to R471m to R1 316m to R107bn
H1 2017 H1 2018 H1 2019 H1 2020 H1 2021 H1 2017 H1 2018 H1 2019 H1 2020 H1 2021 2016 20 201720 201820 2019
20 2020
20
16 17 18 19 20
56Efficacy of Shared-Value model works locally and is moving abroad
Shared-Value model produces Proposition has created the fastest
Discovery Invest platform exemplary outcomes growing retail investment provider
Actuarial dynamics AUM Growth since December
2007
Asset growth (rebased to 100 as at 31 Dec 2007)
lower
drawdowns
invested in
preferred funds
lower
lapse rates
Behaviour more ad-hoc
contributions
Incentives
Vote of confidence during COVID
Data
Jun-09
Jun-12
Jun-15
Jun-18
Dec-07
Sep-08
Mar-10
Dec-10
Sep-11
Mar-13
Dec-13
Sep-14
Mar-16
Dec-16
Sep-17
Mar-19
Dec-19
Sep-20
Withdrawals Paid-ups
Actual Actual
Digital technology and quality servicing Discovery Competitor A Competitor B
v expected v expected Competitor C Competitor D Competitor E
Competitor F Competitor G Competitor H
Competitor I Competitor J Competitor K
Competitor L Competitor M
Discovery Internal data 31 December 2020. Flows data from ASISA as at 31 December 2020.
Performance data as per Morningstar 31 December 2020 57Normalised Gross written
operating profit New business premium Market share in GWP Operating margin
to R107m to R617m* to R2 121m* to 6%*
(excl. Commercial)
H1 H1 H1 H1 H1 H1 H1 H1 H1 H1 H1 H1 H1 H1 H1 H1 H1 H1 H1 H1 H1 H1 H1 H1 H1
2017 2018 2019 2020 2021 2017 2018 2019 2020 2021 2017 2018 2019 2020 2021 2017 2018 2019 2020 2021 2017 2018 2019 2020 2021
*Personal Lines only. Assumes 6% in GWP
*Personal Lines only market growth since 2018 58Increased margin a direct result of the economics of the model
Shared-Value model drives the economics Public buy-in Resultant margin
2020 Growth in GWP Margin (%)
By Vitality status By duration inforce
Despite a
16% 6
Loss ratios Lapse rates Loss ratios Lapse rates decline in home
transfers and new
vehicle sales in 2020,
DSY Insure new 4
business sales stayed
8% strong at 3
5%
4%
2%
-7%
-1
-3
Blue
Silver
Bronze
Gold
Year 1 Year 2 Year 3 Year Year 1 Year 2 Year 3 Year
Gold
Blue
Silver
Bronze
4+ 4+
H1 H1 H1 H1 H1
2017 2018 2019 2020 2021
Source: NAAMSA; Property24 59Data provides fascinating advantage in insights and application
Understanding behaviour Vitality drive status differentiates risk within traditional pricing factors
provides superior accuracy over
traditional pricing Frequency of claims by Vitality Drive Status
Age Province Gender Automobile
Competitors underpricing
and making losses
Competitors overpricing; DSY
rewarding clients for better risks
Blue Bronze Silver Gold Blue Bronze Silver Gold Blue Bronze Silver Gold Blue Bronze Silver Gold Blue Bronze Silver Gold
Volkswagen
18-30 Gauteng Female
Actual DSY Experience Toyota
31-50 Western Cape Ford
Discovery Pricing 51-65 Kwazulu-Natal Male Mercedes-Benz
Eastern Cape BMW
Non-Telematics Pricing 65+ Hyundai
Other
Audi
60Model and data enables emphasis on the customer and is replicable
Discovery Insure’s personal lines platform Platform enables capabilities and new manifestations
Vitality Drive 2.0
insured assets
kilometres tracked
claims processed
Discovery Insure Vitality Drive 65+
vehicle warranty
claims paid
cashback paid International expansion
rewards earned
61UK COMPOSITE MODEL
Health
Invest
Life
62Health and Life
insurance
Normalised operating profit Lives covered Earned premiums New business
to £44.2m to 1.3m lives to £409.4m* to £56.4m
GBP millions
GBP millions
GBP millions
H1 H1 H1 H1 H1 H1 H1 H1 H1 H1 H1 H1 H1 H1 H1 H1 H1 H1 H1 H1
2017 2018 2019 2020 2021 2017 2018 2019 2020 2021 2017 2018 2019 2020 2021 2017 2018 2019 2020 2021
Excludes Vitality at Work (formerly Healthy 63
*Excludes UPR adjustment
Workplace and Essentials)The composite is working well and receiving recognition
Vitality engagement: Simplified customer
deep and correlated Brand well established Service recognition journeys
Relative lapse experience Prompted brand awareness
COVID-19 UKCXA’20
50 50 51 53 UK Customer Experience Awards
37
Bronze Silver Gold Platinum
29 30
Overall Winner
25 Workplace
Relative mortality rates 19
14 Wellbeing Team
Bronze Bronze Silver Gold Platinum H2 H2 H1 No H1 H1 H2
unengaged engaged 2014 2015 2017 measure 2019 2020 2020
Relative IH claims experience Celebrating women in sport Leading companies evaluated:
Neoplasms
Musculoskeletal
Cardiovascular
Respiratory
Source:
Mortality: Vitality impact on mortality (using causal inference), 2016-2020
Morbidity: Vitality Continuous Mortality, Lapse and Engagement (CMLE) investigation, 2017. Standardised for Age, Gender, SE Class, Initial RUB; Rebased to Bronze status 64
Retention: 12-mth Rolling Average Actual VS Expected Lapse Rates for Optimised policies by Vitality StatusShared-Value Insurance Model is consistent across the Group
LIFE ABC RENEWAL HEALTHY FEE STATUS-LINKED
OPTIMISER PRICING SAVER EXCESS
Reduce increase Reduce excess by up
Up to 30% upfront Up to 0% asset
through health to £250 and
discount management fees
engagement eliminate increase
Healthier ageing and
Improved morbidity Improved Improved driving, both
improved financial
and mortality morbidity safer and greener
wellbeing
65Health insurance
Normalised operating profit Earned premiums Lives covered New business
to £28.8m to £256.5m* to 693k lives* to £30.0m
GBP millions
GBP millions
GBP millions
H1 H1 H1 H1 H1 H1 H1 H1 H1 H1 H1 H1 H1 H1 H1 H1 H1 H1 H1 H1
2017 2018 2019 2020 2021 2017 2018 2019 2020 2021 2017 2018 2019 2020 2021 2017 2018 2019 2020 2021
*Excludes Vitality at Work (formerly Healthy
*Excludes UPR adjustment Workplace and Essentials) 66The quality of the book is strong
Exceptional retention Strong cash generation after allowing for UPR adjustment
Lapse rates GBP millions, after allowing for COVID-19 provisions
Inforce book cash generation Net cash generated
70
£59m
60
£51m
50 £46m £47m
40
£25m
30 £22m £20m £23m
30
20 20
10 10
0 0
H1 2018 H1 2019 H1 2020 H1 2021 H1 2018 H1 2019 H1 2020 H1 2021
H1 2017 H1 2018 H1 2019 H1 2020 H1 2021
67UPR adjusted for treatments delayed due to COVID-19, and roughly
equal to 2 months of claims
Still below expectation due to second wave, but expect
Authorisations still below pre-COVID-19 levels catch-up on delayed treatments
Monthly authorisations per 1 000 lives Claims spend expected compared to authorisations received
120% 140% Wave 1 Wave 2
Pre COVID-19
100% 120%
100%
80%
80%
60%
60%
40%
40%
20%
20%
0% 0%
Mar-20
Apr-20
Oct-20
Mar-21
Apr-21
Jan-20
Jul-20
Jan-21
Aug-20
May-20
Jun-20
Dec-20
May-21
Jun-21
Feb-20
Sep-20
Nov-20
Feb-21
%age of normal claims spend expected in business plan
Cardiac Musculoskeletal Oncology Psychiatry Overall
UPR provision roughly 2 months of claims
68Life insurance
Normalised operating profit Earned premiums Lives covered New business
to £15.4m to £152.9m to 648k lives to £26.4m
GBP millions
GBP millions
GBP millions
H1 H1 H1 H1 H1 H1 H1 H1 H1 H1 H1 H1 H1 H1 H1 H1 H1 H1 H1 H1
2017 2018 2019 2020 2021 2017 2018 2019 2020 2021 2017 2018 2019 2020 2021 2017 2018 2019 2020 2021
69COVID-19 impacted the overall market with a reduction in total sales
VitalityLife new business UK IFA market new business
-22% -23%
to £26.4m
GBP millions
H1 2017 H1 2018 H1 2019 H1 2020 H1 2021 Q1 2019 Q2 2019 Q3 2019 Q4 2019 Q1 2020 Q2 2020 Q3 2020
COVID-19 impact
Source: Touchstone, Oct 2020 70Vitality Life benefitting from the restructure
Unfavourable variances remedied
Steps taken to address retention Lapse AvE at all-time low from July 2020
AvE lapses IFRS reserve variance
120% 3
Millions
Expected 2
100%
1
80%
0
60%
-1
40%
-2
20%
-3
0% -4
Jul-19
Jul-20
Apr-20
Jun-20
May-20
Nov-19
Nov-20
Aug-19
Dec-19
Mar-20
Aug-20
Dec-20
Sep-19
Jan-20
Feb-20
Sep-20
Oct-19
Oct-20
H1 H1 H1 H1 H1 H1
2016 2017 2018 2019 2020 2021
71Profits are reverting, as expected
H1 2020 normalised operating profit recon H1 2021 operating profit recon
+£9.4m -£8.9m
Reduction due £7.6m
£15m to experience £15.4m
£15m Lapses
variances
£9m
£5.8m
H1 21 expected Experience Strengthening Interest and H1 2021
variances of provisions hedge impact operating profit
-£16m -£7m
H1 20 before H1 20 actual Interest and H1 20 operating H1 20 restated
experience before interest hedge impact loss operating profit
variances and hedge
impact
72PARTNER COMPOSITE
MODEL
Health
Invest
Life
73PAH’s operating results Discovery’s operating
New business1 Written premium1 pre-tax result after tax
to R7.2bn to R18.1bn to R1bn to R112m
(DSY’s share is R253m)
H1 H1 H1 H1 H1 H1 H1 H1 H1 H1 H1 H1 H1 H1 H1 H1 H1 H1 H1 H1
2017 2018 2019 2020 2021 2017 2018 2019 2020 2021 2017 2018 2019 2020 2021 2017 2018 2019 2020 2021
1 100% of PAH
74Exceptional new business growth in the 1st half of PAH’s financial year
Six-monthly new business Although new business slowed in the latter half, it
RMB achieved its full-year revenue target
Calendar year new business RMB
5 8
Billions
Billions
+26%
7
4
6 +35%
5
3
+105%
4
2
3
2
1
1
0 -
Jan-Jun Jul-Dec Jan-Jun Jul-Dec Jan-Jun Jul-Dec Jan-Jun Jul-Dec 2017 2018 2019 2020
2017 2018 2019 2020
75PAH continues to focus on growth and broadening its sales channels
Continued expansion of offline Transformed distribution strategy to Building digital distribution
distribution footprint capture different parts of market strategy for agents
Hubei added Nov 2020
2A Deepen collaboration with
Beijing
Liaoning Agents Ping An Group subsidiaries SuiShenYi
Tianjin
platform
Sichuan
Chongqing
Henan
Hubei
Jiangsu
Shanghai
Zhejiang
2B Group business through Commission Online platform where
Business large established brokers & My Sales Status anyone can register to
Guangdong
Shenzhen
PAH’s own direct sales team be an agent to sell PAH
Pending
payment Completed Expired insurance products
2C Partner with major third-
My Sales tracker
Customer party platforms 3 days ago
SuiShenYi platform
Tier 2 branches:
Beijing, Shanghai, Guangdong, Shenzhen, Jiangsu,
Zhejiang, Liaoning, Tianjin, Sichuan, Suzhou, Hebei,
Chongqing, Henan, Hubei
2G Micro top-up medical
Government reimbursements products
76Ping An Group continues to invest in its extensive healthcare ecosystem
Digital platform strategy with integration of various offline players
Government Health Medical products Healthcare security Implemented in 158 cities PAH benefits from this
commissions administration administration across 30 provinces Group investment
through products,
networks and channels
Patients Provider Payer
PA Good Doctor Institutions Doctors Pharmacies Ping An Health The ecosystem brings
Online PA Good Doctor PA Good Doctor PA Good Doctor Ping An Life
903K daily 650K doctors together users with
consultations 21K institutions served 150K+ partner Ping An Annuity
1000+ partner 21K+ external
pharmacies online and offline
Offline hospitals across contracted HealthKonnect
373m registered users world doctors providers of products
and services
Research Institution Investment Institution The ecosystem is
Healthcare Technology Toda Voyager Ping An Overseas served by a single
Technology Research Institute Bio-research Global Fund Ventures Holdings
st
Ranked 1 globally by digital healthcare Invested in nearly 100 companies in the digital platform
applications healthcare industry
77PAH app being merged into Good Doctor app, which is to become the
digital platform serving the Ping An Group healthcare ecosystem
New app is called Ping An Good Doctor: China’s leading online
healthcare services platform
Ping An Health
Vision: bring health to all Monthly active users in millions as at Sep 2020
Chinese and promote the
construction of Healthy China, 67
promoting the transition from
disease treatment-centric to
health-centric
5
Mission: provide full range of health management Ping An We- Ali JD Jianke ChunYu Hao Dr DXY Zhi Wei
services covering prevention, treatment and Good Dr Doctor Health Health YiSheng Yuan Mai
rehabilitation
Important flagship of Ping An’s healthcare ecosystem
bringing users into an ecosystem of product and
service providers Registered users Average daily
consultations
78PARTNER COMPOSITE
MODEL
Health
Invest
Life
79Integrated new API by Insurance and franchise
insurance partners Revenue Operating result partners membership
(+0.3% ZAR) (+21% ZAR) (+116% ZAR)
USD537m USD38m USD14.6m 2.1m
R8.7bn R625m R238m
H1 H1 H1 H1 H1 H1 H1 H1 H1 H1 H1 H1 H1 H1 H1 H1 H1 H1 H1 H1
2017 2018 2019 2020 2021 2017 2018 2019 2020 2021 2017 2018 2019 2020 2021 2017 2018 2019 2020 2021
All numbers exclude new VG initiatives, i.e. myOwn and Vitality1 Vitality USA Insurance Partners
*From insurance partners
80In-market growth continued, despite challenging environment
Integrated new API by Vitality’s health and wellness message resonated with buyers and helped our partners
insurance partners build resilient businesses during COVID-19
Non-integrated Vitality integrated
(+0.3% ZAR)
USD537m
R8.7bn
(pp difference rebased to non-integrated)
Sales growth 2020 v 2019
Member growth
Relative to 2020H1
ALL MARKETS USA JAPAN GERMANY
H1 H1 H1 H1 H1
2017 2018 2019 2020 2021
All numbers exclude new VG initiatives, i.e. myOwn and Vitality1
*From insurance partners
*AIA and Sumitomo figures are for 2020 calendar year. John Hancock and Generali relative figures are over FY2021H1. 81Vitality engagement remained strong across our markets
Resilient Vitality engagement Vitality enabled partners to respond and drive
during COVID-19 engagement with clients during COVID-19
Markets experienced a moderate decline in Q1 with global Mobilised a powerful COVID-19
uncertainty and lockdowns taking effect response, with Vitality at its core
Total workouts At home workouts STRATEGY PLAYBOOK
2020 Q3 and Q4 showed the effect of various market
Avg per person
interventions implemented and easing of lock-down measures
COMMUNICATION TOOLS
175% COVID 2019 2020 2019 2020
Relative engagement
150% SUPPORT
Vitality Run&Walk Challenge
Physically active Engaged v Unengaged
125%
% of members
INCENTIVES FOR VACCINATION
100%
2020Q2 2020Q3
75% PROMOTIONS AND GUIDANCE
50% Ecuador’s largest virtual gym
SOCIAL
Goal completion
25%
Active Rewards goal
0%
achievement rate COVID-19 DATA ANALYSIS
1-Sep-19 1-Dec-19 1-Mar-20 1-Jun-20 1-Sep-20 1-Dec-20 Equivida Saludsa
Feb-20
Jul-20
Aug-20
Sep-20
Nov-20
Dec-20
Jan-20
Mar-20
Jun-20
Oct-20
Apr-20
May-20
82Vitality localised and tailored to market needs
Vitality spans multiple markets, regulators, languages, time zones, vendors, rewards partners, currencies and types of financial services
AIA AIA AIA AIA AIA AIA AIA John Hancock Manulife Generali
Singapore South Korea Hong Kong Philippines Indonesia Australia Thailand USA Canada Germany
National champions
Generali Generali VG Aetna Attain IGI Life Fidelidade ASR Prudential SaludSA Tawuniya
Austria France USA USA Pakistan Portugal Netherlands Argentina Ecuador Saudi Arabia
Employee wellness
Franchise markets
Powered by
83
Manulife is a trademark of The Manufacturers Life Insurance Company and are used by it, and by The Discovery Group under licensePARTNER
SA COMPOSITE MODEL UK COMPOSITE MODEL
COMPOSITE MODEL
Health
Invest
Life
Normalised operating Core new business API COVID-19 provisions Headline earnings Normalised headline
profit earnings
to R4 507m to R9 916m unchanged to R1 842m to R2 284m
+8% including DH take-on of new closed
schemes and gross revenue for Vitality Group
Robust operating performance with prudent COVID-19 provision
Operating model performing well and driving growth, with strength in capital and liquidity
A pivot to growth following trends emerging through COVID-19
The businesses well positioned in the four strategic strands
84for the six months ended 31 December 2020
85
85You can also read