Forecast for FY2022 (Ending March 31, 2023) and Initiatives for Enhancing Corporate Value - Ajinomoto Co., Inc. (2802)

Page created by Richard Daniels
 
CONTINUE READING
Forecast for FY2022 (Ending March 31, 2023) and Initiatives for Enhancing Corporate Value - Ajinomoto Co., Inc. (2802)
Ajinomoto Co., Inc. (2802)

Forecast for FY2022 (Ending March 31, 2023)
and Initiatives for Enhancing Corporate Value

                           Taro Fujie
       Member of the Board, Representative Executive Officer
               President & Chief Executive Officer

                        November 7, 2022
Forecast for FY2022 (Ending March 31, 2023) and Initiatives for Enhancing Corporate Value - Ajinomoto Co., Inc. (2802)
I.       Summary Results for the First Half Ended
         September 30, 2022 and FY2022 Forecast
II. The Corporate Value Enhancement Cycle and
    Engagement
III. Medium-Term ASV Initiative
     for the 2030 Roadmap

 Reference Materials
 Appendixes: Consolidated Results First Half Ended September 30, 2022
             FY2022 Revised Forecast by Segment

     Note: Business profit (consolidated) in this material:
     Sales - Cost of sales - Selling expenses, Research & development expenses and General & administrative
     expenses + Share of profit of associates and joint ventures
Forecast for FY2022 (Ending March 31, 2023) and Initiatives for Enhancing Corporate Value - Ajinomoto Co., Inc. (2802)
Today’s Message

•   In the first-half, we achieved revenue and profit(Business Profit) growth.
    Sales and business profit on a half-year basis were the highest since the
    introduction of IFRS in FY2016.
•   In Seasonings and Foods and in Frozen Foods, even though we raised
    unit prices, we were unable to offset the impacts of cost increases,
    resulting in a slight decrease in profit. Conversely, growth continued in
    Healthcare and Others, driving performance across the Group. Profit
    also increased due to depreciation of the yen.
•   In the full-year forecast for FY2022, we have upwardly revised both sales and
    profit. We decided to increase the dividend and repurchase shares as a
    measure to strengthen shareholder returns in anticipation of enhancing
    our sustainable cash generating ability.
•   We are working on further clarification of issues and speeding up the
    implementation of measures, and continually realize the enhancement of
    corporate value.
    (Issues: continual growth of foods in Japan, the profit margin of
    Seasonings and Foods, and the profit structure of Frozen Foods)
•   We will formulate the 2030 Roadmap for our Medium-Term ASV* Initiative
    to reflect our dialogue with stakeholders and our vision for 2030.
     *The Ajinomoto Group Creating Shared Value: Initiatives to create both social and economic value through its business,
          which the Group has been consistently engaging in since its foundation
                                 Copyright © 2022 Ajinomoto Co., Inc. All rights reserved                                     3
Forecast for FY2022 (Ending March 31, 2023) and Initiatives for Enhancing Corporate Value - Ajinomoto Co., Inc. (2802)
I.   Summary Results for the First Half Ended
     September 30, 2022 and FY2022 Forecast
II. The Corporate Value Enhancement Cycle and
    Engagement
III. Medium-Term ASV Initiative
     for the 2030 Roadmap
Forecast for FY2022 (Ending March 31, 2023) and Initiatives for Enhancing Corporate Value - Ajinomoto Co., Inc. (2802)
I-1. First-Half Results Digest
                                                                                                                Profit attributable to owners
            Sales: Increased                             Business profit: Increased                               of the parent company

            ¥659.8 billion                                      ¥74.3 billion                                       ¥47.0 billion
         119.9% of FY2021 results                          107.2% of FY2021 results                             86.8% of FY2021 results
  Excluding currency translation: 109.5%            Excluding currency translation: 97.1%                   Decreased year-on-year due to the
                                                                                                            recording of profit on the sale of fixed

        up ¥109.6 billion                                  up ¥5.0 billion
                                                                                                            assets (idle assets) within operating
                                                                                                            income for the same period of the
                                                 With currency translation effects excluded, profit         previous fiscal year
    Revenue increased significantly overall
                                                 decreased.
    due to higher revenue in all major                                                                           Excluding profit on the
                                                 In Seasonings and Foods and Frozen Foods, while
    segments.
                                                 revenue increased, profit fell due to soaring raw                sale of fixed assets
                                                 materials, logistics, and personnel costs.                     111.4% of FY2021 results
                                                 In Healthcare and Others, profit increased due to strong
                                                 performance in the Functional Materials business and
                                                 Bio-Pharma Services & Ingredients business.
YoY Business Profit Details – Summary

        (¥ Billion)             vs Q1-FY21 vs Q2-FY21 vs H1-FY21                                        Details of impacts in H1

Change in GP due to                                                    Effect of increased revenue in Seasonings and Foods overseas, Functional Materials,
                                      17.8       24.2           42.1 Frozen Foods overseas, Bio-Pharma Services, etc.
change in sales
Change in GP due to change in                                          GP margin of Seasonings & Foods, Frozen Foods, Healthcare and Others decreased
                                      -9.1      -10.9          -20.1 due to the impact of substantial price increases for raw materials and fuel.
GP margin
                                                                       SGA expenses increased due to currency translation effects and substantial logistics
Change in SGA expenses                -7.4        -9.9         -17.3 cost increases.

Share of profit of associates
                                        0.2       0.0            0.2
and joint ventures

Total                                   1.5       3.4            5.0
                                        Copyright © 2022 Ajinomoto Co., Inc. All rights reserved
                                                                                                                                                        5
Forecast for FY2022 (Ending March 31, 2023) and Initiatives for Enhancing Corporate Value - Ajinomoto Co., Inc. (2802)
I-2. Changes in Business Profit (First-Half Results by P&L Factor)
 (¥ bil.)
  120

  100                                       -20.1
                            42.1
                                                              Approx.                -17.3
    80
                                                              18.3                                               0.2

    60
                                                                            Includes:
                                                                                                                        (approx.)
                                                                              Change in investment in marketing        +¥1.5 bil.

            69.3
                                                                              Increased logistics costs due to
                                                                              more product shipments and                -¥3.5 bil.    74.3
    40                                                                        higher shipping fees
                                                                             Other                                     -¥3.0 bil.
                                                                                Note: Effect of currency translation excluded

    20
            H1-FY21         Change in      Change in GP       (includes               Change in                 Share of             H1-FY2022
                                                                                                                                      H1-FY22
             Actual         GP due to         due to        international               SGA                      profit of             Actual
                            change in      change in GP       consumer                expenses                 associates             Actual
                              sales           margin        product price                                          and
                                                             increases)                                      joint ventures

      Ref: Impact of costs for raw materials and fuel, and food ingredients: approx. -¥8.0 billion (net impact)
           Impact of currency translation: approx. +¥7.0 billion
            (Change in GP: approx. +¥19.5 billion, Change in SGA expenses: approx. -¥12.5 billion )
           Cost decreases: approx. +¥2.0 billion

                                   Copyright © 2022 Ajinomoto Co., Inc. All rights reserved                                                      6
Forecast for FY2022 (Ending March 31, 2023) and Initiatives for Enhancing Corporate Value - Ajinomoto Co., Inc. (2802)
I-2. Changes in Business Profit (First-Half Results by Disclosed Segment)

  (¥ bil.)

   80

   75                                                                             0.4

   70                                                          8.0
                          -2.0              -1.3
   65

                                                                                          74.3
   60
             69.3

   55

   50
             H1-FY21
              H1-FY21   Seasonings         Frozen           Healthcare            Other   H1-FY22
                         and Foods         Foods            and Others
               Actual                                                                      Actual

                           Copyright © 2022 Ajinomoto Co., Inc. All rights reserved                 7
Forecast for FY2022 (Ending March 31, 2023) and Initiatives for Enhancing Corporate Value - Ajinomoto Co., Inc. (2802)
I-3. Items that Impact Business Results (Main and Sub Fermentation Raw
     Material Prices)
  We will respond to rising raw material costs by carrying out agile price increases,
  and will continue working to increase unit prices from the second half of FY2022
  and bring business profit margin back up.
The weighted average of main and sub fermentation raw material prices
(purchase volume, FY2011 actual to FY2022 forecast) Jan. 2011=100
                                                                                                                             • In the first half of the fiscal year, the main effect
     200                                                                                                                       was from secondary raw materials, but pressure
                                                                                                                               is also increasing from rising prices of main
     150
                                                                                                                               fermentation raw materials.
     100                                                                                                                     • Includes price increases surpassing initial
                                                                                                                               forecasts.
                                                                                                                                                                         Oct. 2022–March 2023,
       50
              '11      '12      '13     '14    '15    '16       '17    '18     '19     '20       '21        '22        '23                                                  revised forecast
                                                                                                                             150
                                                                                                                                                       May 2022–March 2023,
                                                                                                                                                          initial forecast

 Seasonings and Foods
 BP, BP margin (until 2014: Operating Profit)                                                                                      April 2021–Sept. 2022,
   (¥ bil.)                                                                                                                                actual
                                                             BP (excluding shared            BP margin (excluding
  1,200
    120                                                      expenses)                       shared expenses)20%             100

  1,000

   800
    80                                                                                                            15%
                                                                                                                                       1Q        2Q     3Q     4Q       1Q       2Q   3Q      4Q
   600
                                                                                                                              50
   400                                                                                                            10%              4        6    8     10 12   2    4        6    8   10 12    2
    40
                                                                                                                                                2021                         2022             2023
   200

      0                                                                                                           5%
                FY11     FY12    FY13   FY14   FY15   FY16     FY17   FY18   FY19    FY20     FY21         Plan
                                                                                                       FY22予想

                                                               Copyright © 2022 Ajinomoto Co., Inc. All rights reserved                                                                              8
Forecast for FY2022 (Ending March 31, 2023) and Initiatives for Enhancing Corporate Value - Ajinomoto Co., Inc. (2802)
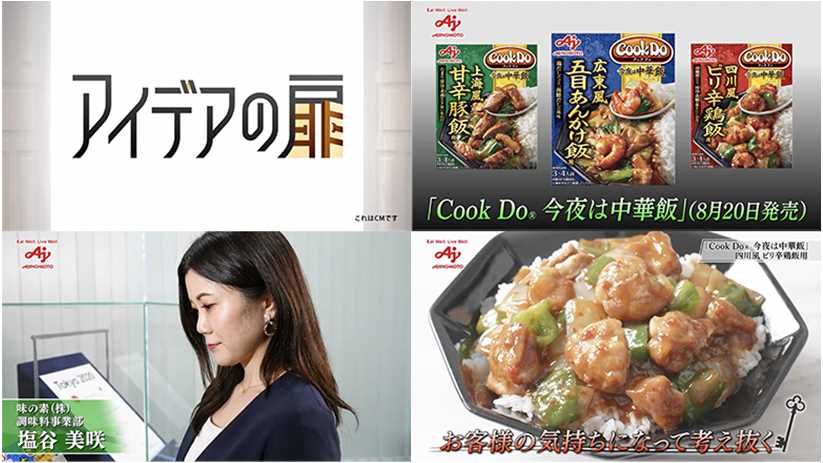
I-3. Items that Impact Business (Respond to the Effect of Costs & Expenses)

In the first half of FY2022, raw material and fuel prices rose more than expected. We are responding to
this with price revisions in excess of plans (including pull-ins) to minimize the impact.
In the second half of FY2022, too, we will respond solidly by further advancing unit price increases.

                                    YoY Amount of Impact of Costs & Expenses on
                              Seasonings and Foods Business BP, and Our Response
                  Effect of price increases          Effect of quantity increases
                                                                                                               Response in FY2022
    (¥ bil.)      Cost increases (excluding          Price and quantity increases                              will bring results in
                  shared expenses – Summary)                                                                   FY2023
    80

    40

       0

    -40

    -80
               FY21-Q1    FY21-Q2       FY21-Q3       FY21-Q4       FY22-Q1         FY22-Q2        FY22-H2        FY23-H1      FY23-H2
                                                                                                    forecast      estimate     estimate

                                              Copyright © 2022 Ajinomoto Co., Inc. All rights reserved                                    9
Forecast for FY2022 (Ending March 31, 2023) and Initiatives for Enhancing Corporate Value - Ajinomoto Co., Inc. (2802)
I-4. Forecast for FY2022
Full-year FY2022 forecast: Increased revenue and profit (upward revision, Past top update)
While the business environment will be challenging, we will take appropriate measures and strengthen
our business foundation, and connect this to sustainable growth while achieving organic growth.

                                       Sales                                                  Business profit

                             ¥1,367.0 billon                                              ¥133.0 billon
                       118.9% of FY2021 results                                     110.0% of FY2021 results
                 Excluding currency translation: 109.8%                       Excluding currency translation: 100.2%

                                       FY22             FY21                                         FY22
         (¥ Billion); -: losses                                          vs. Prev. year                             vs. Initial forecast
                                  Revised forecast      Actual                                 Initial forecast
        Sales                               1,367.0          1,149.3                118%                 1,310.0                    57.0
          Seasonings and
                                              784.7              664.2              118%                   748.3                    36.3
          Foods
          Frozen Foods                        261.1              221.7              117%                   255.8                     5.2
          Healthcare and
                                              303.5              251.2              120%                   287.9                    15.6
          Others
          Other                                17.6               12.1              144%                     17.8                   -0.2

        Business Profit                       133.0              120.9              110%                   124.0                     9.0
          Seasonings and
                                               81.0               81.2               99%                     76.5                    4.5
          Foods
          Frozen Foods                          0.1               -0.6                    -                   2.6                   -2.5
          Healthcare and
                                               55.8               43.3              128%                     47.5                    8.2
          Others
          Other                                -4.0               -3.0                    -                  -2.7                   -1.3
                                        Copyright © 2022 Ajinomoto Co., Inc. All rights reserved                                           10
I-5. Changes in Business Profit (Forecast by P&L Factor)
 (¥ bil.)

 200

                                              -21.0

                                                               Approx.
 160                          81.0                              39.5                  -50.5
                                                                                                                  3.5
 120                                                                         Includes:                                 (approx.)
                                                                              Increased investment in marketing -¥14.0 bil.
                                                                              Increased logistics costs due to                         133.0
              120.9                                                           more product shipments and
                                                                                                                        -¥5.0 bil.
                                                                              higher shipping fees
                                                                              Other                                    -¥8.0 bil.
                                                                                Note: Effect of currency translation excluded
   80
             FY21 Actual      Change in      Change in GP      (includes              Change in                  Share of            FY22 forecast
                              GP due to         due to       international              SGA                       profit of
             1USD=¥112        change in      change in GP      consumer               expenses                  associates
                                sales           margin       product price                                          and               1USD=¥135
                                                              increases)                                      joint ventures

        Ref: Impact of costs for raw materials and fuel, and food ingredients: approx. -¥5.0 billion (net impact)
             Impact of currency translation: approx. +¥12.0 billion
              (Change in GP: approx. +¥35.5 billion, Change in SGA expenses: approx. -¥23.5 billion )
             Cost decreases: approx. +¥4.0 billion

                                     Copyright © 2022 Ajinomoto Co., Inc. All rights reserved                                                        11
I-5. Changes in Business Profit (Forecast by Segment)

 FY2022 Revised Forecast vs FY2021 Actual
  (¥ bil.)

   150
                                                                        12.4               -1.0
   130                              -0.1               0.8
   110

                120.9                                                                                 133.0
     90

     70
                 FY2021         Seasonings and       Frozen           Healthcare           Other        FY22
                                                                                                       FY2022
                  Actual            Foods            Foods            and Others                   Revised  forecast
                                                                                                   Revised forecast

 FY2022 Revised Forecast vs FY2022 Initial Forecast
  (¥ bil.)
  150
                                                                         8.2                -1.3
                                     4.5              -2.5
  130

  110
                124.0                                                                                  133.0
    90

    70
                   FY22         Seasonings and       Frozen           Healthcare           Other        FY22
                                                                                                       FY2022
             Initial forecast       Foods            Foods            and Others                   Revised forecast
                                                                                                   Revised forecast

                                     Copyright © 2022 Ajinomoto Co., Inc. All rights reserved                          12
I-6. Priority KPIs (Group-wide Forecast)
Steady progress toward achieving the structural targets of the MTP. To ensure the achievement of
FY2022 and FY2025 targets, we are moving to steadily execute the MTP priority themes.
                                                                                                                   20-22
                                                                                                                   20–22                                         23–25
                                                                                                                  フェーズ1                                                         2030 Goal
                                                                                                                  Phase 1                                       Phase 2

                                                                                                               Structural reform                               Regrowth
                                                                             FY19       FY20        FY21         H1-FY21           FY22           FY22           FY25
                                                                             (Actual)    (Actual)   (Actual)       (Actual)       (Forecast)    (MTP Target)   (MTP Target)

                             Efficiency
                                          ROIC (>Capital cost)
                                          ( ): Excluding expenses for
                                                                             3.0%       6.9%        7.9%                            8.0%            8%         10-11%            13%
                                                                          (Approx. 6%)(Approx.8%)
                                                                                                (Approx. 8.5%)                  (Approx.9%)
                                          structural reform
  Financial indicators

                                                                                                                                  Approx.
                                          Organic sales growth
                             Growth (YoY)                                    0.3%       -0.6%       6.8%          11.2%             11%            4%             5%              5%
                                                                                                                                  Approx.
                                          Percentage of sales from
                                          core businesses                   66.5% 66.6% 68.7%                     68.3%             70%            70%           80%          80% or more
                                      Unit price growth (YoY)                Approx.                                              Approx.
                             Priority
                              KPIs
                                      (International
                                      consumer products)
                                                                              5%        2.8%        4.8%          10.4%             12%           2.5%            3%              3%
  Non-financial indicators

                                          Employee engagement
                                          (“ASV as one’s own initiative”)    55%        64%         61%                       62%                  70%           80%          85% or more
                                                                                                                    (Nov. preliminary figure)

                                          Brand value (mUSD)
                             Strength-    (Interbrand research)
                                                                             780        926         1,208                          Target 7% CAGR for brand value
                              ening
                              brand                                                                                                    Increase in score for each of
                                          Brand strength score                56          58          59                              12 major countries of business

                                                                        Copyright © 2022 Ajinomoto Co., Inc. All rights reserved                                                            13
I-6. Priority KPIs (Forecast by Segment)
             Segments                                                      FY2021 Actual and FY2022 Forecast
                                                                                 Unit price growth
                                                  Organic growth                                                              ROIC
                                                                           (International consumer products)
                                                        (%)                              (%)                                    (%)

                                                                                                               FY21*
                                                                                                                                       MTP Targets
                       Sauce &               FY21     H1-FY22     FY22      FY21      H1-FY22      FY22                   FY22*
                      Seasonings             actual    actual   forecast    actual     actual    forecast      actual   forecast      FY22      FY25
                                                                Approx.                           Approx.                 Approx.
Seasonings              Quick
and Foods            Nourishment             4.9%      9.3%      10%        3.5%       6.8%        9%          10.9%       12%         12%       17%
                                                                                                                                      or more    or more
                       Solution &
                      Ingredients                                                                                          WACC 6%

                                                                Approx.                           Approx.                 Approx.
 Frozen                                       9.8%     7.6%        6%        7.8%     18.5%       19%          -1.5%       0%          1%         5%
                     Frozen Foods                                                                                                     or more
 Foods
                                                                                                                           WACC 5%

                Bio-Pharma Services &
                      Ingredients
                                                                Approx.                                                   Approx.
Healthcare
   and            Functional Materials       10.8% 19.2%          15%         -          -          -          10.7%       13%         10%       12%
                                                                                                                                      or more    or more
 Others
                        Others                                                                                             WACC 8%

    * Excluding structural reform expenses
                                                Copyright © 2022 Ajinomoto Co., Inc. All rights reserved                                                   14
I-7. Progress of Structural Reform
                        ROIC expected to temporarily fall below real capability due to                              Proceed with even greater structural reform to
                               impairment accompanying structural reform                                                make sure we reach our ROIC target

                                                                                          Approx. 8.5%                   Approx. 9%
                                                            Approx. 8%               (excluding impairment loss)   (excluding structural reform expenses)
                                                      (excluding impairment loss)
                              Approx. 6%
                       (excluding impairment loss)
                                                                                                                                                                10–11%
   ROIC      Approx.   5%
               WACC
             hurdle rate
                                                                                              7.9%                          8.0%
                                                             6.9%
                               3.0%
                             FY19 actual                   FY20 actual                   FY21 actual                 FY22 forecast                               FY25 target
                                                                                                                                                            FY23-25 (Phase 2)              +
                           Implemented                                               FY20-22 (Phase 1)                                                                                    1– 2
   Profit                                                                           Profit improvement by                                              Continuous profit improvement
                                                                                                                                                                                           pt
improvement                                                                           approx. JPY 30B                                  +2     pt         (unit price increases due to
                                                                                      over three years                                                  creation of health value, etc.)
                            Asset reduction            Asset reduction                 Asset reduction               Asset reduction
                            (Approx. JPY 33B)          (Approx. JPY 37B)               (Approx. JPY 43B)             (Approx. JPY 10B)                                                     +
                                                                                                                                                                                          0.5
   Asset                                                                                                                                                                                  pt
                            Resource allocation        Resource allocation            Resource allocation           Resource allocation                     Restructure businesses
 reduction                  and sale of                and sale of                    and sale of                   and sale of                                identified by FY22,
                            cross-shareholdings        cross-shareholdings            cross-shareholdings           cross-shareholdings                     control overall asset size
                            (Approx. JPY 32B)          (Approx. JPY 17B)              (Approx. JPY 34B)             (Approx. JPY 27B)                           (build ecosystem)
                                Approx.                       Approx.                        Approx.                                      Plan to pull in           Approx.
                                                                                                                                            a portion
                                JPY 65B                       JPY 54B                        JPY 77B                                                                JPY 50B                +
                                                                                                                                                                                           X
                                                                                                                                                                                           pt
                                                     Reduce assets on the level of JPY100B over three years from FY20-22

                                                     Reduce assets by a total of JPY                           200B by FY25
  +X   pt Contribution from ROIC (compared to FY19)
                 +Xpt                          Copyright © 2022 Ajinomoto Co., Inc. All rights reserved                                                                                   15
I-7. Progress of Structural Reform

                  Structural reform in non-core businesses                              Financial impact

       Animal Nutrition                                                                 Amount of asset
   1                       Completed sale of company in Europe in April.              reduction in FY2021:
       Business            Shift to customer solution-providing business.
       (commodities)                                                                 approx. ¥15.5   billion

   2 Part of MSG           Promote structural reform aimed at reducing
                                                                                      Project is underway
     Business              industrial business (outside sales).

                           Steadily increase production in growth areas such            Amount of asset
   3 Part of Frozen        as in Asian category and reduce assets globally            reduction in FY2021:
     Foods Business        while also reducing SKUs.                                 approx. ¥3.0   billion

                          Copyright © 2022 Ajinomoto Co., Inc. All rights reserved                             16
I-8-(1). Seasonings and Foods, Japan (Initiatives for Organic Growth)

   Excluding the impact of *AGF structural reform, the first half of FY2022 saw
   increased revenue for the combination of home-use products and restaurant and
   industrial-use products
               Home-use products                                     Restaurant and industrial-use products
      At-home dining continues to decline.
                                                                     As social and economic activities return to
  (April to September 2022: approx. 95% vs. prev. year)
                                                                    normal, spending on dining out is recovering.
   In addition to a rebound from the pandemic,                     (April to September 2022: approx. 110% vs. prev. year)
     consumers are beginning to guard their                             Inbound tourism is expected to increase
                     lifestyles

        Launch of new products that                                Proposal of solutions to the problems of
      capture consumers' need for rice                             users concerned about the rising cost of
              at a stable price                                        fried chicken (oil, flour, chicken)

                                                                         *From Ajinomoto AGF, Inc. to Suntory Beverage & Food Limited
                                                                         Succession of manufacturing and sales of "Blendy®" bottled coffee
                                   Copyright © 2022 Ajinomoto Co., Inc. All rights reserved                                               17
I-8-(2). Seasonings and Foods, Overseas (Initiatives for Organic Growth)

In Sauce & Seasonings overseas, both sales and volume remained strong.
We achieved increased volume while working to raise prices in various countries, according to or ahead of plans.

                                              Sales of Sauce & Seasonings
                                                       overseas: 112%             (local currency basis)

                            Quantity          105%                Unit price         107%
                    Price increases
                    Number of countries and number of times
                       FY2022 H1    FY2021 full year

                     16 countries   12 countries       • Achieved double-digit or greater growth by weight
      Umami                                              in umami seasonings
    seasonings                                           As a mindset of guarding lifestyles grows among consumers, we are able to
                       26 times       24 times           further capture demand.

                      8 countries    7 countries
      Flavor                                           • Growth by weight of flavor seasonings, in low single digit
    seasonings
                       12 times       15 times
                                                       • Increased share in major countries

                                                       • High single-digit decrease by weight (high single-digit increase in unit price).
                      7 countries    6 countries
  Menu-specific                                          The rate of decreased at-home dining has an effect in the short term, but in the
   seasonings                                            medium to long term, we anticipate a return to expansion in line with the desire
                       11 times        9 times
                                                         for convenience.
                                     Copyright © 2022 Ajinomoto Co., Inc. All rights reserved                                               18
I-8-(2). Seasonings and Foods, Overseas (Initiatives for Organic Growth)
Umami seasonings and flavor seasonings that are less susceptible to
business conditions
        Thailand GDP and AJI-NO-MOTO®, RosDee® (flavor seasonings) sales in Thailand (THB)
                AJI-NO-MOTO®             RosDee®                GDP growth rate                                                                                                 (%)
                                                                                                                                                                   COVID-19       10
                                                                                                                                                                   pandemic
                                                                                                                                                                                 5
                                          GDP growth rate                                                                                                                        0
                                                                                                    Thailand floods
                                                                                                                                                                                 -5
                                                                         Financial crisis
                                                                                                                                                                                 -10

                                                                                                                                                                                 -15
                   Thailand
                currency crisis                                                                                                                                                  -20

                                                                                                                                                                                 -25

                                                                                                                                                                                 -30

         1996        1998         2000     2002          2004          2006          2008          2010          2012          2014          2016          2018          2020

                 AJI-NO-MOTO®, RosDee® (flavor seasonings) business profit (THB)

                                                  2003          2005          2007          2009          2011          2013          2015          2017          2019

                                             Copyright © 2022 Ajinomoto Co., Inc. All rights reserved                                                                                  19
I-9. Frozen Foods (North America, Currently and Going Forward)

1. North America Business: Path to ROIC Improvement                                       Initiatives to be solidly
                                                                                                  carried out
                                                 1                                    (1) Unit price growth by
                                                                                         Price increases
       During structural reform, impacted by COVID-19                                 (2) Improve production by
                                                                                         promoting OE
                 and inflation, BP decreased.                                         • Stabilize production with tech
                                                                                         and by assisting human
  Will consider further structural reform while solidly                                  resources
  carrying out the planned initiatives.                                               • Promote automation
                                                                                      • Accelerate introduction of DX
                     AFNA , BP (local currency basis)                                 (3) Rearrange the portfolio
                                                                                      • Concentrate on core areas
                         BP    BP plan
                                                                                      • Get out of non-core areas
                                                                                         (complete by FY25)
                                                                                         ⇒Improve product mix and
                                                                                         further reduce SKUs
                                                                                      (4) Rebuild production
                                                                                      • Transfer non-core production
                                                                                         assets to core areas to increase
                                                                                         production

                                                                                          Further structural reform
                                                                                             (being considered)
                                                                                     (1) Structural reform of low-profit products
                                                                                         even in the Asian categories
      FY20           FY20          FY21           FY21          FY22
                                                                                     (2) Proceed with further
       H1             H2            H1             H2            H1
                                                                                         restructuring of production
   *AFNA: Ajinomoto Foods North America, Inc.
                               Copyright © 2022 Ajinomoto Co., Inc. All rights reserved                                        20
I-9. Frozen Foods (North America, Currently and Going Forward)

1. North America Business: Path to ROIC Improvement
                                                                     2
                        Growth of the packaged frozen foods market slows down temporarily

           Focus on core categories (especially the Asian category)
                    Expansion of the Asian category is expected to continue, returning to growth

                   Frozen foods market in                  Share of market for                                     Growth of the Asian
                                                           Asian category                          (US$ million)   category
                   North America
    (%)                                                                     Local currency basis
                                                                                                   2200
    120                                                                                            2100
                                         year-on-year
                                                                       Asian                                        CAGR
                                         volume                                                    2000             approx.
                                                                                                   1900             11.5  %
    110                                                         North America                      1800            (FY17-21)
                                                               packaged frozen
                                                                                                   1700
                                                                foods market
                                                                                                   1600
    100                                                      approx. $20 billion                   1500
                                                              FY2017-2021 CAGR
                                                                                                   1400
                                                                     2.4%
                                                                                                   1300
     90                                                                                                    2017     2018       2019   2020   2021
          FY22.1    2   3   4    5   6    7     8

                    Packaged frozen foods                      The Asian category accounts for 10% of the total market
                    Asian, Mexican frozen foods                (room for expansion).
                                                               It has grown rapidly in recent years. It is expected to
                                                               continue to have double-digit CAGR growth, too.

                                           Copyright © 2022 Ajinomoto Co., Inc. All rights reserved                                                 21
I-9. Frozen Foods (Expansion of Asian category overseas, including N.A.)

2. North America Business: Asian Category Expansion Strategy
             Group with high interest in Asian foods                                    Trial group for Asian foods
                      (middle class and higher)                                             (middle class and lower)

                     Offer high-value-added                           Proposal of meals in containers that can
                       authentic products                                 be easily prepared by microwaving
        Value-added products:                                               Entry products:
            Wide lineup of Gyoza, shumai                                       Trial promotion through simple and
            noodles, rice, etc.                                                health-conscious products
                                                                                         Market expansion

3. Dramatic Growth of Gyoza Overseas
      Gyoza made with our technology are
                                                         FY2018–FY2022 sales CAGR
      growing overseas                                                      Local currency basis

  1    Sales doubled in 5 years on a yen basis         North America              14%
       Sales in FY2022 are expected to surpass            Europe                  14%
  2
       gyoza sales in Japan                               ASEAN                   14%
                                                        (Reference) Japan          7%                Tasting at mass retailer   Expansion into DONKI
                                                                                                            in France                in Thailand

                                   Copyright © 2022 Ajinomoto Co., Inc. All rights reserved                                                            22
I-9. Frozen Foods (Significance of Frozen Foods Business)
4. Significance of Frozen Foods Business

  1   Future growth driver
      Frozen Foods is a developed country-oriented business that responds to needs such as
      shorter cooking times and individual meals, etc.
          Touchpoints with consumers in Europe and the U.S. in addition to Japan
                                                                                                                            Microwave ready

  2   Contribution to ASV “solve food and health issues”
      We can provide the exact meals for each menu.
        Provide direct health value (salt reduction, sugar reduction, fat
         reduction, protein fortification, etc.) leveraging the Ajinomoto Group’s                Allergen-free product            Reduced salt
         proprietary ingredients and technologies.                                                                                product

                                                                   (Reference)
  3   Contribution to corporate brand                                                    Japan                           North America
                                                                                 No. 1   AJI-NO-MOTO
                                                                                                                   No. 1   Frozen Foods
      Frozen Foods rank high in Japan and North America as a product             No. 2   Frozen Foods

      associated with the Ajinomoto brand.                                       No. 3   HONDASHI                  No. 2    AJI-NO-MOTO®
                                                                                             …
        Contribution to enhancing value of corporate brand                       No. 6      Gyoza                  No. 3     Seasoning

                      Execute business plans in Japan and Europe as planned
                Improve North America business to achieve 5.0% ROIC by FY2025

                                 Copyright © 2022 Ajinomoto Co., Inc. All rights reserved                                                        23
I-10. Electronic Materials Business (Drive Growth through BMX)
                                                                                                               BMX: Business Model Transformation
   Expansion of server applications is driving recent ABF growth
                                                                                        ABF: Ajinomoto Build-up Film

                      First half of 2022
                      Functional Materials
                                                         Sales: ¥37.2 billion (130% of prev. year )

                      2022
                      Server market (forecast)                   USD 124 billion (114% of prev. year)
                                                                                   Figures announced by IDC on September 26, 2022
                 Over the short term, growth momentum may slow down temporarily due to a
                                  larger-than-expected drop in the PC market

  1.
  1. The 5G market will expand in
     the medium to long term
       (Increase in ABF demand due to increase
       in 5G base stations)

 Source: Small Cell Forum Ltd.
                                                                                            The copyrights of the Content are owned by Small Cell Forum Ltd

                                     Copyright © 2022 Ajinomoto Co., Inc. All rights reserved                                                           24
I-10. Electronic Materials Business (Drive Growth through BMX)

      2. Expansion of                  Increase in                                   Increase in data centers
         5G market                     communication                                 (Increase in demand for ABF)

                                       traffic

                                                          Increase in
                                                          traffic due
                                                          to 5G

              Mobile devices                Macrocell                                   Increase in data centers

               Demand for ABF will be firm
                                                                      Ajinomoto Build-up Film® (ABF)
               over the medium to long term
                                                                      Shipment Volume
               because of increased
               communications                                                    CAGR
                                                                                  approx.
               CAGR of +18% (FY2020-FY2025)                                       18%
                                                                             FY2020-FY2025
               expected.
                                                                                                            345
                                                                                          190
  Because future demand for ABF is expected to
                                                                         100
  increase, we will partially increase production
     ahead of schedule at AFT's Gunma plant                               FY17              FY21          FY25 plan
                                                                         Estimate when FY2017 shipment volume is set to 100

                               AFT: Ajinomoto Fine-Techno Co., Inc.
                                   Copyright © 2022 Ajinomoto Co., Inc. All rights reserved                                   25
I-11. Assets and Liabilities
    Total assets increased due to increases in inventory due to currency translation effects
    and increases in raw materials prices.

                                                                                  Net D: Interest-bearing debt - Cash on hand and in banks x 75%

                (¥ bil.)
                                      Total assets     Net D/E ratio                                              (%)
                  20,000
                  2,000                                                                                             60

                  15,000
                  1,500                                                                                             40

                  10,000
                  1,000                                                                                             20

                    500
                    5,000                                                                                           0

                     0     0                                                                                   -20
                               FY12             FY14          FY16       FY18           FY20          FY22 forecast
                                                                                                 FY21 FY22予想
                                                                                               20-25MTP

                                       Copyright © 2022 Ajinomoto Co., Inc. All rights reserved                                                    26
I-12. Cash Generation
    The revised forecast for operating cash flow is approximately ¥112.0 billion.
    In FY2022, working capital, such as accounts receivable (price increases and currency
    translation) and inventories (raw material prices and currency translation) in particular, was
    affected by substantial raw material price increases and currency translation. We will work to
    generate more cash with improvements in the cash conversion cycle.

           Operating Cash Flow
             (¥ bil.)
              200

              150

              100

                50

                  0
                        FY12      FY14            FY16           FY18            FY20                   forecast
                                                                                                    FY22予想

                                                                                        20-25 MTP

                               Copyright © 2022 Ajinomoto Co., Inc. All rights reserved                            27
I-13. Strategic Investments
    We will shift investments from tangible to intangible assets such as research and
    development, marketing, DX, business model development, and human resources.
    In capex, we will agilely make growth investments in core businesses such as
    electronic materials.

                                                                                                                                   Percentage of investment
                                                                                        DX, business model development, and        無形投資比率
                                                                                                                                   in intangible assets
                       設備投資
                       Capex              研究開発費
                                         R&D expenses           マーケティング
                                                                Marketing               DX・事業モデル開発・人財                                   (%)
                                                                                        human resources
                       無形投資比率
                       Percentage of investment in intangible assets                                                                    60%

                                                                                                                                        50%

                                                                                                                                        40%
         (¥ bil.)
        1,500
          150
         1,500                                                                                                                          30%

        1,250                                                                                                                           20%

        1,000
         1000
         100

          750

         500
         500                                                     AGF                                                                      Agilely make
          50                                                   consol-
                                                                                Reorganization of Japan
                                                                                 production bases, etc.                                      growth
                                                               idation
          250                                                                                                                            investments in
                                                                                                                                        core businesses

           00
                    FY12     FY13        FY14       FY15        FY16     FY17      FY18       FY19        FY20     FY21       FY22 forecast
                                                                                                             20-25 MTP

                                      Copyright © 2022 Ajinomoto Co., Inc. All rights reserved                                                                28
I-14. Important Management Indicators

  Important management indicators for FY2022 are expected to exceed initial forecasts due to
  steady growth in business profit.

             ROE    (%)                                        ROA (BP basis, %)
             14.0                                              10.0
                                       11.6     11.5                                                 8.8
                           10.3                                 9.0                         8.4
                                                                                 8.1
             10.0
                                                                8.0
                                                                       7.2
                                                                7.0
              6.0
                    3.3
                                                                6.0

              2.0                                               5.0
                    FY19   FY20        FY21       FY22                 FY19      FY20       FY21      FY22
                                                  Revised                                            Revised
                                                  forecast                                           forecast

             ROIC (%)                                          EPS (¥)
             10.0                                               200
                                                                                                    155.3
                                       7.9       8.0                                        139.4
                                                                160
              8.0          6.9                                                  108.3
                                                                120
              6.0
                                                                 80
                                                                      34.3
              4.0   3.0                                          40

              2.0                                                 0
                    FY19   FY20        FY21       FY22                 FY19      FY20        FY21     FY22
                                                  Revised                                             Revised
                                                  forecast                                            forecast

                                 Copyright © 2022 Ajinomoto Co., Inc. All rights reserved                        29
I-15. Investment for Growth and Shareholder Returns
      (Approach for FY2020–2022)

   Throughout the MTP, shift investments from tangible to intangible assets, from non-core to
   core businesses.
   Operating cash flow in FY2020-2022 is expected to exceed the ¥400.0 billion target in the MTP.
                             Cash Flow (Approach for FY2020–2022)
                                       In                                           Out

                        Operating cash flow,                                     Various
                        asset reduction, etc.                                  investments
                          ¥400 billion+                                        ¥290 billion

                            Operating cash flow                     Of which, approximately ¥210 billion
                                                                                 for capex
                      FY2020 actual         ¥165.6 billion
                      FY2021 actual         ¥145.5 billion
                                            approx.
                                                                           Shareholder returns
                      FY2022 forecast ¥112.0 billion                          ¥100 billion+

                                                      Intangible investments
                                                        approx. ¥210 billion
                      R&D                                                        approx. ¥87 billion
                      Marketing                                                  approx. ¥94 billion
                      DX investment, business model                              approx. ¥26 billion
                      development, human resources

                                  Copyright © 2022 Ajinomoto Co., Inc. All rights reserved                 30
I-15. Investment for Growth and Shareholder Returns
      (FY2022 Forecast)
   Decided to increase the dividend again (FY2021 ¥52 -> ¥62) and repurchase shares in FY2022.
   Work to further strengthen shareholder returns.
                                                                                                      ■ Shareholder Returns (Approach for FY2020–2022)

                                                                                                         Forecast total shareholder return for the 3 year
     Dividends (FY2012-2022 forecast)                                                                     period: target 50%+
                                                                                                (%)      Single FY payout ratio: target 40%
     80             Dividends per share                                                         80
                     Payout ratio
                    Payout ratio (excluding impairment loss)                                                              FY2022

                                                                                                                        ¥62/year
    (yen)
     60                                                                                         60
                                                                                                            (Dividend increase scheduled)
                                                                                                                  +¥10 from FY2021
                                                                                                            +¥4 from FY2022 initial forecast
     40                                                                                         40

                                                                                      62
                                                                              52                      Repurchase of shares with a limit
                                                                       42
     20                                            32     32    32                              20    of 10 million shares or ¥30 billion,
                                    28     30
                           24                                                                                which equals 1.86% of the total
                   20
            18
                                                                                                              number of shares outstanding
       0
            FY12   FY13   FY14      FY15   FY16   FY17   FY18   FY19   FY20   FY21     FY22
                                                                                                0               (excluding treasury shares)
                                                                                     forecast

                                                  Copyright © 2022 Ajinomoto Co., Inc. All rights reserved                                                  31
I.   Summary Results for the First Half Ended
     September 30, 2022 and FY2022 Forecast
II. The Corporate Value Enhancement Cycle and
    Engagement
III. Medium-Term ASV Initiative
     for the 2030 Roadmap
II-1. Growth Strategy Aimed at Enhancement of Corporate Value

We will enhance growth potential and profitability through the driving of growth in the four
areas of BMX, the integration of food and AminoScience, and the strengthening of efficient
management through further selection and concentration

                    • Organic growth of existing businesses
                    • Driving of growth through the four areas of BMX
                    • Growth through the integration
                      of food and AminoScience
                                                            CAGR
                                                         Double-digit %              1
  Business profit

                                                                                                             Becoming a more unique
                      AminoScience                                                                           company by Integrating
                        Business         1                    CAGR
                                                                                                             food and AminoScience
                                                              3–5%

                     Food Products                                                   1
                       Business          2

ROIC                      7.9   %                                                                13 %
                          FY21                                                                 FY2030
                                                                                            rough forecast
                                                 Copyright © 2022 Ajinomoto Co., Inc. All rights reserved                             33
II-2. ASV Management: Management under the New Executive Team
        (What should be evolved)

                      Purpose
                                                              Speed Up
                             ×
                      Passion                                            ×
                             ×                                 Scale Up
                            OE

    Speed Up   Transformation of corporate culture and appropriate top-down and bottom-up communication
               Accelerate "Stop and Reduce" to earnestly tackle what we want to do

               Standardization of successes inside and outside the Ajinomoto Group, integration of
    Scale Up   food and AminoScience, transformation of the business model, and creating next-
               generation businesses

                            Copyright © 2022 Ajinomoto Co., Inc. All rights reserved                      34
II-3. Four Growth Areas of BMX

 We have identified four BMX areas where Ajinomoto Group can leverage its strengths going
 forward into 2030. Based on the value we want to provide and co-create, we have identified
 Healthcare, Food & Wellness, ICT, and Green as growth areas.
Four growth
   4つの成長領域             Value (outcomes) that Ajinomoto Group wants to co-create and provide     Specific businesses in each field
   areas
                                                                                                ● CDMO
                Contribute to extending healthy life expectancies                               ● Culture media and regenerative
                                                                                                  medicine
Healthcare New social systems, technologies, values will bring about
                                                                                                ● Cell therapy and gene therapy
    ヘルスケア a healthy way of life suitable for an era of                                            solutions
                100-year life expectancies
                                                                                                ● Medical food business

                Contribute to well-being and self-realization                                   ● DtoC and e-commerce
                                                                                                  businesses for food and health
  Food &  Towards a value system wherein happiness is subjective and                              led by advanced customer
 Wellness
 フード&ウェルネスpersonal, and the happiness of society and the earth beyond the                         experience
                individual is realized                                                          ● Solutions for each health issue

                                                                                                ● ICT solutions business
                Contribute to a smart, sustainable society
                                                                                                   Photoelectric fusion packages
   ICT          Construction of a new social system through the development
         ICT    of digital social infrastructure and the transformation of
                                                                                                   Next-generation memory

                physical social infrastructure                                                     Next-generation energy-related
                                                                                                   business

                Contribute to the earth, a low-carbon society,
                                                                                                ● Sustainable food business
                and future generations
                                                                                                   Plant-based proteins
  Green
     グリーン Responding to the limits of safe human survival on the planet and                        Cultured meat
                the limits of providing and maintaining adequate health for all,
                through technological innovation and changing values/behaviors.                    Microbial proteins

                (Responding to the boundaries of Planet & Health)

                                     Copyright © 2022 Ajinomoto Co., Inc. All rights reserved                                  35
II-4. BMX: The Shape of New Successes in Food and Wellness (Marketing)

In the consumer foods products business, we have worked toward growth by creating new areas
in response to changes in the economic environments and lifestyles in different countries.

           ■ Change in Knorr® soup business sales, Japan
            35000

                         New
            30000
                         Snack soup
            25000        Soup with rice
                         Western-style single serving
            20000
                         Cooking soup

            15000

            10000

            5000

               0
                1964 1966 1968 1970 1972 1974 1976 1978 1980 1982 1984 1986 1988 1990 1992 1994 1996 1998 2000 2002 2004 2006 2008 2010 2012 2014 2016 2018 2020

           ■ Change in sales, Ajinomoto Co., (Thailand) Ltd.
            35000

                         RosDeeMenuTM KKR
            30000
                         RosDeeMenuTM

            25000        YumYum
                         Birdy 3in1
            20000        Birdy RTD
                         RosDee
            15000
                         AJI-NO-MOTO          PLUS

            10000        AJI-NO-MOTO

             5000

                0
                1987 1988 1989 1990 1991 1992 1993 1994 1995 1996 1997 1998 1999 2000 2001 2002 2003 2004 2005 2006 2007 2008 2009 2010 2011 2012 2013 2014 2015 2016 2017 2018 2019 2020 2021

                                                     Copyright © 2022 Ajinomoto Co., Inc. All rights reserved                                                                                    36
II-4. BMX: The Shape of New Successes in Food and Wellness
      (A Recent Case in Marketing 1)

    Cook Do® stir-fry sauce (Japan)
    For those who don’t purchase oyster sauce, we looked deeply into the reasons, identified the
    barriers that caused consumers’ dissatisfaction and came up with concepts and developed
    products. We are creating a market for oyster sauce entry products for consumers who don’t
    purchase oyster sauce, making it possible for them to enjoy true, chef-level Chinese just by
    stir-frying with Cook Do® stir-fry sauce.

             Oyster sauce purchasers
             (approx. 20%)
             Consumers who enjoy and have confidence
             in cooking, and who consider daily repertoire
             while using mainly basic seasonings, etc.

             Oyster sauce non-purchasers
             (approx. 80%)
             Of these, 50% are consumers who are
             not very skilled at cooking, but who
             consider daily repertoire using broths,
             sauces, etc.                                    Eliminate the category dissatisfaction barrier to
                                                             capture non-purchasers by having them try the
             (Handy-homemade group)
                                                             product
                                                             1. Combining with other condiments is difficult;
                                                                 flavor is unsettled
                                                             2. "Don't know what to use it for"

                                      Copyright © 2022 Ajinomoto Co., Inc. All rights reserved                   37
II-4. BMX: The Shape of New Successes in Food and Wellness
      (A Recent Case in Marketing 2)

    Plant-based protein hamburger mix (Brazil)
    In the area of plant-based food alternatives, which consist mainly of frozen foods, we have
    gathered detailed insights from flexitarians and vegetarians in Brazil and, are using the TERRANO
    brand to offer a highly nutritious powdered hamburger mix that does not sacrifice any
    deliciousness. These products are included in “Green” area in Four Growth Areas of BMX.

                Beef flavor                      Chicken flavor                    Original flavor

                              Copyright © 2022 Ajinomoto Co., Inc. All rights reserved                  38
II-5. BMX: Dramatic Expansion of Healthcare
      Global Business Partnership in the Biopharmaceutical Culture Media Business
The amino acids for pharmaceuticals and foods business consists mainly of amino acids for
pharmaceuticals and foods, biopharmaceutical cell culture media, and cell culture media for
regenerative medicine, and sales are growing steadily.

                                             2015
                                                        Cell culture media for
                                                        regenerative medicine
                        1987
                        Biopharmaceutical cell                         Amino acids for pharmaceuticals:
                        culture media                                  Ingredients in nutritional infusions, etc.
          1956
                                                                       Amino acids for foods: Ingredients for
      Amino acids for                                                  amino VITAL®, Amino Aile®, etc.
      pharmaceuticals and foods
                         Trend in sales of amino acid business                                      Growth rate with
                         (pharmaceuticals, foods, cell culture media)                               FY2014=100

                 2014     2015       2016        2017         2018        2019        2020   2021
                               Copyright © 2022 Ajinomoto Co., Inc. All rights reserved                                39
II-5. BMX: Dramatic Expansion of Healthcare
      Global Business Partnership in the Biopharmaceutical Culture Media Business
A stable supply of high-quality amino acids is supporting the growth of the market for
biopharmaceuticals
                                               High-quality amino acids are essential to the manufacture of
                                               biopharmaceuticals.
  Medium                                       We expect that global demand for cell culture media and
  A substance that provides an                 amino acids will experience robust growth as the market for
  environment for growth for cell              biopharmaceuticals expands.
  cultures in the cultivation of                ($ million)
  microbiological and biological tissue.         18,000     Growth in the market for cell culture media

                                                    15,000

                                                                                                                CAGR
                                                    12,000
                                                                                                                 15%

                                                     9,000                                   CAGR
                                                                                              15%                       16,565

                                                     6,000
                                                                            CAGR
                                                                             11%
                                                                                                       8,200
                                                     3,000

                                                                                     4,150
                                                                  3,050
                                                        0
                                                                   2017              2020       2025 (forecast)      2030 (forecast)

                                                                                                    Source: Market Report by Aranca

                               Copyright © 2022 Ajinomoto Co., Inc. All rights reserved                                                40
II-5. BMX: Dramatic Expansion of Healthcare
      Global Business Partnership in the Biopharmaceutical Culture Media Business

History of our culture media business
             1987                            Nov. 2012                      Mar. 2018                  Jun. 2019

First serum-free culture medium     Ajinomoto Genexine Co., Ltd.      Launched new brand,           Customer service
     in Japan, ASF Medium,                 (AGX) established             CELLiST®, for                OCS opened
            launched                    (Incheon, South Korea)         biopharmaceuticals        (Cheongju, South Korea)

                                     Development of cell culture media leveraging our knowledge of
                                     biotechnology including amino acid nutrition and
                                     pharmaceutical R&D, and fermentation production technology

                                  Our strengths in the culture media business
                                             We use advanced analytical equipment and R&D staff skilled in the analysis
    1 Advanced and rapid                     and evaluation of nutrients and metabolites. We can rapid develop high-
      culture development                    performance, high-quality culture media matched to customers' needs.

                                              The Ajinomoto Group’s production starts from the key raw materials,
    2 Stable supply chain                     amino acids, and speedily and stably supplies to the fast-growing Asian
                                              market (including Japan) from our culture production base (AGX) in South
                                              Korea in line with customers' needs.

                                      Copyright © 2022 Ajinomoto Co., Inc. All rights reserved                             41
II-5. BMX: Dramatic Expansion of Healthcare
      Global Business Partnership in the Biopharmaceutical Culture Media Business

                                         AJI-JSR
                                       collaboration

         1   Production by our Group of high-performance culture media
             developed by JSR Corporation
             (Strengthening of product lineup and achievement of stable supply)

         2   Leveraging of JSR's sales force to develop European and U.S.
             customers
             (Capture of new customers through collaboration with outside
             parties)

                        Toward further growth stages

                            Copyright © 2022 Ajinomoto Co., Inc. All rights reserved   42
II-6. Value Creation Story Based on Human Assets

Create innovation and enhance corporate value through co-growth of diverse talent and
organizations that create value.

                                                              Realizing ASV
                         Purpose: Unlocking the power of amino acids to resolve the food and health issues.

                                                         Co-growth of individuals
                                                            and organizations

                               Organization                                                    Diverse talent
                              creating value

                                                                ASV
                               Co-creation driven            engagement                        Autonomous and     Opportunities/
      Co-creation with            by inclusion                                                 sustained growth    Themes to
        ecosystem             Enhancement of the                                                 Keen sense of     tackle new
                           organization’s productivity                                            motivation       challenges

                                                                  Health & Well-being
                                        Health and well-being, safety and productivity management

                                                         Innovation creation

                                            Copyright © 2022 Ajinomoto Co., Inc. All rights reserved                               43
II-6. Value Creation Story Based on Human Assets

From this fiscal year we have introduced a new approach for the ASV realization
process and we have visualized opportunities and issues from the scores of related
questions in the engagement survey.
                                      ASV Realization Process                                                            ASV management cycle
                       Process                        Meaning/importance
                                           Understanding, agreement, and empathy toward                                                  Understanding
                                                                                                                   Improvement
Individuals

                Empathy for our purpose
                                           company policies                                                                              Sense-making

                                           Thinking based on issues for customers and
                Customer focus
                                           society

                ASV as one’s own           Self-motivation as the driving force for setting                                                Empathy
                                                                                                                Monitoring linked to
                initiative                 challenges
                                                                                                            engagement study questions    Resonance
                                           Accepting challenges and failure is essential for
                Encouragement for new
                                           greater individual and organizational
                opportunities
                                           achievements
                                           Utilize diverse human resources and foster a                           Example only
                Co-creation through        corporate culture that produces innovation
                                                                                                                                           Execution
                inclusion                  through internal and external dialogue and
                                           discussion based on equality                                                                   Realization
                                                                                                                                           process
                Enhancement of             Need to streamline and refine existing operations
                productivity               to make space for innovation creation
Organizations

                                           Innovation through new challenges is essential
                Innovation creation
                                           for resolving social issues
                                                                                                                                           Results
                Creation of social and     Creation of outcomes that lead to even greater                                                  creation
                economic value             social and economic value

                                                       Copyright © 2022 Ajinomoto Co., Inc. All rights reserved                                          44
II-6. Engagement Survey, Preliminary Results

We got high, favorable scores of 75% for the ASV Realization Process, which we introduced this fiscal
year. We will analyze the details of the scores and further evolve the processes to realize medium-
term ASV Initiative.
                  Favorable response score (including FY2022 preliminary results)
                Score for “ASV as one’s own initiative”                              ASV Realization Process
         (%)                                                          (%)
         66.0            64                                            78.0

                                   61
                                             62                                           75      75           75
         62.0
                                                                       74.0

         58.0
                 55
                                                                       70.0
                                                                               69
         54.0

         50.0                                                          66.0
                 FY19     FY20     FY21        FY22                             FY19      FY20     FY21       FY22
                                            Preliminary                                                    Preliminary
                                              results                                                        results
          (%)    Health and productivity management                    (%)     Employees’ Sustainable Engagement
         86.0    (Health & Well-being)                                 90.0

                         81        81
                                             82                                           86      86           86
         82.0                                                          86.0
                 79
                                                                                82
         78.0                                                          82.0

         74.0                                                          78.0

         70.0                                                          74.0
                                                                                FY19      FY20     FY21       FY22
                 FY19     FY20     FY21       FY22
                                                                                                           Preliminary
                                           Preliminary
                                                                                                             results
                                             results

                                     Copyright © 2022 Ajinomoto Co., Inc. All rights reserved                            45
II-6. (ref.)Forbes JAPAN “Inclusive Company Ranking100”

   We ranked No. 1 in Stakeholder Capitalism Ranking in Forbes JAPAN's "Inclusive
   Company Ranking 100" (covering 1,839 companies on the TSE Prime Market).
   “Employees" and "Earth" received high marks among the five evaluation categories.

                                             1         AJINOMOTO CO., INC.

                                                  Total Score                 Employees        Shareholder
                                            83.2                        85.5                77.7
Dialogue in North America
                                            Supplier/Community            Client/Consumer   Earth(Environment)

                                             82.8                       70.7                99.8
                                                                     Evaluation Points
                                           Employees:Improvement of employee engagement
                                           through unique measures for ASV as one's own initiative

                                           Earth:Efforts to balance sustainability
                                                                          and economic growth
Dialogue in GeneDesign, Inc.
                                             (reduction in GHGs, food loss, plastic waste, etc.)

                               Copyright © 2022 Ajinomoto Co., Inc. All rights reserved                          46
1 Summary Results for the First Half Ended
  September 30, 2022 and FY2022 Forecast
2 The Corporate Value Enhancement Cycle and
  Engagement
3 Medium-Term ASV Initiative
  for the 2030 Roadmap
III. Medium-Term ASV Initiative—Through Dialogue
I have had numerous conversations with many shareholders
since becoming president.

               Are you so focused on planning that
               execution becomes secondary?
               (Is it Plan-Plan-Plan-Plan instead of
               Plan-Do-Check-Act?)

           Are you overly focused on short-
           term figures, to the detriment of
                                                              Do area strategies incorporate
           medium- to long-term strategy?                     growing geopolitical risk?

                            Are employees motivated?
                            Do they work with a sense of
                            excitement?

       Valuable opinions and advice will be incorporated into
                    medium-term ASV Initiative.
                             Copyright © 2022 Ajinomoto Co., Inc. All rights reserved          48
III. Evolving from a Medium-Term Management Plan to Medium-Term
     ASV Initiative
We will break away from the traditional medium-term management plan disease that exhausted us with
making plans in an age where the future can’t be read, and evolve to medium-term ASV Initiative where
we decide on a path and take it.
                       Tradition medium-term management plans                           Medium-term ASV Initiative
                        Medium-term plans that last for 3 years,
          Term                                                               Backcasting from a long-term perspective
                          with forecasts for each fiscal year

                         Building up of short-term profits based        Senior management proposes ASV indicators and
      Planning basis       on extrapolating from the current            backcasts their achievement based on the desired
                                        situation                                             goal
                                                                        Devise a roadmap and arouse the desire to take on
                        Emphasize numbers and the formulation
         Actions                                                         challenges toward pursuing the crux of the real
                                  of a detailed plan
                                                                                  strategic goal and its assumptions
        Progress                                                        Variance analysis via monthly rolling forecasts and
                            Make forecasts for each quarter
       verification                                                                    creative additional actions

                            Introduction of ASV Indicators
                       We will disclose the strategic ASV targets for                                   Medium-term ASV Initiative
                                                                                                        explanatory meetings
                                realizing our vision for 2030
                                                                                                           For the media
                                       Roadmap to 2030                                                     Tues., February 28, 2023
           We are designing a roadmap that is challenging and exciting                                      For investors and analysts
                              Change in Management Style                                                    Wed., March 1, 2023

        We will stress action as we continue our pursuit of new value and
                    the transformation of our business model
                                         Copyright © 2022 Ajinomoto Co., Inc. All rights reserved                                        49
III. Medium-Term ASV Initiative, ASV Indicators
While pursuing the performance forecasts to which we have committed, we will continue striving toward
new value and the transformation of our business model and continue promoting medium-term ASV
Initiative to take on the challenge of ASV indicators.
         We assume that achieving this will involve some                                                Management’s
         uncertainties.                                                                                ASV indicators for
         ASV indicators = indicators that the                                                                2030
         Group will enthusiastically strive to
         achieve together

                                         Management’s ASV                                                          ASV
                                           indicators for                                                       indicators
                                              2025
                                                                                                   Economic value           Social value
         Management’s ASV
           indicators for                                                                             indicator              indicator
               2023

                                                       Pursuing ASV to the end                           Strengthen intangible
                                                                                                                assets
                                                       Everybody keeps working
                                                        to achieve ASV Indicators

        FY2022                                                                                                          Roadmap
        revised                                                                                                         Performance
       forecast                                                                                                         forecast

        FY22          FY23                   FY25                                                           FY30
                                        Copyright © 2022 Ajinomoto Co., Inc. All rights reserved                                       50
Message from the CEO

   We have worked on "Purpose x Passion x Operational Excellence (OE)"
     and "Speed Up x Scale Up," and have gotten achievements even in
                     these first half results for FY2022.

   To further evolve into a solution-providing group of companies for food
  and health issues, we will introduce medium-term ASV Initiative and aim
  to be an organization that pursues ASV to the end through the functions
                                    of amino acids.

       At the same time, signs of global recession are also apparent.
                          We will increase our speed,
              leverage the strengths of our business portfolio,
        and achieve sustained enhancement of our corporate value.

                      Copyright © 2022 Ajinomoto Co., Inc. All rights reserved   51
Forward-looking statements,     such as business performance forecasts, made in
                   本資料に記載されている業績見通し等の将来に関する記載は、
these materials are本資料の発表日現在における将来の見通し、計画のもととなる前提、
                     based on management's estimates, assumptions and
projections at the予測を含んで記載しており、当社としてその実現を約束する趣旨の
                   time of publication. A number of factors could cause actual
                   ものではありません。実際の業績は、今後様々な要因によって、
results to differ materially from expectations.
                   大きく異なる結果となる可能性があります。
This material includes   summary figures that have not been audited so the numbers
                   本資料には監査を受けていない概算値を含むため、数値が変更になる
may change.        可能性があります。
Amounts presented  本資料の金額は、切り捨てで表示しております。
                      in these materials are rounded down.
                 Copyright © 2022 Ajinomoto Co., Inc. All rights reserved
Examples of DX Initiatives: Supply Chain Management
                                                                          Ajinomoto Group Initiative
          Promote Group-wide SCM reform to construct a SCM that delivers products
                     at the lowest cost and with the highest efficiency
                — Even in an environment of COVID-19 and the Ukraine issue, we are providing products while
                                               enhancing asset efficiency
                                                                                Examples of major initiatives
            •    We are supplying stably and have enhanced asset efficiency by reducing the number of products. (SKUs)
            •    We are enhancing cooperation with sales and are contributing to inventory reduction and increased product freshness across the
                 supply chain by shortening the production cycle.
            •    We shortened manufacturing lead time and reduced in-process inventory in factories by synchronizing manufacturing and packaging.
            •    Using digital technology, we are making the production, sales, and inventory (PSI) of our global bases visual to prevent product
                 shortages and reduce inventories.
            •    Using digital technology, we are making distribution inventory (wholesale, mass retailer) visual to curb the occurrence of expired
                 products.

          Visualization of global PSI                                                                       Visualization of distribution inventory (wholesale, mass retailer)
                                                                                                            Secondary                                                           Inventory
                                                                                                                           Shipping data                                          days
                                                                                                              depot                            Our inventory
                      Received/Shipped/Inventory (MT)

                                                                                Yearly cumulative shipped

                                                          Actual                                                               Difference =
                                                                                                                               wholesale
                                                        inventory
                                                                                      inventory (MT)

                                                                                                                               inventory

                                                                                                                                                                    All inventory in
                                                                    Projected

                                                                                                                                                                      distribution
                                                                    inventory                               Wholesalers
                                                                                                                           Out-of-storage
                                                                                                                                                  Estimated
                                                                                                                                data
                                                                                                                                              wholesale inventory
Benchmark inventory
             基準在庫
                                                                                                                               Difference =
                                                                                                                               in-store
  Safe inventory
             安全在庫
                                                                                                                               inventory

                                                                                                                            Market data        Estimated in-
                                                                                                            Distribution                      store inventory                            商品A A Product
                                                                                                                                                                                        Product 商品B B Product
                                                                                                                                                                                                        商品C C Product
                                                                                                                                                                                                                商品D D Product
                                                                                                                                                                                                                        商品E E

                                                                    Copyright © 2022 Ajinomoto Co., Inc. All rights reserved                                                                                                    53
Examples of DX Initiatives: Smart Factory
 Promote automation
 Use varied data in advanced ways to promote factory automation. Aim for stable production and labor-saving improvements.

 AI-based image inspection: Removal of foreign matter                               Use of production data in factories: packaging processes
 from dried vegetables
O ve r vi e w      Shift from manual to automated removal of foreign              O ve r vi e w    Automated acquisition of data that used to
                   matter in dried vegetables                                                      be recorded by operators
                   Highly accurate determination and automated removal                             Real-time acquisition and utilization of high-
                   using AI technology                                                             resolution data
O b j e c t i ve   1. Reduce workload and address labor shortages
                   2. Improve foreign matter removal rate

Difficult using
conventional image                                                                           Cloud                     Manager               Manufacturing site
processing                                                                             Visualization of data     Discovery and remediation    Equipment information
                                                                                            collection                  of problems
                                 Non-defective products   Foreign matter
                                                                                             Feature 1                  Feature 2                   Feature 3
                                                                                        Automatically acquire         Manage via              Analyze visualized data
                                                                                          operational data         smartphone or tablet
Can be determined
with high accuracy
using AI
                                 AI-based determination
                                                                                                                       On-site app              Utilization of BI tools

                                                                                                                Resolution of factory issues
Automated removal                                                                                  ・Work-style innovation at production sites
using sorting
                                                                                                   ・Standardization and acceleration of management
equipment
                                 Foreign matter removal                                            ・Enhancement of productivity using data

                                                    Copyright © 2022 Ajinomoto Co., Inc. All rights reserved                                                              54
Summary as of the Second Quarter (July-September)
                                                                                                                    Profit attributable to owners
         Sales: Increased                                 Business profit: Increased                                  of the parent company

         ¥338.2 billion                                            ¥33.7 billion                                         ¥19.2 billion
      123.5% of FY2021 results                                111.2% of FY2021 results                               60.1% of FY2021 results
 Excluding currency translation: 111.4%                Excluding currency translation: 98.3%                    Decreased year-on-year due to the
                                                                                                                recording of profit on the sale of fixed
                                                                                                                assets (idle assets) within operating
  Revenue increased significantly overall            The depreciation of the yen made a major contribution;
                                                                                                                income for the same period of the
  due to higher revenue in all major                 with currency translation effects excluded, profit
                                                                                                                previous fiscal year
  segments.                                          decreased.
                                                     In Seasonings and Foods and Frozen Foods, while                  Excluding profit on the
                                                     revenue increased, profit fell due to soaring raw                 sale of fixed assets
                                                     materials, logistics, and personnel costs.
                                                                                                                     95.8% of FY2021 results
                                                     In Healthcare and Others, profit increased due to strong
                                                     performance in the Functional Materials business and
                                                     Bio-Pharma Services & Ingredients business.

              (¥ billion)            vs Q2-FY21                                         Details of impacts in Q2

     Change in GP due to                          Effect of increased revenue in Seasonings and Foods overseas, Functional Materials, Frozen Foods
                                          24.2 overseas, Bio-Pharma Services, etc.
     change in sales
     Change in GP due to change in
                                          -10.9
     GP margin
                                                  Marketing expenses were effectively used, but SGA expenses increased due to the impact of substantial
     Change in SGA expenses               -99.0 logistics cost and personnel cost increases.
     Share of profit of associates
                                            0.0
     and joint ventures

                                       Copyright © 2022 Ajinomoto Co., Inc. All rights reserved
                                                                                                                                                           55
First-Half Results (Consolidated Statements of Income)

                                                          H1-FY22      H1-FY21                        vs. Prev.       vs. Prev. year
                                                                                      Difference                   (excluding currency
                 (¥ Billion); -: losses                    Actual       Actual                          year
                                                                                     (A)-(B)                           translation)
                                                            (A)          (B)                           (A)/(B)            (A)/(B)
 Sales                                                        659.8         550.2          109.6           119%                109%
 Gross profit                                                 233.8         211.7           22.0           110%                    -
  (Gross profit margin)                                       35.4%         38.5%               -              -                   -
 Business profit                                                74.3          69.3           5.0           107%                 97%
 Other operating income & expenses                              -0.7          12.4         -13.1               -                   -
    Impairment losses                                           -0.4          -0.3          -0.0               -                   -
    Others                                                      -0.2          12.7         -13.0               -                   -
 Operating profit                                               73.6          81.7          -8.1            90%                    -
 Financial income & expenses                                    -5.4          -2.0          -3.4               -                   -
 Profit before income taxes                                     68.1          79.6         -11.5            85%                    -
 Income taxes (Tax rate: H1-FY22 actual 26.9%)                 -18.3         -21.9           3.6            83%                    -
 Profit (includes discontinued operations)                      49.8          57.7          -7.8            86%                    -
    Profit attributable to owners of the parent company         47.0          54.1          -7.1            86%                    -
    Profit attributable to non-controlling interests             2.8           3.5          -0.7            79%                    -

                                           Copyright © 2022 Ajinomoto Co., Inc. All rights reserved                                      56
First-Half Results (Sales and Business Profit by Segment)

                                     H1-FY22              H1-FY21
                                                                               Difference           vs Prev. year
        (¥ Billion); -: losses        Actual               Actual
                                                                                (A)-(B)                (A)/(B)
                                       (A)                  (B)
       Sales                                 659.8                 550.2                109.6                119%
          Seasonings and Foods               372.7                 316.0                 56.7                118%
          Frozen Foods                       128.5                 106.3                 22.2                120%
          Healthcare and Others              151.6                 121.9                 29.6                124%
          Other                                 6.8                  5.9                     0.9             115%
       Business Profit                         74.3                 69.3                     5.0             107%
          Seasonings and Foods                 43.0                 45.0                     -2.0              95%
          Frozen Foods                         -0.3                  1.0                     -1.3                   -
          Healthcare and Others                30.8                 22.8                     8.0             135%
          Other                                 0.7                  0.3                     0.4             228%

                                  Copyright © 2022 Ajinomoto Co., Inc. All rights reserved                              57
First-Half Results (Sales and Business Profit by Region; Change from Prev. Year)

                               Japan               Asia              Americas                    EMEA                 Other                      Total
  (¥ Billion); -: losses    H1-                 H1-                 H1-                        H1-                 H1-                        H1-
                                     Differ-             Differ-                Differ-                 Differ-                Differ-                    Differ-
                           FY22                FY22                FY22                       FY22                FY22                       FY22
                                     ence                ence                   ence                    ence                   ence                       ence
                           Actual              Actual              Actual                     Actual              Actual                     Actual
 Sales                      244.3       10.0    173.5       36.7    172.9          47.7         69.0       15.1            -             -    659.8        109.6
   Seasonings and
   Foods
                            126.6       -0.6    166.3       35.1     54.8          15.2         24.9        7.0            -             -    372.7          56.7

   Frozen Foods              45.2        0.2      2.5        1.1     73.9          19.5          6.8        1.2            -             -    128.5          22.2
   Healthcare and
   Others
                             65.5        9.3      4.6        0.5     44.1          12.9         37.2        6.8            -             -    151.6          29.6

   Other                      6.8        0.9      0.0       -0.0            -             -      0.0        0.0            -             -      6.8           0.9

 Business Profit             30.9        2.3     26.7       -1.1     10.2           2.1          6.3        1.7            -             -     74.3           5.0
   Seasonings and
                             13.2       -3.0     28.1       -1.7      7.9           2.8          3.3        1.3      -9.7         -1.4         43.0          -2.0
   Foods

   Frozen Foods               1.7       -0.9      1.4        0.8      -0.3         -0.7          -0.1      -0.3      -2.9         -0.2          -0.3         -1.3
   Healthcare and
                             20.9        6.3      2.4        0.5      6.8           0.8          4.6        1.0      -3.9         -0.8         30.8           8.0
   Others

   Other                      1.2        0.2      -0.0      -0.0            -             -      0.1        0.0      -0.5          0.2          0.7           0.4
   Shared companywide
   expenses
                              -6.2      -0.3      -5.1      -0.7      -4.1         -0.8          -1.5      -0.2     17.1           2.2                -             -

                                          Copyright © 2022 Ajinomoto Co., Inc. All rights reserved                                                                      58
Addressing Inflation
In Seasonings and Foods and Frozen Foods, successive measures are being taken to
counteract the ongoing impact of increased costs, such as for raw materials.
                                                                                                                            第3四半期以降
                                                                              (Price actions in major countries of business: only executed and announced actions)

                                                                                             FY2022
                                                 Q2                                                                                     From Q3
                                    Flavor seasonings                          July-August                          Menu-specific seasonings      October
                Thailand                                                                            Thailand
                                    Umami seasonings                           August                               Cooking sauce                 October

                Indonesia           Umami seasonings                           July                                 Flavor seasonings             October
                                                                                                    Indonesia
                                                                                                                    Menu-specific seasonings      October
                                    Menu-specific seasonings                   July
                                    Cooking sauce                              August and                           Umami seasonings              October
  Sauce &       Vietnam
                                                                               September                            Flavor seasonings             October
 Seasonings                                                                                         Philippines
                                    Umami seasonings                           September                            Menu-specific seasonings      October-December
                                                                                                                    Cooking sauce                 October-November
                                    Menu-specific seasonings and cooking July
                                    sauce                                                                           Salt, flavor seasonings,      October
                Philippines
                                    Umami seasonings                           August                               mayonnaise
                                                                                                    Japan
                Also raised prices in eight other countries and areas                                               Umami seasonings              January 2023

                Thailand            Instant noodles                            September

    Quick       Brazil              Powdered drink                             September                            Some stick-type products
                                                                                                    Japan                                         October
 Nourishment    Japan               Some stick-type products (coffee, etc.)    September                            (coffee, etc.)

                Also raised prices in five other countries and areas

                                    Home use                                   August
                Japan
                                    Restaurant use                             September

 Frozen Foods   North America       Restaurant use                             September            North America   Home use                      October-November

                                    Home use                                   July
                Europe
                                    Restaurant use                             September

                                                          Copyright © 2022 Ajinomoto Co., Inc. All rights reserved                                                   59
Forecast (Consolidated Statements of Income)

                                                             FY22                                                           vs. Prev. year
                                                                             FY21
                                                           Revised                          Difference    vs. Prev. year (excluding currency
                (¥ Billion); -: losses                                       Actual
                                                           forecast                          (A)-(B)          (A)/(B)        translation)
                                                                              (B)                                               (A)/(B)
                                                              (A)
Sales                                                         1,367.0          1,149.3            217.6           118%               109%
Business profit                                                 133.0            120.9             12.0           110%               100%
Other operating income & expenses                                 -4.0             3.6             -7.6               -
Operating profit                                                129.0            124.5              4.4           103%
Financial income & expenses                                       -7.0            -2.1             -4.9               -
Profit before income taxes                                      122.0            122.4             -0.4            99%
Income taxes (Tax rate: FY22 forecast 27.0%)                     -33.0           -42.2              9.2               -
Profit (includes discontinued operations)                         89.0            80.2              8.7           110%
   Profit attributable to owners of the parent company            83.0            75.7              7.2           109%
   Profit attributable to non-controlling interests                6.0             4.5              1.4           133%

                                              Copyright © 2022 Ajinomoto Co., Inc. All rights reserved                                         60
You can also read