Foreign Direct Investment in the North-West - The role of Sligo John Nugent Regional Manager, Border
←
→
Page content transcription
If your browser does not render page correctly, please read the page content below
Foreign Direct Investment in the
North-West – The role of Sligo

John Nugent
Regional Manager, Border
Appendices
Updates and Outlook
Based on performance for first 3 years of the strategy, IDA
expects to exceed Investment and Job creation targets set for
Winning FDI Strategy 2015–2019, but, significant down-side risks
exist …
Business Environment remains very competitive for FDI
There are significant International developments, the precise
impacts of which are not yet known
Maintaining the competitiveness of the Irish economy remains key;
Residential Housing – Availability & Cost
Infrastructure Investment
Income Tax levels at higher marginal rate
Industrial Relations Activity
In the short to medium term, technological developments likely to
have a significant impact on future of work and employment
across all sectors
Irishman (person) of the 20th century

              T K Whitaker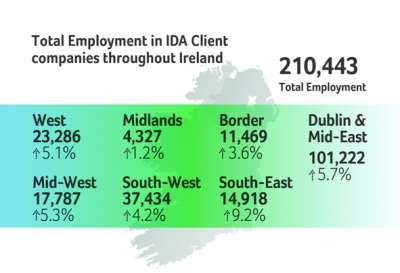

IDA Ireland – Services for the Investment Journey

   Awareness         Engagement        Investor         Decision
   (Consideration)   (Short-listing)   Evaluation       (Validating)   Implementation   After-Care
                                       (Comparing)

  Introductions to Peer                Design and Hosting of tailored      Funding Programmes &
  Companies                            Fact-Finding Site Visits            Incentives
  Access to Government System          Information Gathering,              Public Relations & Media
  Introductions to Industry            Analysis and Evaluation             Support
  Associations                         RFIs (Requests for Information)     Employment Permits & Visas
  Collaboration With 3rd Level                                             Property Solutions
  Institutions
MNCs make significant contribution to Irish Economy

IDA clients
  Account for 10.2% of total employment in Ireland.
  58% of employment is outside of Dublin
  Spent €17.9bn in Irish Economy in 2016 on payroll
  and Irish sourced materials and services.
  Invest €5bn in capex annually, half outside of
  Dublin.
  Invest €1.6bn in house R&D
  Account for over 70% of national exports and 80%*
  of Irish corporation tax.

                                                          7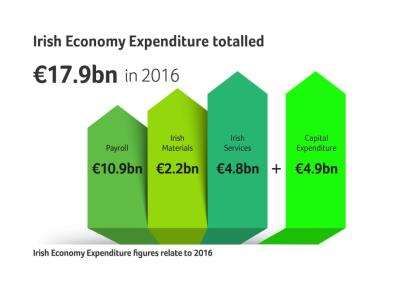
Ireland is the Fastest Growing Economy in Eurozone

    5%+ GDP growth for 4 straight years                    GDP at constant market prices (€m)
                                                   350,000
                                                   300,000
    Fastest growing economy in Eurozone in 2017    250,000
    for 4th year in row.                           200,000
                                                   150,000
                                                   100,000
    National and International forecasts expect     50,000
    strong growth to continue in 2018 and 2019.          0

    Broad based sectoral growth, particularly
                                                                     GDP      Forecast GDP
    manufacturing where PMI hit record high in
    Dec 2017; services, retail sales and
                                                    GDP Forecasts (%)                2017 2018 2019
    construction also growing strongly.
                                                    European Commission               4.8    3.9   3.1
    Consistently strong consumer sentiment and      Irish Department of Finance       4.3    3.5   3.2
    spending – personal debt at its lowest level    Central Bank of Ireland           4.9    3.9   n/a
    since 2005.
                                                    IMF                               4.1    3.4   n/a
                                                    OECD                              3.6    2.7   2.2
*CSO Quarterly National Accounts, December 2017.
                                                    ESRI                              5.0    4.2   n/a

                                                                                                         8
Ireland is the Fastest Growing Economy in Eurozone
5%+ GDP growth for 4 straight years Ireland Manufacturing & Services
Purchasing Managers Index (PMI)
70
Fastest growing economy in Eurozone in 2017
60
for 4th year in row.
50
40
National and International forecasts expect
strong growth to continue in 2018 and 2019.
Irish manufacturing irish Services
Broad based sectoral growth, particularly
manufacturing where PMI hit record high in Consumer Confidence
Dec 2017; services, retail sales and (ESRI - KBC)
construction also growing strongly.
120
100
Consistently strong consumer sentiment and 80
spending – personal debt at its lowest level 60
since 2005.
40
*CSO Quarterly National Accounts, December 2017.Ireland: “A” grade from all major credit rating agencies
Date of Last
Ratings Agency Long-Term Short- Term Outlook/Trend
Change
Standards & Poor's A+ A-1 Stable Jun-15
Fitch Ratings A+ F1 Stable Dec-17
Moody's A2 P-1 Stable Sep-17
DBRS A (high) R-1 (middle) Stable Mar-16
R&I A a-1 Stable Jan-17Over 2 million people at work in Ireland
+ Strong employment growth: 2.06 million Labour Market
16 2100
people now at work in Ireland.
14 2050
+ For every 10 jobs lost in recession, 7 have
been replaced 12 2000
Unemployment Rate
Numbers Employed
+ IDA clients created 1 in every 4 additional 10 1950
jobs in Ireland since 2012. 8 1900
+ Unemployment rate 6.1% in November 6 1850
2017; halving in 4 years. 4 1800
+ Long term unemployment rate low at 3.1%. 2 1750
+ Ireland’s unemployment rate below EU 0 1700
(7.4%) and Eurozone (8.8%) average. Q2 Q2 Q2 Q2 Q2 Q2 Q2
11 12 13 14 15 16 17
Unemployment rate % In employmentLabour Market Outlook
+ Room for labour force increases: 2007 2017
Labour force participation Labour force
64% 60%
Part-time working participation
Net migration
Part-time work 384,200 432,200
+ Almost 300,000 Irish people emigrated
during the recent economic recession Net migration +104,800 +19,800
+ 2016 & 2017 saw a return to net inward
migration to Ireland for the first time
since 2009 as employment opportunities
increase.International Workforce
Proportionally Ireland has the 3rd highest International Workforce %
international workforce in Europe. Today, 15% of Luxembourg
Ireland’s workforce is international Cyprus
Ireland
Austria
Ireland’s diverse population contributes to the Estonia
Latvia
enhanced language skills availability Belgium
Spain
13% of Irish population speak a foreign language at Italy
UK
home Germany
Euro area
Denmark
EU
Language Total Language Total Greece
Sweden
France
Polish 135,895 German 28,331 Malta
Netherlands
Slovenia
French 54,948 Russian 21,707 Finland
Portugal
Czech Republic
Romanian 26,645 Portuguese 16,737 Hungary
Slovakia
Poland
Lithuanian 30,502 Chinese 17,584 0% 20% 40%
Spanish 32,405 Arabic 16,072 European InternationalWages rising slowly (2% annually), but disparity in some sectors
€60,000 4% 4% 5%
4% 4%
€50,000 3%
3% 3% 3% 3%
2% 2% 3%
2% 2%
€40,000 2%
2%
€30,000 1%
0%
€20,000
-2% -1%
€10,000
-2%
€0 -3%
Average Annual Earnings Q3 2017 Annual Wage Growth 2017Irish labour costs mid range in Europe
+ Irish hourly labour costs are mid range in Labour cost € per hour
Denmark
Europe; below the Eurozone average but Belgium
Sweden
above the EU average. Luxembourg
France
Finland
Netherlands
Germany
+ Irish labour costs are 11th in the EU, below Austria
Euro area 29.5
United Kingdom
countries like the UK, Germany, Belgium, Ireland 28.7
Italy
Luxemburg and the Netherlands. European Union
Spain
25.6
Slovenia
Cyprus
Greece
Portugal
Malta
Estonia
Slovakia
Czech Republic
Croatia
Poland
Hungary
Latvia
Lithuania
Romania
Bulgaria
0 10 20 30 40 50Growth in Labour Costs Relatively Subdued
Labour Costs
+ Irish labour costs have remained % Growth 2012 - 2016
relatively stable since 2012, Greece
Croatia
increasing by just 4% in total, this Cyprus
Spain
Portugal
compares to a 6.6% increase in the Italy
Belgium
EU. Ireland 4
France
Slovenia
Netherlands
Euro area 5.4
Finland
+ Labour costs like to increase EU 6.6
Denmark
moderately in coming years. Budget United Kingdom
Luxembourg
2018 forecasts average annual wage Germany
Malta
Austria
growth of 3% - 5% for the period Norway
Czech Republic
2017 – 2021. Sweden
Slovakia
Hungary
Poland
Estonia
Lithuania
Romania
Latvia
Bulgaria
-15 -5 5 15 25Knowledge and Talent Ireland is the only English speaking country in the Eurozone. Education system ranked in the top 10 in the world. 98% participation rate in education amongst 18 year olds – Highest in Europe. 53% aged 30-34 have successfully completed third level studies (EU average 39%). Irish IT specialists best educated in EU; 82% have third level qualification (EU average 62%). Ireland has the fastest-growing tech worker population in Europe for 2017, with the expectation that impacts of the Brexit vote will see that figure grow further.* New International Baccalaureate School being established in Dublin. Youngest Population in the EU: 33% under 25 (EU 28: 26.8%). 7th lowest old-age dependency ratio in OECD (18.6%). Compared to 31.3% in Germany, and 29% in Eurozone as a whole. The IMD Competitiveness Yearbook 2017 ranks Ireland globally as: 1st for attracting and retaining talent. 5th for availability of skilled labour. 6th for financial skills.
Ireland is Europe's Most Productive Economy

 + Irish labour productivity i.e. the amount                                                         Labour Productivity
   of GDP produced by each unit worker in                                             Ireland                                      178.3
                                                                                Luxembourg
   the economy is 78% above the EU28                                                Belgium
                                                                                   Denmark
   average.                                                                     Netherlands
                                                                                   Germany
                                                                                      France
                                                                                      Austria
 + IMD Competitiveness Yearbook 2017                                                Sweden
                                                                    Euro area (19 countries)                         111.3
   ranks Ireland 1st for labour productivity.                                        Finland
                                                                                         Italy
                                                                           EU (28 countries)                     100
                                                                            United Kingdom
                                                                                        Spain
                                                                                    Slovenia
                                                                                    Slovakia
                                                                                      Cyprus
                                                                                        Malta
                                                                             Czech Republic
                                                                                    Portugal
                                                                                      Greece
                                                                                    Hungary
                                                                                     Croatia
                                                                                     Estonia
                                                                                   Lithuania
                                                                                      Poland
                                                                                   Romania
                                                                                        Latvia
                                                                                    Bulgaria
Source: Eurostat 2016, Labour productivity measures the amount of
GDP produced by one person in one hour.                                                          0     50      100           150    200
Strong Commercial Office Availability
2017 was a record year for the Dublin office market with 26 Dublin office blocks
total take-up of 331,445 sq. m. demolished and replaced
since 2014 – new
properties are on average
Total of 237 transactions completed over the course of 36.4% bigger than the
year. buildings they replaced*
+ 35 office schemes of more than 400,000 sq. m. under
construction at the end of Q4 2017.
+ Interim space being offered by serviced office providers.
+ Prime City Centre Rents: €65 per sq. ft. (€700 per sq. m.)Prime Office Rents in Dublin – Global Comparison
Prime Office Rents per sq. ft per annum (US$)
0 50 100 150 200 250 300 350
Hong Kong (Central)
New York (Midtown)
London (West End)
Beijing (Finance St)
Silicon Valley
Shenzhen
Tokyo (Marunouchi)
Shanghai (Pudong)
San Francisco
Boston
Mumbai
New York (FiDi)
Dubai (DIFC)
Stockholm
Seoul
Paris (City)
Singapore
Zurich
LA (Westside)
Geneva
Sydney
Chicago
Dublin $72
Toronto
Istanbul
Milan
MadridSuburban Dublin Rents Prime Suburban Rents – within 30 minutes of Dublin City: €17.50 -€28.50 sq. ft. (€188.30-€306.66 per sq. m.) Suburbs accounted for 25% of leasing activity in Dublin in Q4 2017. Prime headline office rents in Dublin (Q4 2017) City Centre €700 per sq m /65 sq ft South Suburbs €306.66 per sq m /28.50 sq ft North Suburbs €200.00 per sq m /18.50 sq ft West Suburbs €188.30 per sq m /17.50 sq ft
Significant Value in Regional Locations

Excellent rental value in locations outside Dublin: €5-€32 per sq. ft. (€54-€345 per
sq. m.).
                                               Office Rents per sq ft Industrial Rents per
 Location
                                                    per annum           sq ft per annum
 Cork City                                           €28 - €32               €5 - €8
 Cork Suburbs                                        €14 - €18               €5 - €8
 Galway City                                         €20 - €28               €5 - €8
 Galway Suburbs                                      €15 - €18               €5 - €8
 Limerick City                                       €28 - €32               €3 - €7
 Limerick Suburbs                                    €18 - €20               €3 - €7
 Waterford*                                          €12 - €15               €4 - €8
 Sligo*                                               €5 - €10               €3 - €7
 Athlone*                                            €10 - €18               €4 - €8
 Dundalk*                                            €15 - €17               €3 - €7
                      On a case by case basis commercials on each option are subject to negotiation, strength of covenant and length of lease
Residential Property Strategy
Increasing housing supply is a key priority area for the Irish
Actions to date include:
Government.
Annual rent increases capped
Under investment in housing during the recession – and at 4% in 21 areas classified as
the rapid recovery – has led to rental price increases and Rent Pressure Zones
an undersupply of homes for purchase.
Fast track planning for large
The Government’s Rebuilding Ireland action plan is housing developments (100
targeting a doubling of output to deliver 25,000 units per units or more)
annum on average by 2020.
Updated draft guidelines for
planning authorities on
Budget 2018 allocated €1.9 billion to the housing
apartment development
programme for 2018 – a 46% increase on 2017.
€200m+ Local Infrastructure
Newly established Home Building Finance Ireland agency Housing Activation Fund
to provide €750m in financing to eligible residential (LIHAF)
property developers.Housing Progress
Completions
Indicators show strong growth in house (Monthly ESB connections)
2,500
building activity.
2,000
Completions were higher in every month of
1,500
2017 compared to the same month in the
previous two years.
1,000
The pipeline of new houses is strong with 500
starts on new residential builds up 33% in
2017. 0
Planning permissions for additional new
house builds up 15% in 2017 (Q1 - Q3)
2015 2016 2017
Source: Department of Housing, January 2018;
CSO, December 2017International Perspective & Regional Opportunity
Monthly Rent (€) - 1 person
Housing challenges not unique to Ireland. apartment
San Francisco
New York
Rent prices in regional locations in Ireland are Hong Kong
London
very competitive. Geneva
Los Angeles
Singapore
Zurich
Dubai
Stanardised Average Rent Q3 2017 (€) Paris
Amsterdam
Dublin
Dublin City Oslo
Galway City Munich
Vienna
Cork City Stockholm
Frankfurt
Limerick City Milan
Copenhagen
Tralee Barcelona
Helsinki
Athlone Vancouver
Sligo Edinburgh
Rome
Letterkenny Rotterdam
Madrid
Waterford City Berlin
Toronto
- 200 400 600 800 1,000 1,200 1,400 1,600
- 500 1,000 1,500 2,000 2,500
Source: ESRI, November 2017; Residential Tenancies Board Rent Index Q3 2017;
Nestpick 2017 Furnished Apartment Index - listings for one-bedroom furnished apartments with an area between 39m2 and 45m2International Environment
Brexit Overview

Irish Focus                                                           January 2018
   Minimising impact on trade and the economy                       Transition talks
   Protecting the Northern Ireland Peace Process
   Maintaining the Common Travel Area
   Influencing the future of the European Union.
                                                                       March 2018

EU Focus                                                         Future relations talks
  Protecting the Single Market and the 4 freedoms
  Continuing unity of the EU 27
  Parallel discussions on the future of the EU post-Brexit            October 2018
                                                                  Ratification process
UK Focus
 Reaching early agreement on transition arrangements
 Pursuing an unprecedentedly comprehensive FTA with the EU             March 2019
 Mindful of domestic political considerations                     UK withdrawal date

Phase 1: “Sufficient Progress” achieved on:
  UK financial settlement                                            December 2020
  Rights of EU nationals in Britain and vice versa           Possible end of transition period
  Northern Ireland border issue
Substantial Brexit-related Investments
Brexit further underlines the advantages of Ireland as a
destination for FDI, including English language,
commitment to the EU and common law system.
Ireland won a substantial number of Brexit-related
investments in 2017 from leading companies including:
• Bank of America • alterDomus
• Barclays • Fundrock
• JP Morgan • Chaucer
• S&P Global • Kabbage
• Legal & General • Willis Towers Watson
• Pinsent Masons • Bank of China
• Northern Trust • Beazley Re
• Citadel • Wasdell Group
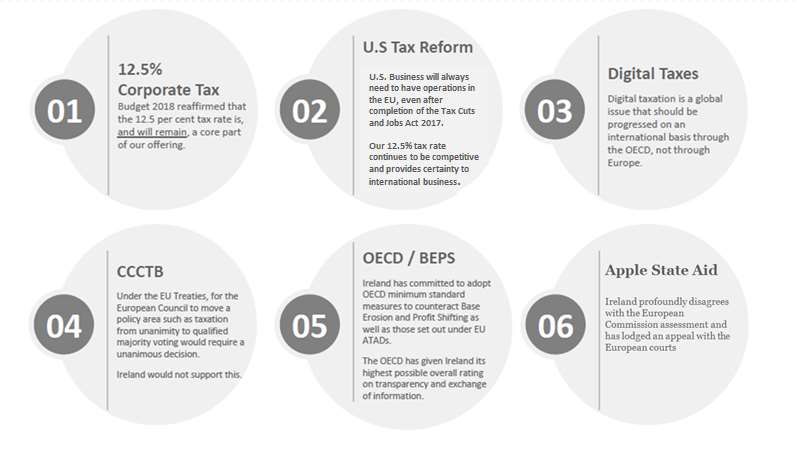
• TobamInternational Tax Environment
Top International Ratings for Ireland

Ireland’s key assets are our people:
+   1st in the World for flexibility & adaptability of workforce1
+   1st in the World for a national culture that is open to foreign ideas1
+   1st in the World for availability of finance skills1
+   2nd in the World for attitudes toward globalization1
+   3rd most productive workforce in the world1

We consistently rank amongst the best countries in the World to invest and do business in
+   Best Country in Western Europe to invest in 2016 3
+   1st in EU for ease in starting a business4
+   4th best country in the world to do business in 20165
+   1st in the World for inward investment by quality and value2
+   1st in the EU and 6th in the world for the ease with which business can pay its taxes4
You can also read