FTIR, Raman and XRD analysis of graphene oxide films prepared by modified Hummers method
←
→
Page content transcription
If your browser does not render page correctly, please read the page content below

Journal of Physics: Conference Series

PAPER • OPEN ACCESS

FTIR, Raman and XRD analysis of graphene oxide films prepared by
modified Hummers method
To cite this article: G Surekha et al 2020 J. Phys.: Conf. Ser. 1495 012012

View the article online for updates and enhancements.

                                This content was downloaded from IP address 176.9.8.24 on 25/06/2020 at 02:10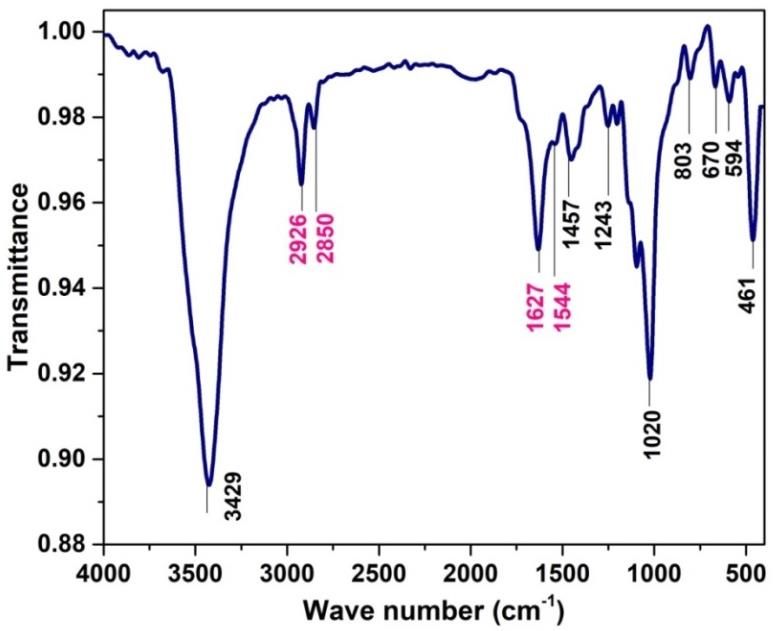
International Conference on Multifunctional Materials (ICMM-2019)                                               IOP Publishing
Journal of Physics: Conference Series            1495 (2020) 012012                       doi:10.1088/1742-6596/1495/1/012012

FTIR, Raman and XRD analysis of graphene oxide films
prepared by modified Hummers method

                      G Surekha1,2, K Venkata Krishnaiah2,*, N Ravi 2,*and R Padma Suvarna1
                      1
                        Department of Physics, Jawaharlal Nehru Technological University, Anantapuramu,
                      AP, 515002, India.
                      2
                        Department of Physics, Rajeev Gandhi Memorial College of Engineering &
                      Technology, Nandyal, AP, 518501, India.
                      Corresponding author’s e-mails: kvkphd8@gmail.com, ravi2728@gmail.com

                      Abstract-Graphene oxide (GO) is a promising material for energy storage device applications.
                      Modified Hummers method (MHM) has been used to prepare GO films from graphite flakes
                      by Sol-Gel method. With the aid of bridging agent dimethyldichlorosiline, structurally fine GO
                      films were prepared. Fourier transform and infra-red (FTIR) spectrum of the GO thin film
                      possesses absorption bands at 461, 594, 670, 803, 1020, 1243, 1457, 1544, 1627, 2850, 2926
                      and 3429 cm-1. A sharp OH- absorption band was revealed at 3429 cm-1. Two vibrational bands
                      were noticed in the Raman spectrum for pure graphite flakes at 1578 and 2718 cm-1. However,
                      for GO, five Raman vibrational bands were unveiled at 413, 1344, 1597, 2697 and 2945 cm -1.
                      Among these bands, the mode at 1344 cm-1 was assigned to D-band and 1597 cm-1 was
                      assigned to G-band. Compared to D-band, G-band was dominated for the GO films. Several
                      times of centrifugation and ultra-sonication process have aided to obtain more intensity of G-
                      band. In addition, 2D and D + G bands were also revealed in the GO films. X-ray diffraction
                      (XRD) analysis was confirmed that a sharp peak at 10.64 degrees leads to the formation of GO
                      thin film.

                     Keywords: Graphene oxide films, Modified Hummer’s method, Structural properties

1. Introduction
Carbon based materials are suitable for energy storage devices like batteries [1], super capacitors [2],
mechanically useful materials such as composites [3], paper like materials [4], conductive ink [5] and
electrochemical systems like nano-electro-mechanical systems/micro-electro-mechanical system
(NEMS/MEMS) [6] etc. Among these, research on graphene plays a crucial role for battery
applications. Now-a-days researchers focus on sodium ion batteries (SIBs) because of abundance of
sodium in earth crust and cost effective compared to lithium. In SIBs, the transition metal doped
graphene layer releases sodium ions for energy storage applications [7].
The GO film consists of sp2 hybridized two-dimensional (2D) monolayer carbon atoms tightly packed
by forming a honeycomb-like structure which derived from 3D graphite [9]. GO has unique physical
properties, good mechanical flexibility, large specific surface area, higher thermal/chemical stability
and excellent electrical conductivity [10]. GO is an atomic sheet of graphite decorated by several
oxygenated functional groups on its basal planes and its edges, resulting in a hybrid structure
comprising a combination of sp2 and sp3 hybridized carbon atoms [11].

              Content from this work may be used under the terms of the Creative Commons Attribution 3.0 licence. Any further distribution
              of this work must maintain attribution to the author(s) and the title of the work, journal citation and DOI.
Published under licence by IOP Publishing Ltd                          1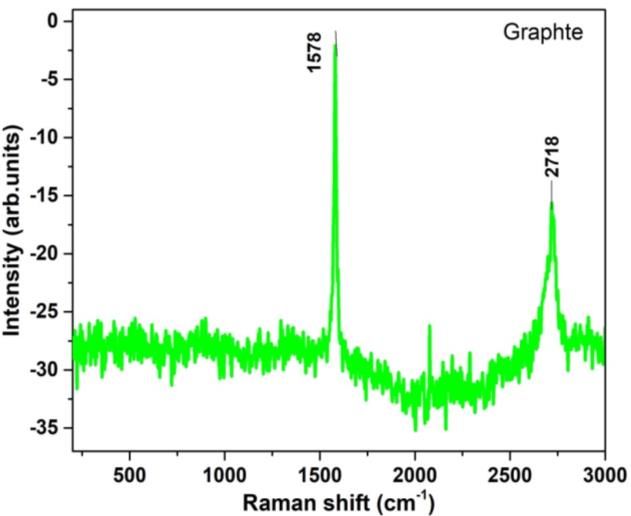
International Conference on Multifunctional Materials (ICMM-2019)                           IOP Publishing
Journal of Physics: Conference Series            1495 (2020) 012012   doi:10.1088/1742-6596/1495/1/012012

   Graphene can be synthesized by two different types of approaches: top-down and bottom-up. In
top-down approach, the separation of the stacked layers of graphite occurs and yields into a single
graphene sheet, whereas in bottom-up method, graphene is synthesized from alternative carbon
containing sources [12]. In top down approach, chemical reduction is a reliable method to produce
Graphene. In general, GO has been synthesized using modified Hummer‘s method [MHM] [13]. In
the present work, synthesis and structural characterization of GO is discussed. Purified graphite flakes,
sulfuric acid, sodium nitrate and potassium permanganate are mixed in a sequence followed by
addition of deioninsed water (DIW) and forms a graphite solution. The resultant solution was filtered
and washed with 10% HCl. After obtaining a brown color solution, decanted the supernatant and the
precipitate was dried in an oven. The obtained GO film was characterized by FTIR, Raman and XRD
analysis.

2. Experimental procedure
2.1. Chemicals and materials
Graphite flakes (natural, −325 mesh) with a purity of 99.8% was purchased from Sigma-Aldrich,
sodium nitrate (NaNO3) with a purity of 98+ % purchased from Alfa Aesar, ACS sulfuric acid
(H2SO4) with a purity of 98%, EMPLURA potassium permanganate (KMnO4) with a purity of
98.5%, qualikem hydroflouric acid (HF) with a purity of 40%, EMPARTA hydrogen peroxide (H2O2)
with a purity of 30%, fisher scientific hydrochloric acid (HCl) with a purity of 35-37%, acetone,
deionized water (DIW) and distilled water.

2.2. Synthesis of GO films
2.2.1. Purification of graphite flakes
25 ml of HF acid was taken in a plastic beaker. For which a 2 g of graphite flakes (GF) was added to
HF. Then mechanical stirring was performed for one hour at 35 oC with 600 rpm. Sufficient time was
given to settle down the GF in HF. This process is known to be sedimentation. After sedimentation to
decant the HF, some quantity of distilled water was added to wash off the acid content in the GF. The
same procedure was continued until the pH of the solution becomes neutral [7]. Then some DIW was
added to perform ultrasonication for 30 min for proper mixing of GF with DIW. The solution was left
in one day to settle down the graphite flakes in DIW to decant the water. Then the obtained residue
was added to a small amount of acetone was added to obtain a residual solution and it was dried in an
oven at around 100 OC for 20 min.

2.2.2. Synthesis of GO by using MHM
2 g of pure graphite flakes, 1 g of NaNO3 and 45 ml of sulfuric acid were reserved in a 500 ml conical
flask. The conical flask was kept in an ice-bath with stirring continuously for 30 min by monitoring
the temperature not exceeding 15 oC. After obtaining a homogenized mixture, 6 g of KMnO4 was
added to the mixture. Later, when the ice-bath was removed, the temperature gradually increases in the
mixture. This was maintained for 30 min until the mixture starts to thicken and become a dark green
paste. Later 80 ml of DIW was added slowly while stirring. At the same time violet effervescence and
a rapid increase of temperature were observed. The mixture was stirred for 30 min at 90 oC with the
aid of a hot plate. 200 ml of DIW was added again to dilute the solution. When 3 ml of H2O2 is added
then the color of the solution was changed to luminous yellow. The formation of yellow color
indicates that the graphite oxide was formed and the brown color layer was formed at the top of the
solution. The mixture was centrifuged and washed with 100 ml of 10% HCl for several times to
remove the metal ions present in the solution. This solution was centrifuged for 20 min at 4000 rpm to
discard supernatant. This procedure was repeated several times until the pH reaches to neutral [7]. The
obtained graphite solution was exfoliated to GO by using ultra sonication. Finally, GO solution was
poured in a petri dish at 50oC and maintained the same temperature for 24 h. In order to avoid
humidity, the GO film was stored in a vacuum desiccator.

                                                     2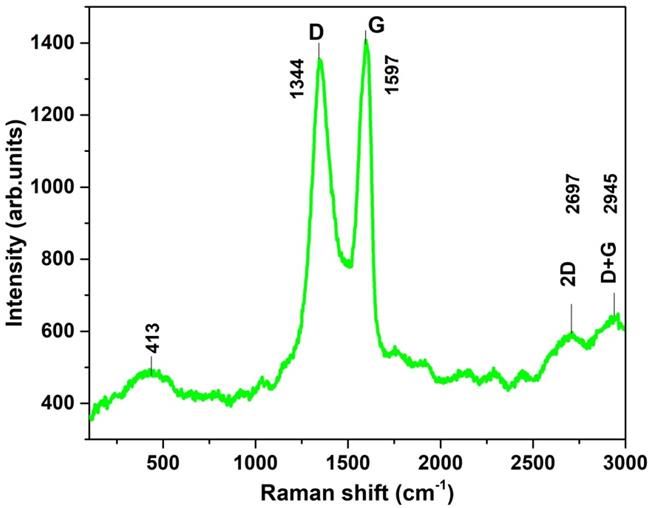
International Conference on Multifunctional Materials (ICMM-2019)                           IOP Publishing
Journal of Physics: Conference Series            1495 (2020) 012012   doi:10.1088/1742-6596/1495/1/012012

2.3.Results and Discussions
2.3.1.FTIR spectra
FTIR spectrum of GO layer is shown in Fig.1. The spectrum consists of vibrational groups of GO
layer that includes carbonyl (C = O), aromatic (C = C), carboxyl –(COOH), epoxy (C-O-C) and
hydroxyl (O-H) groups are prescribed in Table 1. It is observed that a sharp peak at 3429 cm-1
corresponds to the carboxyl groups (O-H) due to the water molecules, and the absorption peaks at
2926 cm-1 and 2850 cm-1 represents the asymmetric and symmetric stretching vibrations of CH2 bonds
[14]. The peak at 1627 cm-1 is due to ketone group (C=O) and the main graphitic domain of the peak
at 1544 cm-1 is due to sp2 hybridization [15]. This similar peak was also observed in Raman spectrum.
The band at 1457 cm-1 reveals the C-O, 1243 cm-1 indicates about the C - O stretching of epoxy
groups. The mode at 1020 cm-1 gives information about C - O - C stretching of alkoxy groups [16].
The absorption peak at 803 cm-1 belongs to aromatic C - H deformation [17]. Spikes at 670, 594 and
461 cm-1 arises from C-H bending vibrations [18].

             Table 1. Characteristic vibrational modes and their energies of GO
                       Wave number (cm-1)          Functional group       Ref.
                                   3429                    -OH              [14]
                                   2926                    CH2              [14]
                                   2850                    CH2              [14]
                                   1627                    C=O              [15]
                                   1544                    C=C              [15]
                                   1457                    C-O              [16]
                                   1243                    C–O-C            [16]
                                   1020                    COOH             [16]
                                    803                    C–H              [17]
                                    670                    C–H              [17]
                                    594                    C–H              [17]
                                    461                    C–H              [17]

                         Fig. 1. FTIR spectrum of GO films prepared by MHM

                                                     3
International Conference on Multifunctional Materials (ICMM-2019) IOP Publishing
Journal of Physics: Conference Series 1495 (2020) 012012 doi:10.1088/1742-6596/1495/1/012012
2.3.2.Raman analysis of graphite and GO
Raman spectrum of GF contains bands marked as G and 2D bands are as shown in Fig. 2 (a). These
two highest intense peaks are the G peak at about 1578 cm -1 and the 2D peak at about 2718 cm -1.
Among these the former one is the aforementioned G band, the only allowed first order Raman band.
The G band is prominent for sp2 carbon networks. The second band is the result of a higher order
process involving two phonons, and is known as 2D band.
In the Raman spectrum of GO layer contains bands marked as D, G and 2D bands. The Raman
spectrum of GO is shown in Fig. 2 (b). The first-order D and G peaks are arising from the vibrations of
sp2 carbon appeared at around 1344 cm-1and 1597 cm-1, respectively. The D-band reveals that
disorders of crystalline materials and defects associated with vacancies and grains [18]. It is noticed
that the shape and the position of D peak shifts as the thickness of GO changes. In fact, a blue shift is
observed to decrease of the thickness of GO. The shift and shape of the overtone of the D peak, called
as 2D peak around 2697 cm-1, correlated to the set of graphene layers. The G peak corresponds to the
optical E2g phonons at the Brillouin zone center resulting from the bond stretching of, sp2 carbon pairs
in both rings and chains [19].
(a) (b)
Fig. 2. Raman spectra of (a) GF and (b) GO film
2.3.3. XRD analysis of GO
Fig. 3. X ray diffraction spectrum of GO
4International Conference on Multifunctional Materials (ICMM-2019) IOP Publishing
Journal of Physics: Conference Series 1495 (2020) 012012 doi:10.1088/1742-6596/1495/1/012012
A diffraction peak of GO was observed at 10.64o corresponding to an interlayer spacing (d) of
0.817 nm with indices (001) as shown in Fig. 3. One more broad diffraction peak was observed at
26.3o corresponding to an interlayer spacing of about 0.34 nm with an indices of (002) [20]. The main
peak (002) of graphite is vanished totally in case of dried GO [21]. This peak was broader and very
lower in intensity than the natural graphite and represents the graphene with reduced layers.
3. Conclusion
The GO films have been synthesized by modfied Hummers method (MHM). The functional groups
and structure of GO films were characterized with the help of FTIR, Raman and XRD analysis. From
FTIR spectrum, the oxygen containing functional groups such as hydroxyl, carbonyl, carboxyl and
epoxy groups was revealed. With the help of the Raman spectrum, it is concluded that the GO film has
less defects as the G band is dominated to D band. Finally, XRD spectrum revealed that the changes
in the interlayer spacing may be indicative of the perturbation of the oxygen-containing functional
groups bound to the GO film.
Reference
[1] V.H. Pham, T.V. Cuong, T.T. Dang, S.H. Hur, B.S. Kong, E.J. Kim, E.W. Shin, and J.S. Chung,
Superior conductive polystyrene – chemically converted graphene nanocomposite J. Mater.
Chem., 21,11312 (2011).
[2] Stoller, M. D., Park, S., Zhu, Y., An, J. & Ruoff, R. S. Graphene-based ultracapacitors. Nano Lett.
8, 3498–3502 (2008).
[3] Stankovich, S., Dikin, D. A., Dommett, G. H. B. Kohlhaas, K. M. J., Z. E. Stach, E. A. Piner, R.
Nguyen, S. T., Ruoff, R. S, Graphene-based composite materials, Nature, 442, 282–286(2006).
[4] Dikin, D. A. Stankovich, S. Zimney, E. J. Piner, R. Dommett, G. H. B. Evmenenko, G. Nguyen, S.
T. Ruoff, R. S, Preparation and characterization of graphene oxide Paper, Nature, 448, 457 –
460(2007).
[5] L. Huang, Y. Huang, J. Liang, X. Wan, and Y,Chen, Graphene-Based Conducting Inks for Direct
Inkjet Printing of Flexible Conductive Patterns and Their Applications in Electric Circuits and
Chemical Sensors, Nano Res., 4, 675 (2011).
[6] Bunch, J. S. v. d, Zande, A. M., Verbridge, S. S.Frank, I. W. Tanenbaum, D. M. Parpia, J. M.
Craighead, H. G. McEuen, P. L, Electromechanical Resonators from graphene Sheets , Science,
315, 490–493(2007).
[7] Lamuel David, Romil Bhandavat, and Gurpreet Singh, MoS2/Graphene Composite Paper for
Sodium-Ion Battery Electrodes, ACS Nano, vol. 8, no.2,1–13 (2014).
[8] A.K. Geim, K.S. Novoselov, The rise of Graphene, Nat. Mater. 6, 183 (2007).
[9] S. Niyogi, E. Bekyarova, M.E. Itkis, J.L. McWilliams, M.A. Hamon, R.C. Haddon, Solution
Properties of Graphite and Graphene, J. Am. Chem. Soc. 128, 7720 (2006).
[10] Dikin DA, Stankovich S, Zimney EJ, Piner RD, Dommett GHB, Evmenenko G, et al. Preparation
and characterization of graphene oxide paper, Nature, 60, 448- 457(2007).
[11] Nisha Bagotia ,Harshal Mohite, Nidhi Tanaliya, D.K. Sharma, A Comparative Study of Electrical,
EMI Shielding and Thermal Properties of Graphene and Multiwalled Carbon Nanotube Filled
Polystyrene Nanocomposites, polymer composites, 1-12 (2017).
[12] William S. Hummers, JR., and Richard E. Offeman, Preparation of Graphitic Oxide, Journal of the
American Chemical Society, 80, 1339-1339(1958).
[13] Tarko Fentaw Emiru, Delele Worku Ayele, Controlled synthesis, characterization and reduction of
graphene oxide: A convenient method for large scale production, Egyptian Journal of Basic and
Applied Sciences, 111, 1-6 (2016).
[14] Sudesh, N Kumar, S Das, C Bernhard and G D Varma, Effect of graphene oxide doping on
superconducting properties of bulk MgB2, Supercond. Sci. Technol. 26 (2013) 095008 (8pp).
[15] Dongning He, Zheng Peng, Wei Gong, Yongyue Luo, Pengfei Zhao and Lingxue Kong,
Mechanism of a green graphene oxide reduction with reusable potassium carbonate, RSC Adv.,
(2015), 5, 11966.
5International Conference on Multifunctional Materials (ICMM-2019) IOP Publishing
Journal of Physics: Conference Series 1495 (2020) 012012 doi:10.1088/1742-6596/1495/1/012012
[16] Wang Z, Huang B, Dai Y, Liu Y, Zhang X, Qin X, Wang J, Zheng Z, Cheng H: Crystal facets
controlled synthesis of graphene@TiO2 nanocomposites by a one-pot hydrothermal process. Cryst
Eng Comm, 14(5)1687–1692(2012).
[17] A.V. Ramya, B. Manoj and Anu N. Mohan, Extraction and Characterization of Wrinkled
Graphene Nanolayers from Commercial Graphite, Asian Journal of Chemistry; Vol. 28, No. 5,
1031-1034 (2016).
[18] A. C. Ferrari, J. Robertson, Interpretation of Raman spectra of disordered and amorphous carbon.
Phys. Rev. B 61, 14095-14107(2000).
[19] Leila Shahriary, Anjali. Athawale, Graphene Oxide Synthesized by using Modified Hummers
Approach, IJREEE, volume 2,58-63(2014).
[20] Sanjeev Rao, Jahnavee Upadhyay, Kyriaki Polychronopoulou, Rehan Umer and Raj Das, Reduced
Graphene Oxide: Effect of Reduction on Electrical Conductivity, J. Compos. Sci., 2, 25 (2018).
[21] Hu Meng, Wei Yang, Kun Ding, Liang Feng and YafengGua, Cu2O nanorods modified by
reduced graphene oxide for NH3 sensing at room temperature, J.Mater.Chem. A, 3,1174-
1181(2015).
6You can also read