Watt-scale 50-MHz source of single-cycle waveform-stable pulses in the molecular fingerprint region
←
→
Page content transcription
If your browser does not render page correctly, please read the page content below
1730     Vol. 44, No. 7 / 1 April 2019 / Optics Letters                                                                        Letter

Watt-scale 50-MHz source of single-cycle
waveform-stable pulses in the molecular
fingerprint region
T. P. BUTLER,1 D. GERZ,1,2 C. HOFER,1,2 J. XU,1 C. GAIDA,3 T. HEUERMANN,3,4 M. GEBHARDT,3,4
L. VAMOS,2 W. SCHWEINBERGER,2,5 J. A. GESSNER,1,2 T. SIEFKE,3,6 M. HEUSINGER,3 U. ZEITNER,3,7
A. APOLONSKI,1,2 N. KARPOWICZ,1 J. LIMPERT,3,4,7 F. KRAUSZ,1,2 AND I. PUPEZA1,2,*
1
  Max Planck Institute of Quantum Optics, Hans-Kopfermann-Str. 1, 85748 Garching, Germany
2
  Ludwig Maximillians University Munich, Am Coulombwall 1, 85748 Garching, Germany
3
  Institute of Applied Physics, Abbe Centre of Photonics, Friedrich-Schiller Universität Jena, Albert-Einstein-Str. 15, 07745 Jena, Germany
4
  Helmholtz-Institute Jena, Frobelstieg 3, 07743 Jena, Germany
5
  King Saud University, Department of Physics and Astronomy, Riyadh 11451, Saudi Arabia
6
  Physikalisch-Technische Bundesanstalt, Bundesallee 100, 38116 Braunschweig, Germany
7
  Fraunhofer Institute for Applied Optics and Precision Engineering, Albert-Einstein-Str. 7, 07745 Jena, Germany
*Corresponding author: ioachim.pupeza@mpq.mpg.de

Received 15 January 2019; revised 27 February 2019; accepted 1 March 2019; posted 4 March 2019 (Doc. ID 357850); published 27 March 2019

We report a coherent mid-infrared (MIR) source with a                      MIR idler signal through phase matched mixing of spectral
combination of broad spectral coverage (6–18 μm), high                     components within a broadband driving pulse, ensures a
repetition rate (50 MHz), and high average power (0.5 W).                  passively waveform-stable output. This enables electro-optic
The waveform-stable pulses emerge via intrapulse difference-               sampling (EOS) to detect the generated electric field, transfer
frequency generation (IPDFG) in a GaSe crystal, driven                     the detection to the NIR spectral region where low-noise semi-
by a 30-W-average-power train of 32-fs pulses spectrally cen-              conductor photodetectors offer increased performance over
tered at 2 μm, delivered by a fiber-laser system. Electro-optic            cooled MIR detectors [13] used in conventional Fourier
sampling (EOS) of the waveform-stable MIR waveforms                        transform infrared (FTIR) spectroscopy, and allows for ultra-
reveals their single-cycle nature, confirming the excellent                sensitive [14] and broadband [15,16] detection across the
phase matching both of IPDFG and of EOS with 2-μm                          entire molecular fingerprint region.
pulses in GaSe. © 2019 Optical Society of America                              The major limitation of IPDFG-based MIR sources so far
                                                                           has been the severe trade-off between bandwidth and efficiency
https://doi.org/10.1364/OL.44.001730
                                                                           in the nonlinear conversion process. Similarly, where high field-
Provided under the terms of the OSA Open Access Publishing Agreement       strengths are desirable, drivers are typically limited to kHz
                                                                           repetition rates [17]. In multi-MHz repetition rate systems,
Coherent mid-infrared (MIR) light sources have shown prom-                 NIR-to-MIR conversion efficiencies on the order of 0.1% have
ise in the study of a wide range of resonant light–matter inter-
                                                                           been demonstrated for 1-μm [10], 1.5-μm [7], and 2-μm [11]
actions, most notably in the study of ro-vibrational molecular
                                                                           sources. Very recently, IPDFG at a 1.25-MHz repetition rate
transitions and dynamics [1], as well as the investigation of
                                                                           with a conversion efficiency of 1.8% driven by 2-μm, 16-fs
low-energy phonon dynamics [2], charge transport in semicon-
ductors [3], and non-linear and high-field interactions [4]. As            pulses, generating a spectrum from 7.3 to 16.5 μm (at −10 dB)
such, the development of both suitable light sources and appro-            and a record power of 470 mW was reported [12]. Driving
priate detection techniques is an important step toward the                pulses at 2-μm can offer increased powers due to a lower quan-
improvement of the sensitivity and precision of measurements,              tum defect and lower photon energy, enabling the use of
especially in applications such as biomedical diagnostics [5] and          smaller-bandgap crystals with higher nonlinear coefficients
chemical/trace gas monitoring [6,7]. Recent advances in near-              [18]. At the same time, longer driving wavelengths increase
infrared (NIR) femtosecond laser technology have provided                  the phase matched bandwidth by improving the group velocity
a viable route towards table–top broadband ultrafast MIR                   matching between NIR and MIR pulses [8]. While the pre-
sources via nonlinear processes such as parametric amplification           vious results were obtained with high driving pulse energies
or difference frequency generation (DFG) [6–12]. In particular,            (24 μJ), they show the existence of favorable phase matching
the frequency down-conversion technique of intra-pulse DFG                 conditions for high-efficiency, broad-bandwidth IPDFG using
(IPDFG) has emerged as a relatively simple way to create MIR               GaSe as a nonlinear medium. These results show the possi-
pulse trains that combine several properties highly desirable for          bility to achieve high-conversion efficiency and broad phase-
molecular spectroscopy [7,10–12]. IPDFG, which generates a                 matching via IPDFG using GaSe as a nonlinear medium, albeit

0146-9592/19/071730-04 Journal © 2019 Optical Society of America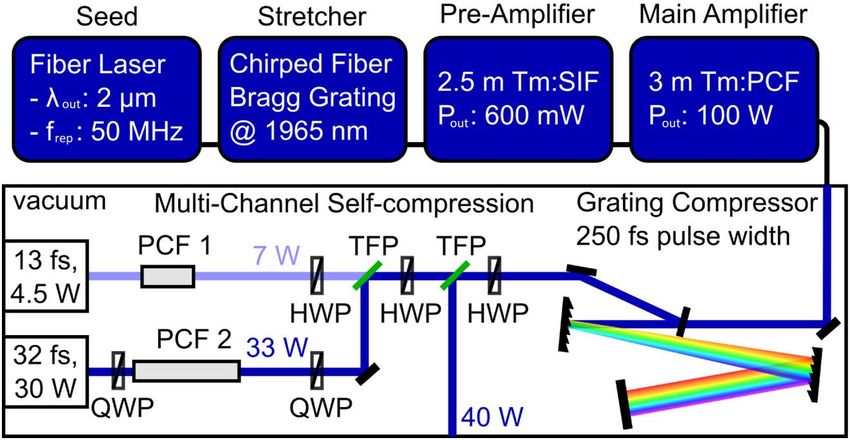
Letter Vol. 44, No. 7 / 1 April 2019 / Optics Letters 1731
using a large pulse energy and 1.25-MHz repetition rate. Here,
we further investigate the suitability of 2-μm driven IPDFG to
assess whether this conversion efficiency can be maintained at
the high repetition rates typically needed for frequency-comb
spectroscopy [6,7] and also characterize the temporal profile of
the MIR pulse, which is essential for field-resolved spectros-
copy [19,20].
In this Letter, we present a source which combines a
watt-scale average power (0.5 W), super-octave bandwidth
(6–18 μm), single-cycle pulse duration (43 fs), waveform sta-
bility, and high repetition rate (50 MHz). Our novel MIR
source is based on 2-μm fiber laser technology, enabling both
generation and field-sensitive detection of phase-stable MIR
pulses. These MIR transients, generated via IPDFG of 30-W
average power, 32-fs pulses in a GaSe crystal, have been char-
acterized using EOS with few-cycle, watt-level 2-μm sampling
pulses. Compression of the field to a single-cycle duration has
been demonstrated, with the possibility to generate absolute
field strengths in excess of 1 MV/cm at a 50-MHz rate.
Compared to current state-of-the-art broadband MIR sources,
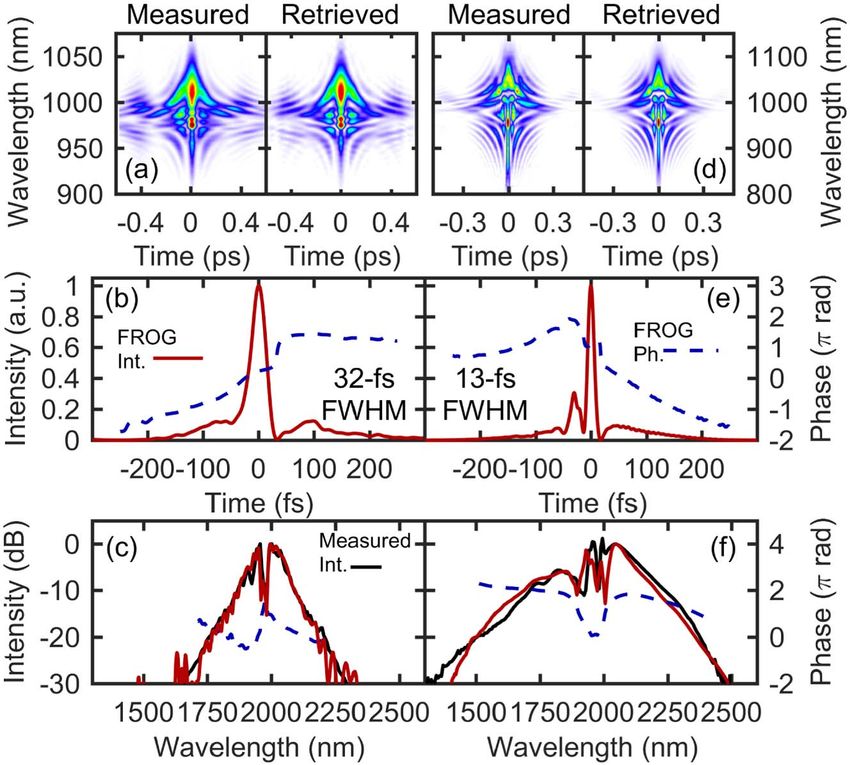
our table–top system provides a significantly higher spectral Fig. 2. (a) Measured [left] and retrieved [right] FROG spectrograms
brilliance across its entire bandwidth than current 3rd-genera- of the longer pulse PCF compression channel. (b) Retrieved FROG
tion facility-scale synchrotron sources [21], while maintaining a temporal intensity and phase. (c) Retrieved FROG spectral intensity
high degree of temporal and spatial coherence and close to and phase, compared to independently measured spectrum obtained
bandwidth limited temporal compression. using a NIR grating spectrometer. (d–f ) shows the same information as
The experimental setup of the 2-μm femtosecond frontend (a–c), this time measured for the shorter pulse PCF channel.
is shown in Fig. 1. The amplifier chain was seeded by a train of
50-MHz pulses from a fiber laser. This commercial source
(Menlo C-Fiber) generated 2-μm pulses from a 1550-nm of 5.6 cm. The self-compressed pulse width of 32-fs FWHM
Er:fiber seed oscillator which was amplified and Raman shifted was measured with a home-built second-harmonic-generation
in a subsequent nonlinear fiber. Stretched pulses with a center frequency-resolved optical gating (SHG-FROG) instrument
wavelength of 1965 nm were subsequently amplified in two utilizing a 10-μm thick BBO crystal, see Figs. 2(a)–2(c). For
thulium-doped fibers boosting the average power of the pulse accurate temporal measurement of MIR waveforms, a second
train to a maximum of 100 W [22]. Due to absorption by am- fiber self-compression stage was implemented in parallel for use
bient water vapor, the entire high-power free-space beam path as the EOS sampling pulse train. In this case, a smaller core
was housed in vacuum chambers at a pressure of 60% efficiency while simultaneously temporally
from the CPA was split between 2 channels, and further com- compressing the pulse to ∼2 optical cycles (13-fs FWHM), see
pressed nonlinearly in photonic crystal fibers (PCF) [24]. To Figs. 2(d)–2(f ).
achieve the high-average-power driving pulses required for ef- Figure 3 presents a schematic layout of the IPDFG and EOS
ficient IPDFG, the first channel was compressed to 32-fs full setup. The 32-fs p-polarized pulse train was focused to a 162-
width at half-intensity maximum (FWHM) using a 56-μm μm 1∕e 2 -intensity spot diameter inside a 1-mm-thick GaSe
mode-field diameter (MFD) solid-core silica PCF with a length
Fig. 3. Experimental setup of the IPDFG and EOS. G1, G2 are
Fig. 1. Experimental schematic of the Tm:fibre-based CPA fron- gold-coated silicon beamsplitter gratings. Ge LPF: coated 1-mm Ge
tend. SIF: step index fiber; HWP: half wave plate; TFP: thin film longpass filter with 4.5 um cut-on. Pol.: wire grid polarizer; UVFS:
polarizer; QWP: quarter wave plate; PCF 1: 13-μm MFD; PCF 2: UV fused silica; SPF: shortpass filter 1550 nm. WoP: Wollaston
56-μm MFD. prism; Bal. Det.: balanced InGaAs photodetector.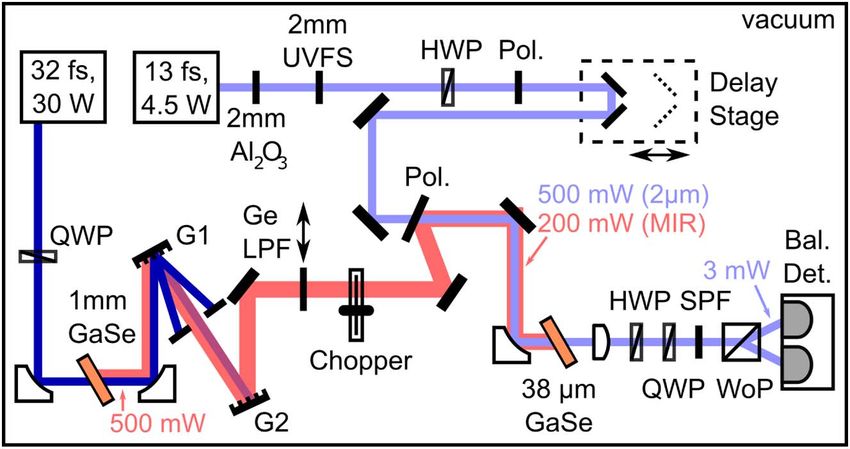
1732     Vol. 44, No. 7 / 1 April 2019 / Optics Letters                                                                                                                           Letter

crystal. Type-I phase matching was used with an external crystal

                                                                                          Signal (norm.)
                                                                                                           1    (a)
angle of 38 degrees [12]. The resulting MIR light was measured
with a wire-grid polarizer to be s-polarized and was collimated                                            0
using a gold-coated off-axis parabola. Separation of the collin-                                                                                                                Measured EOS
                                                                                                           -1                                                                   Retrieved Field
early propagating MIR and driving signals was achieved by using
custom-fabricated gold-coated silicon diffraction gratings [25].                                                  -200       -100       0         100                     200       300      400
These gratings were designed to have a high diffraction effi-                                                                                 Time (fs)

                                                                      Intensity (norm.)
ciency at 2 μm, while retaining a large zeroth-order reflection                                   100           (b)                                                 (c)      EOS

                                                                                                                                                Phase (rad)
                                                                                                                                                              10             6mm Ge
coefficient for the MIR wavelengths. Three gratings were used                                  10          -1

in series in order to suppress the power of the driving pulses by                                                                                              0
                                                                                               10-2                            FTIR
30 dB. Compared to other coated or transmissive filtering op-                                  10          -3                  EOS                            -10               Compressed
                                                                                                                               Field                                            EOS + Ge
tics, diffraction gratings offer an exceptional thermal stability                              10          -4
and impart no chromatic dispersion on the propagating MIR                                                       6     9    12 15           18                       6       9    12 15        18
pulses. A reflective ZnSe wire-grid polarizer was used to combine                                                   Wavelength ( m)                                       Wavelength ( m)

                                                                                          Signal (norm.)
the MIR pulses with the 2-μm sampling pulses in an orthogonal                                              1 (d)
polarization state. Use of a reflective beamsplitter and re-
combiner meant that no transmissive elements were present                                                  0
                                                                                                                         Measured EOS
in the MIR beam path, enabling a direct measurement of the                                                               Retrieved Field
                                                                                                           -1
MIR pulse as it exits the IPDFG crystal. After undergoing mix-
                                                                                                           -500       -400    -300     -200     -100    0                    100      200    300
ing in the GaSe crystal, at least 498 mW of MIR power was
                                                                                                                                              Time (fs)
generated after the exit face of the crystal, estimated by account-
ing for the loss from subsequent mirrors and optics. Considering      Fig. 4. (a) Measured EOS trace of MIR transient generated by
the power lost due to reflection from the front face of the           IPDFG (black) and recovered MIR input field (red). (b) Measured
crystal, a total NIR-to-MIR conversion efficiency of 2.0%             EOS spectrum (black) (Fourier transform of the temporal waveform)
was achieved with a peak intensity at the focus of 75 GW∕cm2 .        compared with the independently measured FTIR spectrum (grey)
                                                                      and the recovered spectrum (red). (c) Spectral phase of the measured
    For lock-in detection of the electric field of the broadband
                                                                      EOS pulse (black). Phase due to 6 mm of propagation through bulk
MIR transients, the beam was mechanically chopped at a fre-
                                                                      germanium (grey). Sum of EOS phase and Ge (black dashed).
quency of 7 kHz. The short p-polarized probe was combined             Measured spectral phase after insertion of bulk Ge in the beam path
with the MIR pulse train by transmission through a ZnSe wire          (red). (d) Measured EOS after compression with bulk Ge (black) and
grid polarizer. Dispersion of the probe pulse was compensated         the retrieved field (red) with a 43-fs intensity FWHM.
using bulk fused silica and sapphire plates, ensuring a 20-fs
FWHM pulse, which was spatially overlapped with the MIR
beam and focused into a 38-μm thick GaSe crystal. Sum-                choice of suitable materials. Figure 4(c) shows the measured
frequency generation (SFG) of the two pulses results in an ef-        spectral phase of the pulse shown in parts (a) and (b). Also
fective polarization rotation of the probe pulse, which is directly   shown is the phase expected due to dispersion through 6 mm
proportional to the MIR electric field [26]. Scanning of the          of bulk germanium. It is clear that in the longer wavelength part
probe pulse delay allows for detection of the MIR field. The          of the spectrum (∼9–20 μm), germanium can provide suitable
thin detection crystal ensured good phase matching across             compensation for the generated IPDFG pulse [27]. Using this
the entire MIR spectrum. The measured EOS trace of the                arrangement, we experimentally demonstrated compression of
MIR pulse is shown in Fig. 4(a). While a clear chirp of the           the MIR transient by performing EOS detection after transmit-
waveform can be observed due to the dispersion-free nature            ting the pulse through 6 mm of bulk germanium. Figure 4(c)
of the beam-path, it is inferred that this chirp is intrinsic to      shows the measured spectral phase, which agrees well with the
either the MIR wave passing through the nonlinear generation          numerical calculations. Figure 4(d) shows the measured and
crystal or to the response of EOS detection. Numerical mod-           retrieved field for the compressed pulse, with an intensity
elling of the EOS detection allows for retrieval of the input         FWHM of 43 fs. This pulse duration is just 1.16 times the fun-
MIR electric field through independent calculation of the             damental oscillation period of the central carrier field at
EOS instrument response function [15]. The retrieved field,           11.1 μm. In this case, the compression medium introduces some
also shown in Fig. 4(a), excludes the latter as the source of         Fresnel reflection losses to the MIR beam. However, with a
the chirp. Figure 4(b) compares the spectrum of the measured          Brewster-angle compression plate and minimal power loss, the
EOS trace to the retrieved EOS input spectrum as well as the          absolute field strength of the transient could exceed 4 MV/cm.
independently measured spectrum captured with an FTIR                 The generation of such field strengths at a >10 MHz repetition
spectrometer. The good agreement of the two spectra validates         rate, combined with the single-cycle duration, make this source
the calculation of the EOS response. Comparison of the EOS            ideally suited to multi-dimensional spectroscopy and other
and FTIR spectra shows that phase matching in the EOS de-             pump-probe experiments. Along with high output power, the
tection process slightly suppresses the signal at longer wave-        spectrum of the MIR idler covers a broad bandwidth, from 6
lengths, while enhancing detection for the shorter ones, as           to 18 μm (−30 dB).
clearly observed in the chirped waveforms of Fig. 4(a).                   Figure 5(a) shows the calculated spectral brilliance [9] com-
    For the study of both linear [19,20] and nonlinear [4,17]         pared to two other commonly used MIR radiation sources,
interactions, the confinement of the available spectrum to a          thermal and synchrotron (BESSY II IRIS beamline) [21].
short transient is essential. Dispersion compensation of pulses       The brilliance of our coherent MIR source is at least 2 orders
in this spectral range can be difficult due to a relatively small     of magnitude greater over 7–17 μm and exceeds that of the
Letter                                                                                              Vol. 44, No. 7 / 1 April 2019 / Optics Letters       1733

                                                            Wavelength ( m)                          REFERENCES
             (ph/s/mm2 /sr/0.1%BW)         20   15        10        7.5          6               5
                                          21                                                          1. W. Demtröder, Molecular Physics (Wiley, 2005).
                                     10
                                          19                                         This Work        2. T. Kampfrath, L. Perfetti, F. Schapper, C. Frischkorn, and M. Wolf,
                                     10
Brilliance

                                                BESSY II IRIS                                            Phys. Rev. Lett. 95, 187403 (2005).
                                                 Synchrotron
                                     1017                                                             3. R. Huber, F. Tauser, A. Brodschelm, M. Bichler, G. Abstrelter, and A.
                                                                                                         Leitenstorfer, Nature 414, 286 (2001).
                                     1015                                     Globar 1200K
                                                                                                      4. C. Schmidt, J. Buhler, A.-C. Heinrich, J. Allerbeck, R. Podzimski, D.
                                                                                                         Berghoff, T. Meier, W. G. Schmidt, C. Reichl, W. Wegscheider, D.
                                           15   20        30         40         50           60          Brida, and A. Leitenstorfer, Nat. Commun. 9, 2890 (2018).
                                                            Frequency (THz)                           5. A. Barth and P. I. Haris, Biological and Biomedical Infrared
                                                                                                         Spectroscopy (IOS press, 2009).
Fig. 5. Photon brilliance of the MIR spectrum calculated from the                                     6. A. V. Muraviev, V. O. Smolski, Z. E. Loparo, and K. L. Vodopyanov,
measured average power and retrieved EOS spectrum, compared with                                         Nat. Photonics 12, 209 (2018).
other common FTIR sources [21].                                                                       7. H. Timmers, A. Kowigly, A. Lind, F. C. Cruz, N. Nader, M. Silfies, G.
                                                                                                         Ycas, T. K. Allison, P. G. Schunemann, S. B. Papp, and S. A.
                                                                                                         Diddams, Optica 5, 727 (2018).
                                                                                                      8. F. Junginger, A. Sell, O. Schubert, B. Mayer, D. Brida, M. Marangoni,
synchrotron over nearly two octaves (from 5 to 18 μm). The                                               G. Cerullo, A. Leitenstorfer, and R. Huber, Opt. Lett. 35, 2645
power spectral density of the source is greater than 1 mW/THz                                            (2010).
across a large part of the spectrum (20–40 THz), while the                                            9. C. Manzoni, M. Forst, H. Ehrke, and A. Cavalleri, Opt. Lett. 35, 757
power per combline value exceeds 1 μW in the 19 to                                                       (2010).
                                                                                                     10. I. Pupeza, D. Sanchez, J. Zhang, N. Lilienfein, M. Seidel, N.
27.5 THz region, with a peak of 2.2 μW per combline. This
                                                                                                         Karpowicz, T. Paasch-Colberg, I. Znakovskaya, M. Pescher, W.
value is more than 10 times larger than previously reported                                              Schweinberger, V. Pervak, E. Fill, O. Pronin, Z. Wei, F. Krausz, A.
2-μm driven IPDFG sources with a peak value of
You can also read