Helios: Understanding the Economic Risk of Solar Storms - Jennifer Copic Research Assistant, Cambridge Centre for Risk Studies
←
→
Page content transcription
If your browser does not render page correctly, please read the page content below

Cambridge Judge Business School
Centre for Risk Studies 7th Risk Summit Research Showcase

Helios:
Understanding the
Economic Risk of
Solar Storms
Jennifer Copic
Research Assistant, Cambridge Centre for Risk Studies

20 June 2016
Cambridge, UK
Presentation Outline
Project information
What is a solar storm?
Subject matter experts
The scenario
Macroeconomic modelling
Insurance loss modelling
2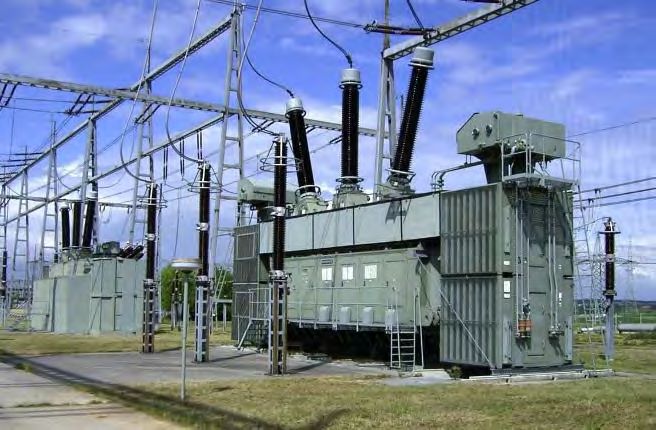
Helios Solar Storm Project Overview
Objective: To produce a detailed solar
storm scenario with macroeconomic,
investment and insurance portfolio
impact estimations
Timeframe: 30 Mar 2015 – 30 Mar 2016
– Explores the potential economic impact of
extreme space weather
– Develops an open-source risk matrix
Report to be published
– Undertakes sectoral analysis of global in late June 2016
supply chain linkages and total
macroeconomic losses
– Estimates US insurance industry losses
3
What is a Solar Storm? CME
Coronal Mass Ejections (CMEs)
– A massive burst of gas, matter, magnetic fields and
electromagnetic radiation that is released into the solar wind
X-class solar flares
– A solar flare is a sudden flash of brightness observed near the
Sun's surface
– Flares can be accompanied by a spectacular coronal mass
ejection Solar Flare
Solar Proton Events (SPEs)
– When particles emitted by the Sun become accelerated and
enter the Earth’s magnetic field
An extreme solar storm would feature all three of
these phenomena
Key Metrics
SPE
Dst (Disturbance storm time) index, units of nano-
Teslas (nT)
Rate of change of magnetic fields, units of nT/min
There are many other metrics used in physics,
maths and other sciences, such as Kp, Ap, G
4
Impacts of Space Weather on Earth
Impact of     Warning      Duration           Primary Extreme Event Impact
Space         Time
Weather on
Earth
Radio         None         Minutes to 3       •   Loss of high-frequency (HF) radio communications
Blackout      (speed of    hours                  on Earth’s daylight side
              light)                          •   Short-lived (minutes to an hour) loss of GPS
                                              •   Interference on civilian and military radar systems
Radiation     30           Hours to           •   Satellite operations impacted. Loss of satellites
Storm         minutes      days                   possible.
              to several                      •   HF blackout in Polar Regions.
                                              •   Increased radiation exposure to passengers and
              hours                               crew in aircraft at high latitudes

Geomagnetic 17 to 90       1 to 2 days        •   Possible bulk electricity power grid voltage collapse
Storm       hours                                 and damaged to electrical transformers
                                              •   Interference or loss of satellite and sky wave radio
                                                  communications due to scintillation
                                              •   Interference or loss of GPS navigation and timing
                                                  signals
                                              •   Satellite operations impacted

                       MacAlester, M. H., and W. Murtagh (2014), Extreme Space Weather Impact: An
                       Emergency Management Perspective, Space Weather ,                                  5
                       12, doi:10.1002/2014SW001095.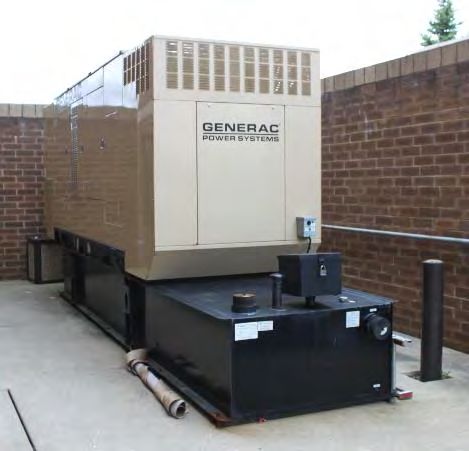
Historical Solar Storm Events
1847
1859 – The Carrington Event caused significant disruption to telegraph systems
       (Boteler, 2006; Clauer and Siscoe, 2006)
1870
1872
1882 – This storm caused disruption to several US telegraph systems and interrupted
       trading on the Chicago Stock Market (EIS Council, 2014)
1903
1909
1921 – Similar in size to the Carrington Event, a storm caused fires at several telegraph
       stations in Sweden (Karsberg et al. 1959)
1938
1940
1958
1989 – It took only 90 seconds for the entire Quebec power grid to collapse and the
       outage lasted nine hours (Bolduc, 2002)
2000 – The Bastille Day Event saw a very large CME and flare with increased radiation
       on Earth (Tsurutani et al. 2005)
2003 – The Halloween Storms included a mix of CMEs and flares leading to a one hour
       power outage in Sweden (Pulkkinen et al. 2005). This storm also led to a radio
       blackout of high frequency communications, as well as disruption to GPS
       systems (Bergeot et al. 2010)

                                                                                            6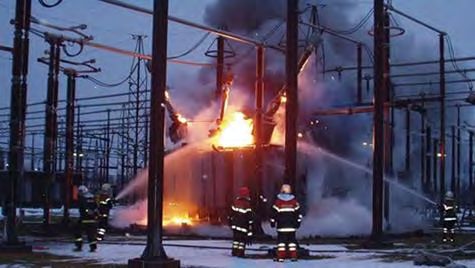
Frequency and Severity
Estimates of the likelihood of geomagnetic storms
are not robust because of the short time-series
(Hapgood, 2011)
Riley (2012) suggest that the Carrington event
has a 12% probability of occurring every 79 years
Love et al. (2015) recommend
– A storm larger than Carrington (-Dst = ≥ 850 nT) occurs
about 1.13 times per century:
– Moreover, a 100-year geomagnetic storm is identified
as having a size greater than Carrington (-Dst = ≥ 880
nT)
7
Subject Matter Experts
Subject Matter Experts
British Antarctic Survey
– Dr Richard Horne
Cambridge Department of
Applied mathematics and
Theoretical Physics
– Dr Helen Mason
Scenario Development Workshop
British Geological Survey
held in Cambridge, 29th July 2015
– Dr Alan Thomson
University of Cape Town
– Professor Emeritus C.
Trevor Gaunt
Plus other
representatives from
electric utilities,
government and
regulators
8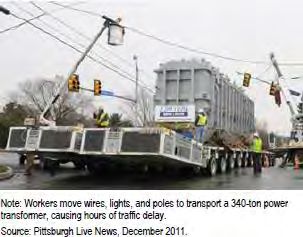
Overview of CRS Solar Storm Scenario
Scientist detect a large active solar storm sunspot
Relatively moderate CME and flare emitted:
– CME speed = ~450km/s ± 500km/s
– Flare size (M5) = < 5x10⁻⁵ W/m2
– NOAA estimates a G2 category geomagnetic storm in four days’ time
Three days later, a large build up of energy due to an efficient
magnetic reconnection process, leads to a giant high-mass CME
being discharged towards Earth:
– CME speed = ~2000km/s ± 500km/s
– Flare size (X20) = 2x10⁻³ W/m2
– Solar radiation storm = 104 MeV
Satellite systems provide 60 minutes warning of incoming CME:
– Bombards Earth’s magnetosphere, forcing a reconfiguration between the
southward-directed interplanetary magnetic field and Earth’s geomagnetic
field
The second CME reaches Earth in only 20 hours:
– Consequently billions of tonnes of gas containing charged particles
intensify the shock compression
– Particles are accelerated along the magnetotail, back towards Earth being
deposited in the auroral ionosphere and magnetosphere on the night side
of the Earth, directly above North America
– Dst measurements = ~ -1000nT
– dB/dt measurements = ~5000nT/m at 50° magentic latitude
Auroral oval forced equatorward by 15° magnetic latitude
Numerous substorms
– Take place every few hours on the dawn-to-dusk side of the Earth due to
the highly dynamic nature of the auroral electrojet roughly 100km above
ground
Geomagentic effects
– Rapid change in the magnetic field rate-of-change down to 50° magnetic
latitude
– Ring current intensifications take place down to 20° magnetic latitude
– Minor and major damage to EHV transformers
CME = coronal mass ejection 9
Cambridge Global Geomagnetic Storm Threat Map
Exposure based on geomagnetic latitude lines
38% of the world population is less likely to be exposed to the storm
Notes: The contour lines on this map were generated using the World Magnetic Model 10
(WMM) 2015 shape file from NOAA (Chulliat, 2014).US Restoration Curves
150 Point in time where approximately: S1 S2 X1
Millions
140 95% of population affected has power 3 days 3 months 5 months
130 restored
120 99% of population affected has power 3 months 6 months 10 months
restored
110
100% of population affected has 6 months 8 months 12 months
Population affected
100 power restored
90
80
70
60
50
40
30
20
10
0
0 50 100 150 200 250 300 350 400
Outage (Days) X1 S2 S1
11Macroeconomic Modelling
19.5
X1 S2 S1 Baseline
GDP, constant prices and exchange rate,
19
18.5
18
17.5
US$bn
17
16.5
16
15.5
15
2014 2015 2016 2017 2018 2019 2020 2021
5-year Global GDP@Risk,
Scenario Variants
US$ Bn (From OEM analysis)
S1 $136 (0.2%)
S2 $319 (0.4%)
X1 $613 (0.7%)
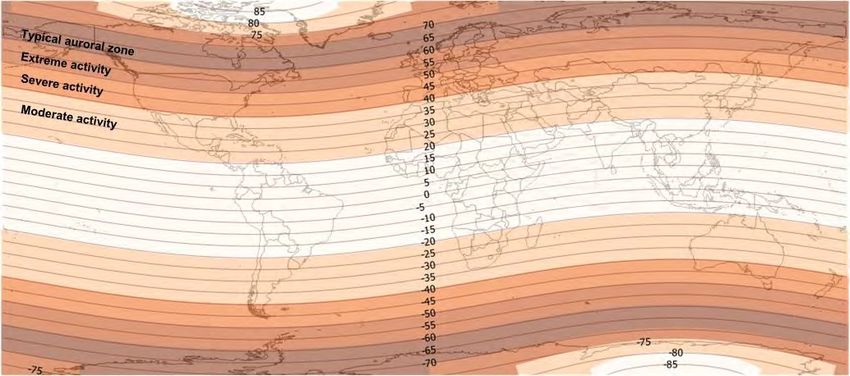
12Direct and Indirect Shock by Sectors
Shock to sector GVA ($bn)
X1 0 50 100 150 200 250 300 350
S2 0 25 50 75 100 125 150 175 200
S1 0 10 20 30 40 50 60
Manufacturing
Finance and insurance
Government
Real estate and rental and leasing Scenario Total Direct and
Professional, scientific, and technical services Variant Indirect shock, US
Health care and social assistance only, $Bn
Wholesale trade
Retail trade
S1 $474
Arts, entertainment, and recreation
S2 $1,532
Administrative and waste management services
Construction Direct shock X1 $2,693
Transportation and warehousing
Accommodation and food services
Information
Direct shock
Other services, except government
Management of companies and enterprises
Mining (including coal, oil and gas extraction)
Agriculture, forestry, fishing, and hunting
Direct shock
Utilities
Indirect shock from downstream
Educational services Indirect shock from upstream
13US Insurance Loss Estimate
Claimant Type Coverage $ millions
1 Power Transmission Property Damage (EHV transformers) 466
Companies
Incident Response Costs 29
Fines – FERC/NERC 4
Directors and Officers Liability 600
Power Generation Property Damage (generator step-up transformers) 84
Companies
Business Interruption 423
Incident Response Costs 4
Fines – FERC/NERC 4
Directors and Officers Liability 95
Companies that loss Perishable contents 1,079
2
power
Contingent business interruption – service 50,983
interruption/utility interruption/suppliers extension
3 Satellite Property damage (satellites) 218
Homeowners Household contents 449
Speciality Event cancellation 603
Total 55,040
For variant S1, $ millions 141 Power Transmission Companies
Property Damage (EHV transformers) Typical EHV transformers:
EHV = extra high voltage
Damage Damage % of transformers Damage
EHV transformers are defined
Scale Scale factor
Description S1 S2 X1 as 345 kV and greater
They are used to convey
D0 Not Affected 68% 49% 49% 0%
power long distances
D1 Tripped Off 26% 33% 33% 0% There are ~ 2,300 EHV
transformers in the US
D2 Minor 5% 14% 14% 30% They are vulnerable during a
Damage
solar storm due to increased
D3 Major 0% 3% 3% 100% GICs
Damage
D4 Destroyed 0% 0.2% 0.2% 100%
– Assumed that 100% have Property Damage
insurance
– Assumed average cost of installed EHV
transformer, $11.25 million (DOE, 2014)
– Deductible: $0.5 million The scenario would affect around
– Limit: $11 million 7% of EHV transformers in the US
in S1 variant, resulting in property
– Total: $466 million of payouts damage and BI claims
152 Companies That Lose Power
We use a data set from the US Census Bureau Typical US Facilities with back-
(2016) for number of establishments and revenue by up generators:
NAICS sector by US state
– There are 1.1 million large facilities (500+ Manufacturing
employees) in the US Utilities
Policy holders claim the outage is the result of fire at Mining, Quarrying, and Oil
the generators/transformer - a standard FLEXA peril and Gas Extraction
Contingent business interruption – service Educational Services
interruption/utility interruption/suppliers extension Health Care and Social
– We estimate ~ 222,000 large facilities or 19% (500+ Assistance
have Suppliers Extension insurance
– A dataset from Energy Information Administration, 2015
provides an estimate for the number of companies with
backup generators by sector
– Use the US state restoration curves to determine the
percent of companies that experience a loss of power
longer than contractual retentions
– Deductible: 24 hours
– Sublimit: $15 million
– Total: $50,983 million of payouts
Perishable contents are spoiled during the outage and Backup generators, if working properly
also cause a insurance claim could prevent loss of perishable contents
163 Satellite Owners
Satellite loss Typical Satellites:
There are over 1,200
Satellite Type Purpose Typical Insured
Users operational satellites in space
Low Earth Orbit (LEO) Imaging, Earth Commercial Insured
as of year-end 2014 (SIA,
observation, data 2015)
services – There are ~ 456 active satellites
around Earth that are for
Mid Earth Orbit (MEO) GPS, Military Government Typically
commercial purposes only (38%)
not insured
Geostationary (GEO) Communications, Commercial Insured
Of these about half are
TV, Broadband owned by US companies
Based on a Swiss Re report,
we estimate that about 12%
– Using the ‘best engineering estimate’ from the RAE 2013 of LEO and 56% of Geo
report, we estimate that 18 satellites (GEO and LEO only) satellites are insured, globally
are damaged in the S1 scenario variant
o Permanent loss of functionality, machinery breakdown
– Assumed asset values (from Swiss Re Report, 2011):
o LEO: $75 million
o GEO: $150 million
– We also assume on 20% damage factor
o Deductible: no deductible
o Limit: no limit
o Total: $218 million of payouts
It is estimated that this scenario will
impacted 10% of satellites
17Insurance Industry Loss Estimates for Solar Storm Scenario
Scenario Outage Total Direct and Indirect, US Insurance Insurance Loss as
Variant Duration US only, $ Bn Industry Loss a % of economic
Estimate, $ Bn loss
S1 6 months $474 $55 12%
S2 8 months $1,532 $173 11%
X1 12 months $2,693 $334 12%
For context:
Total insurance catastrophe losses 2015: $85 Bn
Hurricane Katrina 2005: $80 Bn
Tohoku Earthquake Japan 2011: $38 Bn
Superstorm Sandy 2012: $37 Bn
Hurricane Andrew 1992: $28 Bn
9/11 WTC 2001: $26 Bn
[2015 $ value]
18Areas Not Estimated Where Losses Could Occur
Transformer manufacturers
Telecommunications and GPS/GNSS failure
Rail transportation
Goods in transit
Auto
Aviation
Travel
Industrial accidents/environmental liability
19Mitigation Plans
Operational mitigation
– Relies on early notification systems
– Increase spinning reserve and reactive power
– Reduce/remove the load on key transformers
– Unlikely that equipment will be turned off
Engineering mitigations
– Hardening the transmission equipment to prevent GICs from flowing through it, more
resistive transformers
o Requires expensive capital improvements/replacements
Progress by geography
– UK: replacing about 10 transformers per year, currently have 50% more resistive
– US: NERC is still in review period of the engineering/thermal assessments
requirement
– Australia: has recently done solar storm studies of its electricity system
– Nordic Countries: well prepared
– Japan: just starting to look into engineering improvements, but very concerned of the
threat
– China: just took first geomagnetic measurements this year
Improving solar storm forecasting and upgrading solar storm early warning/alert
systems
Use smarter grid technologies to improve situational awareness such as
automatic voltage stabilisation and other automatic protective measures
Coordinated policy action
20You can also read